• Visão global
  • Comentários (3)
  • Discussão (3)
  • O que há de novo

ZigZag New

5

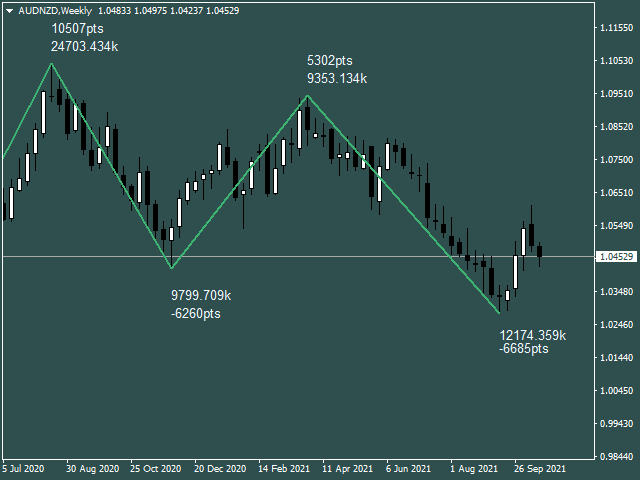
Informative & optimized Zigzag, Accumulated volume, Price change 

A rewrite of the traditional zigzag tool with new additions.

Features:-

  • Optimized code
  • Displays accumulated volume between peaks
  • Displays price change between peaks

Usage:-

  • Identify trend swings
  • Identify high volume swings
  • Compare price changes between swings
  • Drawing Fibonacci tool on strong price change or high volume swings

Comentários 3
Alexander Chernov
69
Alexander Chernov 2023.03.14 09:31 
 

Хорошо бы добавить настраиваемую линейку Фибоначи, что бы она появлялась при нажатии на линию зигзаг пример (https://prnt.sc/GFhZ5iOk1xGB и https://prnt.sc/h4V_7OjjQD8u ) спасибо

SandPaddict
129
SandPaddict 2022.10.03 00:37 
 

Great little indicator. Clean. Does what it says and has some nice little features. Thank you

lawfuller
101
lawfuller 2022.05.27 02:41 
 

This indicator is flippin great! You can even reduce the lookback period to 1 to see the values for every price pivot. Fab!

Produtos recomendados
Are you tired of drawing trendlines every time you're analyzing charts? Or perhaps you would like more consistency in your technical analysis. Then this is for you. This indicator will draw trend lines automatically when dropped on a chart. How it works Works similar to standard deviation channel found on mt4 and mt5. It has 2 parameters: 1. Starting Bar 2. Number of bars for calculation The   starting bar   is the bar which drawing of the trend lines will begin, while the   number of bars for c
FREE
TrendPlus
Sivakumar Subbaiya
4.21 (14)
Trend Plus   Trendplus  Indicator   Time Frame: Suitable for any time frame.  Purpose: Trend Prediction. Blue and red candle indicate the buy and sell call respectively. Buy: When the blue candle is formed buy call is initiated. close the buy trades when the next red candle will formed.   Sell: When the Red candle is formed Sell call is initiated. close the Sell trades when the next blue candle will formed.   Happy trade!!
FREE
Rainbow MT4
Jamal El Alama
Rainbow MT4 is a technical indicator based on Moving average with period 34 and very easy to use. When price crosses above MA and MA changes color to green, it’s a signal to buy. When price crosses below MA and MA changes color to red, it’s a signal to sell. The Expert advisor ( Rainbow EA MT4) based on Rainbow MT4 indicator, as you can see in the short video below is now available here .
FREE
Discover the power of precision and efficiency in your trading with the " Super Auto Fibonacci " MT4 indicator. This cutting-edge tool is meticulously designed to enhance your technical analysis, providing you with invaluable insights to make informed trading decisions. Key Features: Automated Fibonacci Analysis: Say goodbye to the hassle of manual Fibonacci retracement and extension drawing. "Super Auto Fibonacci" instantly identifies and plots Fibonacci levels on your MT4 chart, saving you tim
FREE
MegaTrends
Sivakumar Subbaiya
1 (1)
Megatrends  Indicator   Time Frame: Suitable for any time frame.  Purpose: Trend Prediction. Blue and red color indicate the buy and sell call respectively. Buy: When the blue line is originating it is opened buy call. Sell: When the Red line is origination it is opened sell call Happy trade!! this indicator is suitable for all time frame, but our recommended time frame to use 1hour and 4 hours, suitable for any chart.
FREE
Trend arrow Indicator
NGUYEN NGHIEM DUY
3.23 (13)
Trend arrow Indicator is an arrow Indicator used as an assistant tool for your trading strategy. The indicator analyzes the standard deviation of bar close for a given period and generates a buy or sell signals if the deviation increases. It good to combo with Martingale EA to follow Trend and Sellect Buy Only/Sell Only for EA work Semi-Automatic. You can use this  Indicator with any EAs in my Products.
FREE
Renko bars builder
Navdeep Singh
5 (5)
The indicator builds a Renko chart in the sub window for the current symbol. The bars are formed from live data and the desired bar size can be set in the inputs tab. Most importantly, because the Renko chart only uses price to construct bars and ignores time, the indicator can be applied to any time frame and same results can be achieved. Recommended usage As Renko charts are famous for eliminating noise so traders can use this tool to see clear picture of the trend to help their analysis, ent
FREE
This indicator alerts you when/before new 1 or 5 minute bar candle formed. In other words,this indicator alerts you every 1/5 minutes. This indicator is especially useful for traders who trade when new bars formed. *This indicator don't work propery in strategy tester.Use this in live trading to check functionality. There is more powerful Pro version .In Pro version,you can choose more timeframe and so on. Input Parameters Alert_Or_Sound =Sound ----- Choose alert or sound or both to not
FREE
Virtual Targets
Hoang Van Dien
4 (7)
This indicator is very useful for day traders or short term traders. No need to calculate the number of pips manually, just look at the chart and you will see the Virtual Take Profit / Virtual Stop Loss target line and evaluate whether the entry point is feasible to reach the intended target or not. Enter the intended Take Profit / Stop Loss pips for your trade. The indicator will display Virtual Take Profit / Virtual Stop Loss lines for you to easily see if the target is feasible or not.
FREE
Toby Strategy Indicator
Ahmd Sbhy Mhmd Ahmd ʿYshh
The indicator rely on The Toby strategy >> The mother candle which is bigger in range than the previous six candles. A vertical line shows the last Toby Candle with the targets shown up and down. The strategy is about the closing price out of the range of the toby candle to reach the 3 targets..The most probable to be hit is target1 so ensure reserving your profits and managing your stop lose.
FREE
Wicks UpDown Target GJ Wicks UpDown Target GJ is specialized in GJ forex pairs. Choppy movement up and down on the opening range every day.  Trading breakouts on London session and New York session is recommended. Guideline Entry Strategy Idea: Step 1 - Breakout Forming (Warning! Trade on London Session and New York Session) Step 2 - Breakout Starting (Take Action on your trading plan) Step 3 - Partial Close your order & set breakeven (no-risk) Step 4 - Target complete Step 5 - Don't tr
FREE
Multi Divergence Indicator for MT4 - User Guide Introduction Overview of the Multi Divergence Indicator and its capabilities in identifying divergences across multiple indicators. Importance of divergence detection in enhancing trading strategies and decision-making. List of Indicators RSI CCI MACD STOCHASTIC AWSOME MFI ACCELERATOR OSMA MOMENTUM WPR( Williams %R) RVI Indicator Features Indicator Selection: How to enable/disable specific indicators (RSI, CCI, MACD, etc.) for divergence detection.
FREE
QuantumAlert Stoch Navigator is a free indicator available for MT4/MT5 platforms, its work is to provide "alerts" when the market is inside "overbought and oversold" regions in the form of "buy or sell" signals. This indicator comes with many customization options mentioned in the parameter section below, user can customise these parameters as needful. Join our   MQL5 group , where we share important news and updates. You are also welcome to join our private channel as well, contact me for the p
FREE
O Pivot Point Fibo RSJ é um indicador que traça as linhas de suporte e resistência do dia usando as proporções   de Fibonacci. Este indicador espetacular cria até 7 níveis de suporte e resistência por meio do Pivot Point usando proporções de Fibonacci. É fantástico como os preços respeitam cada nível deste suporte e resistência, onde é possível perceber possíveis pontos de entrada / saída de uma operação. Recursos Até 7 níveis de suporte e 7 níveis de resistência Defina as cores dos níveis in
FREE
Free automatic Fibonacci is an indicator that automatically plots a Fibonacci retracement based on the number of bars you select on the BarsToScan setting in the indicator. The Fibonacci is automatically updated in real time as new highest and lowest values appears amongst the selected bars. You can select which level values to be displayed in the indicator settings. You can also select the color of the levels thus enabling the trader to be able to attach the indicator several times with differe
FREE
--->  Check all the other products  <--- The Candle Bias is a coloring indicator that doesn't take account of the close price of the bars.  It will color the candle in the bearish color (of your choice) if the downard range is greater than the upward range.  Conversely, it will color the candle in the bullish color of your choice if the upward range is greater than the downward range.  This is a major helper for Multi Time Frame analysis, it works on every security and every Time Frame. You
FREE
Email Drawdown Alert
Roman Starostin
5 (15)
Free informative Indicator-helper. It'll be usefull for traders who trade many symbols or using grid systems (Averaging or Martingale). Indicator counts drawdown as percent and currency separate. It has a number of settings: Count deposite drawdown according equity value and send e-mail or notifications to user if DD more than set; Sending e-mail when max open orders reached; Shows price and remaining pips amount before MarginCall on current chart and Account generally; Display summary trade lot
FREE
Bem-vindo ao nosso   Padrão de onda de preço   MT4 --(Padrão ABCD)--     O padrão ABCD é um padrão de negociação poderoso e amplamente utilizado no mundo da análise técnica. É um padrão de preço harmônico que os traders usam para identificar oportunidades potenciais de compra e venda no mercado. Com o padrão ABCD, os traders podem antecipar possíveis movimentos de preços e tomar decisões informadas sobre quando entrar e sair das negociações. Versão EA:   Price Wave EA MT4 Versão MT5:   Pri
FREE
Candle GAP
Thushara Dissanayake
4.33 (3)
O indicador   Candle GAP   é uma ferramenta essencial para os traders que utilizam   Gap Trading Strategies   , pois identifica automaticamente os gaps das velas para cada dia da semana. Uma lacuna refere-se a uma diferença de nível de preço entre o fechamento e a abertura de dois dias consecutivos. Este indicador reconhece quatro tipos de padrões de gap: Comum, Breakaway, Continuação e Exaustão. Ao incorporar este indicador em qualquer gráfico, os traders podem validar seus sinais e aprimorar s
FREE
This indicator scans for you up to 30 trading instruments and up to 8 timeframes for occurrences of the high probability reversal patterns: Double Tops/Bottoms with fake breakouts . Please read also the blog post " Professional Trading With Double Tops/Bottoms And Divergences! " which explains the concepts behind the ULTIMATE Double Top/Bottom indicator and how you can use a professional top-down approach. This FREE Version of the Scanner scans only EURUSD and GBPUSD. The full version of the sca
FREE
Follow The Line
Oliver Gideon Amofa Appiah
4.07 (14)
FOLLOW THE LINE GET THE FULL VERSION HERE: https://www.mql5.com/en/market/product/36024 This indicator obeys the popular maxim that: "THE TREND IS YOUR FRIEND" It paints a GREEN line for BUY and also paints a RED line for SELL.  It gives alarms and alerts of all kinds. IT DOES NOT REPAINT and can be used for all currency pairs and timeframes. Yes, as easy and simple as that. Even a newbie can use it to make great and reliable trades. NB: For best results, get my other premium indicators for more
FREE
Triple RSI
Pablo Leonardo Spata
2.5 (2)
OLHE A SEGUINTE ESTRATÉGIA COM ESTE INDICADOR. O RSI triplo é uma ferramenta que usa o RSI clássico, mas em vários períodos de tempo para encontrar reversões do mercado. 1. ️ Idéia por trás do indicador e sua estratégia: Na negociação, seja Forex ou qualquer outro ativo, o ideal é manter a simplicidade, quanto mais simples melhor. A estratégia de triplo RSI é uma das estratégias simples que buscam retornos de mercado. Em nossa experiência, onde sempre há mais dinheiro a ganhar, é n
FREE
Features: 1- Get OB/OS Levels from Golden MA Levels 2- Wait for Buy/Sell Start Level Cross 3- Optional: Should price cross Mid Level in earlier bars 4- Optional: Crossing bar High/Medium Volume 5- Optional: MA Stacked to check up/down trend for current TF 6- Optional: NRTR higher timeframes aligned Check Detailed blog post explained: https://www.mql5.com/en/blogs/post/758457 Levels with Buffers available here: Golden MA Levels Indicator: https://www.mql5.com/en/market/product/119515
FREE
HMA Trend
Pavel Zamoshnikov
4.62 (84)
A trend indicator based on the Hull Moving Average (HMA) with two periods. The Hull Moving Average is an improved variant of the moving average, which shows the moment of trend reversal quite accurately. It is often used as a signal filter. Combination of two types of Hull Moving Averages makes a better use of these advantages: HMA with a slow period identifies the trend, while HMA with a fast period determines the short-term movements and signals in the trend direction. Features The movement
FREE
Pin Bars
Yury Emeliyanov
5 (5)
Objectivo principal: "Pin Bars" destina-se a detectar automaticamente barras de pinos nos gráficos dos mercados financeiros. Uma barra de pinos é uma vela com um corpo característico e uma cauda longa, que pode sinalizar uma reversão ou correção de tendência. Como funciona: o indicador analisa cada vela no gráfico, determinando o tamanho do corpo, cauda e nariz da vela. Quando uma barra de pinos correspondente a parâmetros predefinidos é detectada, o indicador marca-a no gráfico com uma seta
FREE
YOU CAN NOW DOWNLOAD FREE VERSIONS OF OUR PAID INDICATORS . IT'S OUR WAY OF GIVING BACK TO THE COMMUNITY ! >>>    GO HERE TO DOWNLOAD This system is an Heiken Ashi system based on RSI calculations . The system is a free open source script originally published on TradingView by JayRogers . We have taken the liberty of converting the pine script to Mq4 indicator . We have also added a new feature which enables to filter signals and reduces noise on the arrow signals. Background HEIKEN ASHI
FREE
FREE UNLIMITED PM : https://linktr.ee/ARFXAUTOTRADE?utm_source=linktree_admin_share Trend Line is very useful for trader friends, both for mapping following trends and counter trends, here I am sharing an auto trend line indicator I made that you can use to make it easier for you to see the market.  How to use trend line:  01. Follow our trend, wait for the trend line to return and touch our trend line and form a continuation pattern on the candle stick 02. Counter Trend We wait for 1 ca
FREE
MASi Three Screens
Aleksey Terentev
5 (3)
MASi Three Screens is based on the trading strategy by Dr. Alexander Elder. This indicator is a collection of algorithms. Algorithms are based on the analysis of charts of several timeframes. You can apply any of the provided algorithms. List of versions of algorithms:     ThreeScreens v1.0 - A simple implementation, with analysis of the MACD line;     ThreeScreens v1.1 - A simple implementation, with analysis of the MACD histogram;     ThreeScreens v1.2 - Combines the first two algorithms
FREE
Color Macd Tf
Syarif Nur Arief
MACD is well known indicator that still can be use for prediction where price will go next few minutes, hours or even weekly  With colored bar of Macd, your eyes can easily catch when color is changed based what market price movement to find any early trend on market. here is the parameter of the indicator: TF_MACD , default is 1 Hour , this mean you can see clearly MACD of 1 Hour TimeFrame on Lower TimeFrame. InpPrice , default is Price Close , this is original MACD parameter from Metaquotes st
FREE
Auto Trend Lines Standard
Gowtham Arputharaj
5 (1)
Standard Trend Lines (Automatic). This indicator draws highly accurate trend lines. It draws Trend Lines automatically. This Trend Lines indicator was made by observing lot of discussions made about Trend Lines in forum. The Trend Lines can also be used to create Expert Advisor. Latest valid Trend Lines are drawn on Chart. Trend Lines Work on basis of OHLC price data.
FREE
Os compradores deste produto também adquirem
Gann Made Easy
Oleg Rodin
4.88 (100)
Gann Made Easy é um sistema de negociação Forex profissional e fácil de usar, baseado nos melhores princípios de negociação usando a teoria do sr. W. D. Gann. O indicador fornece sinais precisos de COMPRA e VENDA, incluindo níveis de Stop Loss e Take Profit. Você pode negociar mesmo em movimento usando notificações PUSH. Entre em contato comigo após a compra! Vou compartilhar minhas dicas de negociação com você e ótimos indicadores de bônus de graça! Provavelmente você já ouviu muitas vezes sobr
Trend Punch
Mohamed Hassan
4.92 (24)
This indicator is unstoppable when combined with our other indicator called  Support & Resistance . After purchase, send us a message and you will get it   for  FREE as a BONUS! Introducing Trend Punch , the revolutionary forex trend indicator that will transform the way you trade! Trend Punch is uniquely designed to provide precise buy and sell arrows during strong market trends, making your trading decisions clearer and more confident. Whether you're trading major currency pairs or exotic sym
Gold Stuff
Vasiliy Strukov
4.9 (270)
Gold Stuff-um indicador de tendência projetado especificamente para o ouro, também pode ser usado em qualquer instrumento financeiro. O indicador não é redesenhado ou atrasado. O timeframe recomendado é H1. O EA Gold Stuff Expert Advisor está escrito neste indicador, você pode encontrá-lo no meu perfil. Importante! Entre em contato comigo imediatamente após a compra para obter instruções e bônus!  Você pode obter uma cópia gratuita do nosso indicador Strong Support e Trend Scanner, envie um
FX Power MT4 NG
Daniel Stein
5 (13)
Receba a sua atualização diária do mercado com detalhes e screenshots através do nosso Morning Briefing aqui no mql5 e no Telegram ! O FX Power MT4 NG é a próxima geração do nosso medidor de força de moeda muito popular de longa data, o FX Power. E o que é que este medidor de força da próxima geração oferece? Tudo o que adorou no FX Power original MAIS Análise de força GOLD/XAU Resultados de cálculo ainda mais precisos Períodos de análise configuráveis individualmente Limite de cálculo personal
LEIA AS INFORMAÇÕES ABAIXO ANTES DE COMPRAR O PRODUTO! Apollo Pips PLUS SP é um produto único! É PARA QUEM QUER ADQUIRIR MEU NOVO INDICADOR "APOLLO PIPS" MAIS BÔNUS "SUPER PACK" COM ACESSO A TODOS OS MEUS INDICADORES DE NEGOCIAÇÃO! Ao adquirir o produto Apollo Pips PLUS SP você está na verdade adquirindo uma versão absolutamente nova do meu indicador Apollo Pips. Esta versão do indicador possui um algoritmo aprimorado e um parâmetro fácil de usar que lhe dá a oportunidade de usar o indicador em
TPSproTREND PrO
Roman Podpora
4.79 (19)
TPSpro TREND PRO   é um indicador de tendência que analisa automaticamente o mercado e fornece informações sobre a tendência e cada uma de suas mudanças, além de dar sinais para entrar em negociações sem redesenhar! O indicador utiliza cada vela, analisando-as separadamente. referindo-se a diferentes impulsos - impulso para cima ou para baixo. Pontos de entrada exatos em transações de moedas, criptomoedas, metais, ações, índices! Versão MT5                   DESCRIÇÃO COMPLETA DO INDICADOR    
Trend Pulse
Mohamed Hassan
5 (5)
Please contact me after purchase to immediately get your PDF strategy + documentation for Trend Pulse !  Official release price of $89  (2 /50 copies left). Next price is $199 . Introducing Trend Pulse , a unique and robust indicator capable of detecting bullish, bearish, and even ranging trends! Trend Pulse uses a special algorithm to filter out market noise with real precision. If the current symbol is moving sideways, Trend Pulse will send you a ranging signal, letting you know that it'
Scalper Inside PRO
Alexey Minkov
4.75 (60)
An exclusive indicator that utilizes an innovative algorithm to swiftly and accurately determine the market trend. The indicator automatically calculates opening, closing, and profit levels, providing detailed trading statistics. With these features, you can choose the most appropriate trading instrument for the current market conditions. Additionally, you can easily integrate your own arrow indicators into Scalper Inside Pro to quickly evaluate their statistics and profitability. Scalper Inside
Atomic Analyst
Issam Kassas
5 (3)
Primeiramente, vale ressaltar que este Indicador de Negociação não repinta, não redesenha e não apresenta atrasos, tornando-o ideal tanto para negociação manual quanto automatizada. Manual do utilizador: configurações, entradas e estratégia. O Analista Atômico é um Indicador de Ação de Preço PA que utiliza a força e o momentum do preço para encontrar uma vantagem melhor no mercado. Equipado com filtros avançados que ajudam a remover ruídos e sinais falsos, e aumentam o potencial de negociação.
Trend Screener
STE S.S.COMPANY
4.82 (92)
Indicador de tendência, solução única inovadora para negociação e filtragem de tendências com todos os recursos de tendências importantes construídos dentro de uma ferramenta! É um indicador multi-timeframe e multi-moedas 100% sem repintura que pode ser usado em todos os símbolos/instrumentos: forex, commodities, criptomoedas, índices e ações. O Trend Screener é um indicador eficiente que segue a tendência do indicador que fornece sinais de tendência de seta com pontos no gráfico. Os recursos qu
Currency Strength Wizard é um indicador muito poderoso que fornece uma solução completa para uma negociação bem-sucedida. O indicador calcula o poder deste ou daquele par forex usando os dados de todas as moedas em vários intervalos de tempo. Esses dados são representados em uma forma de índice de moeda fácil de usar e linhas de energia de moeda que você pode usar para ver o poder desta ou daquela moeda. Tudo o que você precisa é anexar o indicador ao gráfico que deseja negociar e o indicador mo
- Real price is 80$ - 40% Discount ( It is 49$ now ) Contact me for instruction, any questions! Introduction The breakout and retest strategy is traded support and resistance levels. it involves price breaking through a previous level.  The break and retest strategy is designed to help traders do two main things, the first is to avoid false breakouts. Many false breakouts start with a candlestick that breaks out of a level but ends with an immediate candlestick that brings the price back into t
Actualmente 20% OFF ! A melhor solução para qualquer novato ou comerciante especializado! Este software de painel de instrumentos está a funcionar em 28 pares de moedas. É baseado em 2 dos nossos principais indicadores (Advanced Currency Strength 28 e Advanced Currency Impulse). Dá uma grande visão geral de todo o mercado Forex. Mostra valores avançados de força da moeda, velocidade de movimento da moeda e sinais para 28 pares de divisas em todos os (9) períodos de tempo. Imagine como a sua
Clear Breakout
Martin Alejandro Bamonte
5 (1)
O indicador "Breakout Buy-Sell" foi desenvolvido para identificar e destacar potenciais oportunidades de compra e venda com base em rompimentos de preços durante diferentes sessões de mercado (Tóquio, Londres e Nova York). Este indicador ajuda os traders a visualizar claramente as zonas de compra e venda, bem como os níveis de take-profit (TP) e stop-loss (SL). Estratégia de Uso O indicador pode ser usado da seguinte maneira: Configuração Inicial : Selecione a sessão do mercado e ajuste o offset
ACTUALMENTE COM 26% DE DESCONTO A melhor solução para qualquer novato ou comerciante especializado! Este Indicador é uma ferramenta comercial única, de alta qualidade e acessível, porque incorporámos uma série de características proprietárias e uma nova fórmula. Com apenas UM gráfico, pode ler a força da moeda para 28 pares de Forex! Imagine como a sua negociação irá melhorar porque é capaz de apontar o ponto exacto do gatilho de uma nova tendência ou oportunidade de escalada? Manual do u
O sistema PRO Renko é um sistema de negociação altamente preciso especialmente concebido para a negociação de gráficos RENKO. Trata-se de um sistema universal que pode ser aplicado a vários instrumentos de negociação. O sistema neutraliza eficazmente o chamado ruído de mercado, dando-lhe acesso a sinais de inversão precisos. O indicador é muito fácil de usar e tem apenas um parâmetro responsável pela geração de sinal. Você pode facilmente adaptar a ferramenta a qualquer instrumento de negoc
Gold Channel   é um indicador baseado na volatilidade, desenvolvido com um algoritmo de tempo especifico para o par XAUUSD que consiste em encontrar possíveis correções no mercado. Este indicador mostra duas linhas exteriores, uma interior (linha de retração) e um sinal de seta, onde a teoria do canal consiste em ajudar a identificar condições de sobrecompra e sobrevenda no mercado. O preço do mercado cairá geralmente entre os limites do canal. Se os preços tocarem ou se moverem para fora do can
Antes de tudo, vale ressaltar que esta Ferramenta de Negociação é um Indicador Não Repintante, Não Redesenhante e Não Atrasado, o que a torna ideal para negociação profissional. Curso online, manual do utilizador e demonstração. O Indicador de Conceitos de Ação de Preço Inteligente é uma ferramenta muito poderosa tanto para traders novos quanto experientes. Ele combina mais de 20 indicadores úteis em um único, combinando ideias avançadas de negociação como Análise do Trader do Círculo Interno e
ACTUALMENTE 31% DE DESCONTO!! A melhor solução para qualquer novato ou comerciante especializado! Este indicador é uma ferramenta comercial única, de alta qualidade e acessível, porque incorporámos uma série de características proprietárias e uma fórmula secreta. Com apenas UM gráfico, dá alertas para todos os 28 pares de moedas. Imagine como a sua negociação irá melhorar porque é capaz de identificar o ponto exacto de desencadeamento de uma nova tendência ou oportunidade de escalada! Con
NAM Order Blocks
NAM TECH GROUP, CORP.
5 (1)
Indicador de detecção de blocos de pedidos de multi-timeframe MT4. Características - Totalmente personalizável no painel de controle do gráfico, fornece interação completa. - Oculte e mostre o painel de controle onde quiser. - Detectar OBs em vários períodos de tempo. - Selecione a quantidade de OBs para exibir. - Interface de usuário de OBs diferente. - Filtros diferentes em OBs. - Alerta de proximidade OB. - Linhas ADR de alta e baixa. - Serviço de notificação (alertas de
RelicusRoad Pro
Relicus LLC
4.73 (141)
Agora US $ 147 (aumentando para US $ 499 após algumas atualizações) - Contas ilimitadas (PCs ou Macs) Manual do usuário do RelicusRoad + vídeos de treinamento + acesso ao grupo de discórdia privado + status VIP UMA NOVA FORMA DE OLHAR PARA O MERCADO O RelicusRoad é o indicador de negociação mais poderoso do mundo para forex, futuros, criptomoedas, ações e índices, oferecendo aos traders todas as informações e ferramentas necessárias para se manterem rentáveis. Fornecemos análises técnica
PZ Trend Trading
PZ TRADING SLU
4.8 (5)
O Trend Trading é um indicador projetado para lucrar o máximo possível com as tendências que ocorrem no mercado, cronometrando retrocessos e rupturas. Ele encontra oportunidades de negociação analisando o que o preço está fazendo durante as tendências estabelecidas. [ Guia de instalação | Guia de atualização | Solução de problemas | FAQ | Todos os produtos ] Negocie mercados financeiros com confiança e eficiência Lucre com as tendências estabelecidas sem ser chicoteado Reconhecer retrocesso
TPSpro RFI Levels
Roman Podpora
4.83 (24)
Reversal First Impulse levels (RFI)    INSTRUCTIONS        RUS       -       ENG              R ecommended to use with an indicator   -   TPSpro  TREND PRO -  Version MT5 A key element in trading is zones or levels from which decisions to buy or sell a trading instrument are made. Despite attempts by major players to conceal their presence in the market, they inevitably leave traces. Our task was to learn how to identify these traces and interpret them correctly. Main functions: Displaying activ
Break and Retest
Mohamed Hassan
4.17 (18)
This Indicator only places quality trades when the market is really in your favor with a clear break and retest. Patience is key with this price action strategy! If you want more alert signals per day, you increase the number next to the parameter called: Support & Resistance Sensitivity.  After many months of hard work and dedication, we are extremely proud to present you our  Break and Retest price action indicator created from scratch. One of the most complex indicators that we made with ove
Order Block Hunter
Noha Mohamed Fathy Younes Badr
5 (2)
Order block hunter indicator is the best indicator for  hunt the order blocks that area where there has been a large concentration of limit orders waiting to be executed Order blocks are identified on a chart by observing previous price action and looking for areas where the price experienced significant movement or sudden changes in direction .This indicator does that for you by using very complicated codes and helps you to take the best areas To buy and sell because it make marks at the best a
Scalper Vault
Oleg Rodin
5 (29)
Scalper Vault é um sistema profissional de escalpelamento que fornece tudo o que você precisa para um escalpelamento bem-sucedido. Este indicador é um sistema de negociação completo que pode ser usado por comerciantes de forex e opções binárias. O período de tempo recomendado é M5. O sistema fornece sinais de seta precisos na direção da tendência. Ele também fornece sinais superiores e inferiores e níveis de mercado Gann. Os indicadores fornecem todos os tipos de alertas, incluindo notificações
IX Power MT4
Daniel Stein
5 (6)
O IX Power traz finalmente a precisão imbatível do FX Power para símbolos não-Forex. Determina com exatidão a intensidade das tendências a curto, médio e longo prazo nos seus índices, acções, mercadorias, ETFs e até criptomoedas favoritos. Pode analisar tudo o que o seu terminal tem para oferecer. Experimente e veja como o seu timing melhora significativamente quando negoceia. Características principais do IX Power Resultados de cálculo 100% precisos e sem repintura - para todos os símb
Desenhe automaticamente os níveis de apoio e resistência MAIS espaços de velas de propulsão no seu gráfico, para que possa ver para onde é provável que o preço se dirija a seguir e/ou potencialmente inverta. Este indicador foi concebido para ser utilizado como parte da metodologia de negociação de posições ensinada no meu website (The Market Structure Trader) e exibe informação chave para a segmentação e potenciais entradas. Existem 2 características CORE no indicador e 4 características ad
M1 Arrow
Oleg Rodin
4.73 (15)
Uma estratégia intradiária baseada em dois princípios fundamentais do mercado. O algoritmo é baseado na análise de volumes e ondas de preços usando filtros adicionais. O algoritmo inteligente do indicador dá um sinal apenas quando dois fatores de mercado se combinam em um. O indicador calcula ondas de um determinado intervalo no gráfico M1 usando os dados do período de tempo mais alto. E para confirmar a onda, o indicador utiliza a análise por volume. Este indicador é um sistema de negociação pr
Torne-se um Negociador Breaker e lucre com as mudanças na estrutura do mercado à medida que o preço reverte. O indicador de quebra de bloco de pedidos identifica quando uma tendência ou movimento de preço está chegando à exaustão e pronto para reverter. Ele o alerta sobre mudanças na estrutura do mercado, que normalmente ocorrem quando uma reversão ou uma grande retração está prestes a ocorrer. O indicador usa um cálculo proprietário que identifica rupturas e momento do preço. Toda vez que
Mais do autor
The indicator helps the trader in identifying potential liquidity levels. The algorithm used in this indicator checks the behavior of the asset taking into account the price levels, momentum and volume analysis. Features:- Parameters for signal optimization and alerts. Usage:- The levels formed by the indicator can be helpful to traders in identifying potential entries, breakouts or reversals. it can assist traders of technical trading background or even pure price action trading.
The indicator is designed to detect range market or consolidation areas on the chart. It does this by using the market volatility and price momentum. The indicator signals the start and stop of the range with icons on the chart and various  type of alerts options provided in the input settings. Usage: The indicator can be used to check the state of the market i.e. trending or ranging to make appropriate decision and use strategies designed for specific market state. Please see the attached video
Renko bars builder
Navdeep Singh
5 (5)
The indicator builds a Renko chart in the sub window for the current symbol. The bars are formed from live data and the desired bar size can be set in the inputs tab. Most importantly, because the Renko chart only uses price to construct bars and ignores time, the indicator can be applied to any time frame and same results can be achieved. Recommended usage As Renko charts are famous for eliminating noise so traders can use this tool to see clear picture of the trend to help their analysis, ent
FREE
RSI Scanner, Multiple Symbols and Timeframes, Graphical User Interface An indicator that scans multiple symbols added from the market watch and timeframes and displays result in a graphical panel. Features: Multi symbol Multi timeframe Alerts and Notifications Live Monitoring Sorting modes One click to change symbol and timeframe Inputs for RSI and scanner settings
FREE
ADR Bands
Navdeep Singh
4.33 (3)
Average daily range, Projection levels, Multi time-frame ADR bands shows levels based on the selected time-frame. Levels can be used as projections for potential targets, breakouts or reversals depending on the context in which the tool is used. Features:- Multi time-frame(default = daily) Two coloring modes(trend based or zone based) Color transparency  
FREE
RSI Scanner, Multiple Symbols and Timeframes, Graphical User Interface An indicator that scans multiple symbols added from the market watch and timeframes and displays result in a graphical panel. Features: Multi symbol Multi timeframe Alerts and Notifications Live Monitoring Sorting modes One click to change symbol and timeframe Inputs for RSI and scanner settings
FREE
Algorithmic Signals indicator   is not an indicator but a strategy that generates entry/exit signals. The entry arrows are formed after multiple conditions are met. The indicator is using an   Adaptive Algorithm   which automatically adjust to the symbol and time frame (see the screenshots below) . Signals can be used for scalping or even trend trading. Main features:- Non repainting signals Entry signals Exit signals Alert for price reaching 1 x ATR(14) (could be utilized for initial take prof
Stochastic force is an advanced version of the stochastic oscillator. Instead of using the regular price a more efficient price data is provided as an input for the oscillator which takes into account the price efficiency, volume and market noise. Also price is pre-filtered with the selected average type and then post-filtered by a hull moving average which provides a smooth transition of the oscillator. It eliminates maximum false signals and has the potential to become an integral part of any
This is the new version of the Algorithmic signals featuring a new algorithm. It is a blend of technical and candlestick analysis. Candlestick analysis are often ignored while creating technical strategies but this version has a feature to include that and make confirmations more strong.  Usage:- Traders can use the signals for buying and selling assets or even blend their own favorite indicators with it.
TDI Signals generates buy and sell arrows based on a TDI(Traders Dynamic Index) algorithm. It looks for price breakouts, continuations and reversals. By default it runs in the trend mode but user is provided with the option to change that to reversal mode. Trader can use the mode which compliments his/her trading style.  Usage:-   TDI Signals can be used as a stand alone indicator with context or even be added to strategies to make confirmations more strong. Volatility based stop loss, take pr
RSI Levels generates buy and sell arrows based on RSI analysis. Signals are based on extreme levels breakouts and can be further filtered by a volatility metric. Trader can use the mode which compliments his/her trading style.  Features:- Parameters for signal optimization and alerts. Usage:-   RSI Levels can be used as a stand alone indicator with context or even be added to strategies to make confirmations more strong. Volatility based stop loss, take profit & position sizing can be very helpf
The indicator helps the trader in identifying potential liquidity levels. The algorithm used in this indicator checks the behavior of the asset taking into account the price levels, momentum and volume analysis. Features:- Parameters for signal optimization and alerts. Usage:- The levels formed by the indicator can be helpful to traders in identifying potential entries, breakouts or reversals. it can assist traders of technical trading background or even pure price action trading. Examples o
Step force index is a modified version of the famous force index indicator. As the name suggests it incorporates a step feature to filter the force index values thus eliminating small fluctuations in the indicator. It also utilizes the smooth algorithm library thereby providing multiple smoothing options for the index values. This personal implementation makes it a more easy to use and a reliable tool. Main features A wide range of parameters for signals optimization Alerts, emails and push noti
CMA dashboard is designed to help traders in identifying trend on multiple timeframes and symbols. It displays a clear state of the overall trend at one place without the need to navigate between different charts and timeframes. This saves time and makes decision making process fast so that potential opportunities are not missed. It is based on Corrected moving averages available here Features Parameters for signal optimization Inputs for multiple timeframes and symbols  Usage Higher timeframe
IBB Candles is a tool that is based on the concept of Inverse Bollinger Bands. It compares price relative to state of the bands and plots candles with different colors defining the current state of the market i.e range | trend | strong trend. As the name suggests IBB(Inverse Bollinger Bands) is a technique which is completely different from the traditional Bollinger Bands and proves to be much more effective in analyzing market. This personal implementation makes this tool a more reliable option
Market structures, Market balance, Range breakouts This tools helps to identify areas of market ranges, structures and plots colored boxes on breakout of those areas. User is given the option to receive alerts and notifications on the formation of the blocks. The tool has the ability to become an essential part of a technical trading system or even pure price action trading. Usage:- An essential tool for price action or technical traders.  More information in the blog
Horizontal volume bars, Cluster analysis, Volume profile Volume in Range gets information about the accumulated volume in a specified vertical range and period in bars. The received data is then plotted on the chart as rectangular boxes with the volume quantity inside. Usage:- The tool acts as a support resistance levels but most importantly it should be used to check in which direction the price breaks out of the significant levels formed by this indicator and then actions to be taken on correc
This utility is specifically designed for No Nonsense Forex traders. What it does:- Let traders add or remove symbols to trade Editable boxes in panel for updating inputs Automatically applies money management to the trades Places all orders with a single click  How it calculates:- Two trades are opened per symbol By default max risk per trade is 1% By default total risk is 6% which can changed in inputs tab(recommended to keep it 6 or below)  On addition of symbols the total risk will be divide
Price breakouts, Levels, Multi-time frame Inside bars checks for price failure to break from the previous high/low and on breakout draws a breakout box on the chart. The choice of breakout price is given to the user i.e. close or high/low of bar. Alerts can be received on breakouts. Features:- Multi-time frame Alerts, notifications & emails Usage:- Breakout signals Check how price action is evolving with the help of boxes Get multi-time frame bias
Market Fractal Analysis, Fractal Swing, Market Flow Fractal Cycles looks for Similar Patterns in the Market that repeat themselves because of the Market Fractal Nature. These patterns are displayed with help of Graphical Objects and Alerts can be received on their arrival. Read the Blog for full information. Features:- Auto Detection of Patterns Customization for Color and Line Styles Alerts, Emails & Push Notifications 
50+ Candlestick Patterns, Simulated Trading Results, Top Five Performers Candle Analysis extends Candlesticks Pattern Analysis by not only identifying Patterns but also recording the Past Performance of the Patterns. What it Does:- Identifies and plots results on chart Displays Top Patterns for both Bullish and Bearish type.  Log can be printed in experts tab to see Simulated Trading results Displays All or Selected Patterns Alerts on Pattern formation More detailed information in Blog
Stochastic force is an advanced version of the stochastic oscillator. Instead of using the regular price a more efficient price data is provided as an input for the oscillator which takes into account the price efficiency, volume and market noise. Also price is pre-filtered with the selected average type and then post-filtered by a hull moving average which provides a smooth transition of the oscillator. It eliminates maximum false signals and has the potential to become an integral part of any
IBB Candles is a tool that is based on the concept of Inverse Bollinger Bands. It compares price relative to state of the bands and plots candles with different colors defining the current state of the market i.e range | trend | strong trend. As the name suggests IBB(Inverse Bollinger Bands) is a technique which is completely different from the traditional Bollinger Bands and proves to be much more effective in analyzing market. This personal implementation makes this tool a more reliable optio
Horizontal volume bars, Cluster analysis, Volume profile Volume in Range gets information about the accumulated volume in a specified vertical range and period in bars. The received data is then plotted on the chart as rectangular boxes with the volume quantity inside. Usage:- The tool acts as a support resistance levels but most importantly it should be used to check in which direction the price breaks out of the significant levels formed by this indicator and then actions to be taken on correc
Market structures, Market balance, Range breakouts This tools helps to identify areas of market ranges, structures and plots colored boxes on breakout of those areas. User is given the option to receive alerts and notifications on the formation of the blocks. The tool has the ability to become an essential part of a technical trading system or even pure price action trading. Usage:- An essential tool for price action or technical traders.  More information in the blog
Market Fractal Analysis, Fractal Swing, Market Flow Fractal Cycles looks for Similar Patterns in the Market that repeat themselves because of the Market Fractal Nature. These patterns are displayed with help of Graphical Objects and Alerts can be received on their arrival. Read the   Blog   for full information. Features:- Auto Detection of Patterns Customization for Color and Line Styles Alerts, Emails & Push Notifications
50+ Candlestick Patterns, Simulated Trading Results, Top Five Performers Candle Analysis extends Candlesticks Pattern Analysis by not only identifying Patterns but also recording the Past Performance of the Patterns. What it Does:- Identifies and plots results on chart Displays Top Patterns for both Bullish and Bearish type.  Log can be printed in experts tab to see Simulated Trading results Displays All or Selected Patterns Alerts on Pattern formation More detailed information in   Blog
Filtro:
Alexander Chernov
69
Alexander Chernov 2023.03.14 09:31 
 

Хорошо бы добавить настраиваемую линейку Фибоначи, что бы она появлялась при нажатии на линию зигзаг пример (https://prnt.sc/GFhZ5iOk1xGB и https://prnt.sc/h4V_7OjjQD8u ) спасибо

SandPaddict
129
SandPaddict 2022.10.03 00:37 
 

Great little indicator. Clean. Does what it says and has some nice little features. Thank you

lawfuller
101
lawfuller 2022.05.27 02:41 
 

This indicator is flippin great! You can even reduce the lookback period to 1 to see the values for every price pivot. Fab!

Responder ao comentário
Versão 1.1 2021.10.21
Added real time data update for current zigzag leg