• Visão global
  • Comentários
  • Discussão
  • O que há de novo

Renko Pro 5

Diagrama de tijolo - uma forma alternativa de negociação

Se você é um trader que está confuso com as velas em inúmeros gráficos, ou não sabe como desenhar linhas ou como desenhar linhas de suporte e resistência, você deve encontrar outro método de negociação que seja adequado para você neste momento. Assim como um driver pára para uma revisão completa depois de encontrar problemas repetidamente, o mesmo é válido para uma transação.

O gráfico de blocos fornece um método de negociação simples para traders intradiários. Na verdade, esse método tem a mesma história que a linha K e também se originou no Japão.

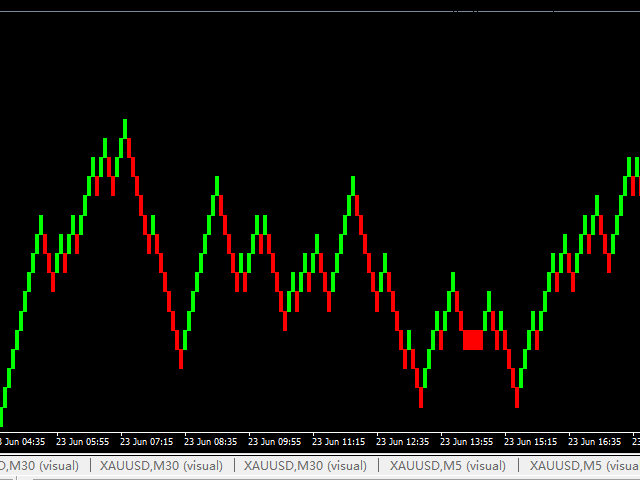
Para definir um gráfico de blocos, eles apenas descrevem a tendência de preço de um ponto de ajuste ou ponto de base. Por exemplo, um gráfico de bloco de 10 pontos pode representar apenas uma tendência de alta de 10 pontos ou uma tendência de queda de 10 pontos nas mudanças de preço.

O diagrama de tijolo tem uma vantagem única de que seu preço não está vinculado ao tempo, ou seja, somente quando a mudança de preço atinge o valor definido, um novo diagrama de tijolo aparecerá, e o diagrama de tijolo remove o Burr de preço, então parece muito confortável dos sentidos.


Produtos recomendados
Renko Plus
Eadvisors Software Inc.
Com o Renko Plus você consegue utilizar os recursos na funcionalidade Indicador, basta adicioná-lo ao gráfico do Metatrader5.             O gráfico Renko é um tipo de gráfico, desenvolvido pelos japoneses, que é construído usando o movimento de preços em vez de preços e intervalos de tempo padronizados, como a maioria dos gráficos. Acredita-se que tenha o nome da palavra japonesa para tijolos, "renga", já que o gráfico se parece com uma série de tijolos.             Um novo tijolo
A machine translation from the English product description was used. We apologize for possible imprecisions. Foi utilizada uma tradução automática da descrição do produto em inglês. Pedimos desculpas por possíveis imprecisões. Um sistema de visualização para padrões de ação de preço de velas favoritas. Uma vez anexado, o indicador marcará automaticamente os próximos padrões no gráfico: Barra Pinóquio  - uma barra de corpo pequeno com um 'nariz' longo, padrão reverso muito conhecido; Barra intern
Gino Renko
Stephane, Andr Valette
1 (1)
Another renko-based indicator. It returns different usable values ​​for an EA, and is directly displayed on the main chart. Its setting is very simple: The size of the renko The number of bars taken into account The falling color The color on the rise Returned values: Buffer 0 : Value of the middle Buffer 1 : Value of the Top Buffer 2 : Value of the Bottom Buffer 3 : Direction of renko (0.0 for top ; 1.0 for bottom) Buffer 4 : Ratio of the renko, for example, if it is twice, 3 times, ro more of
Renko Chart
Marcin Konieczny
4.08 (12)
This indicator allows to display Renko charts in the indicator window. Renko charts show only price movements that are bigger than the specified box size. It helps to eliminate noise and allows to focus on main trends. Time is not a factor here. Only price movements are taken into account. That's why Renko chart is not synchronized with the main chart it is attached to. Indicator works in two modes: CLOSE - only close prices are taken into account while building the chart HIGH_LOW - only high/
FREE
Owl Smart Levels MT5
Sergey Ermolov
4.39 (38)
Versão MT4  |  FAQ O Indicador Owl Smart Levels é um sistema de negociação completo dentro de um indicador que inclui ferramentas populares de análise de mercado, como fractais avançados de Bill Williams , Valable ZigZag que constrói a estrutura de onda correta do mercado e níveis de Fibonacci que marcam os níveis exatos de entrada no mercado e lugares para obter lucros. Descrição detalhada da estratégia Instruções para trabalhar com o indicador Consultor de negociação Owl Helper Chat privado d
Was: $249  Now: $99   Market Profile defines a number of day types that can help the trader to determine market behaviour. A key feature is the Value Area, representing the range of price action where 70% of trading took place. Understanding the Value Area can give traders valuable insight into market direction and establish the higher odds trade. It is an excellent addition to any system you may be using. Inspired by Jim Dalton’s book “Mind Over Markets”, this indicator is designed to suit the
Robust median Renko style indicator for creating custom charts resembling Median Renko, Mean Renko, Turbo Renko and Better Renko candles as well as vanilla Renko with wicks plus Point-O charts. This all in one package provides all of the signals needed by day traders, scalpers, and even long-term traders. Main characteristics The indicator is an overlay on the main chart so it is possible to utilize one-click trading and order manipulation directly on the custom charts. Visual order placement
KT ROC Divergence MT5
KEENBASE SOFTWARE SOLUTIONS
KT ROC divergence shows the regular and hidden divergences build between the price and Rate of change oscillator. Rate of change (ROC) is a pure momentum oscillator that calculates the change of percentage in price from one period to another. It compares the current price with the price "n" periods ago. ROC = [(Close - Close n periods ago) / (Close n periods ago)] * 100 There is an interesting phenomenon associated with ROC oscillator. In ROC territory there is no upward limit, but there is a do
SUPER SALE! --> BUY Trend Reader Indicator with -$180 OFF and GET a BONUS EA: News Scope EA PRO with AMAZING results! NOTE: Trend Reader Indicator PROMO price: $117 (The next price $297) - The offer ends soon! Click here to check News Scope EA PRO results and learn more about the promotion! Trend Reader Indicator is a revolutionary trading indicator designed to empower forex traders with the tools they need to make informed trading decisions. This cutting-edge indicator utilizes complex mathema
Big Player Range
Thalles Nascimento De Carvalho
5 (2)
Bem-vindo ao indicador "BigPlayerRange", uma ferramenta de análise técnica desenvolvida para identificar áreas de interesse significativo das instituições financeiras nos mercados. Este indicador oferece uma análise precisa das faixas de preço onde as grandes players do mercado demonstram considerável atividade e interesse. Principais Características: Mapeamento de Áreas de Interesse Institucional: O "BigPlayerRange" destaca com precisão as áreas do gráfico onde instituições financeiras demonstr
Market Imbalance MT5
Scott Edward Merritt
What Is Market Imbalance? Market Imbalance, also known as "IPA" or Improper Price Action, is when price moves so quick in one direction with no orders on the other side of the market to mitigate the price movement. We all know Big Banks, or "Smart Money", can move the market by placing huge orders which in turn can move price significantly. They can do this because Big Banks are the  top 10 Forex traders in the world . But unfortunately, the Big Banks cannot leave these orders in drawdown and mu
This indicator is the same as the popular Heiken Ashi Smoothed. The Heikin Ashi indicator for MetaTrader 5 already exists, but it has two disadvantages: It paints the candles not accurate. It's not possible to change the candle width. See also Heikin Ashi in MQL5 Code Base . In this version there are no such disadvantages.
Introduction to Smart Renko The main characteristics of Renko Charting concern price movement. To give you some idea on its working principle, Renko chart is constructed by placing a brick over or below when the price make the movement beyond a predefined range, called brick height. Therefore, naturally one can see clear price movement with less noise than other charting type. Renko charting can provide much clearer trend direction and it helps to identify important support and resistance level
Desenvolvido pela Smart Trader - Smart Reversion Pattern é um indicador capaz de identificar padrões de reversão , tanto reversões de alta quanto reversões de baixa. Ele foi desenhado para fornecer um rápido conhecimento dos padrões, em tempo real. Também pensamos na parte de interface, criando um visual limpo e agradável para identificar no gráfico os padrões de formação. Obs: Caso algum padrão que você precise não esteja listado, basta entrar em contato conosco e solicitar a inclusão - geralme
This indicator uses a mathematical calculation algorithm . This algorithm calculates the remainder between the updated model and the actual values and produces the possible progress of the graph on the graph. It is not a super prophet in trading, but it is very good for the trader when entering the market and to analyze it before entering. Applicable for all currencies. Данный индикатор использует алгоритм математических вычислений . Данный алгоритм вычисляет остаток между обновленной моделью и
Wapv Price and volume
Eduardo Da Costa Custodio Santos
O Indicador WAPV Price and Volume para MT5 faz parte do conjunto de ferramentas do (Wyckoff Academy Wave Market) e ( Wyckoff Academy Price and Volume). O Indicador WAPV Price and Volume para MT5 foi criado para facilitar a visualização da movimentação do volume  no gráfico de forma intuitiva. Com ele você pode observar os momentos de pico de volume e momentos em que o mercado não tem interesse profissional Identificar momentos que o Mercado esta se movimentando por inércia e não por movim
Uma das sequências numéricas é chamada de "Forest Fire Sequence". Foi reconhecida como uma das mais belas novas sequências. Sua principal característica é que essa sequência evita tendências lineares, mesmo as mais curtas. É esta propriedade que formou a base deste indicador. Ao analisar uma série temporal financeira, este indicador tenta rejeitar todas as opções de tendência possíveis. E somente se ele falhar, ele reconhece a presença de uma tendência e dá o sinal apropriado. Esta abordagem pe
Volume Bars
DARIO GALLIONE
An effective indicator that highlights candles with increasing volumes, overshadowing those with shrinking volumes. Also suitable for Forex because it uses tick_volume.  You can set the colors to your liking. It will be easier to spot trends and possible reversals. The increasing volumes indicate the presence of large investors and therefore determine the reliability of the candle under observation
Be notified of every color change of Heiken Ashi (HA) candles. The indicator will trigger past and new signals every time that HA candles change their colors. ( Note : this tool is based on the code of Heiken Ashi indicator developed by MetaQuotes Software Corp.) Features The signals are triggered at closing of last bar/opening of a new bar; Any kind of alerts can be enabled: Dialog Box, Email message, SMS notifications for smartphones and tablets, and Sound alerts; By default, up arrows are p
HLC bar MT5 Wyckoff
Eduardo Da Costa Custodio Santos
O indicador "HLC_bar_MT5 Wyckoff" para MT5 foi criado para facilitar a análise na hora da negociação. A Barra HLC foi utilizada por Richard Wyckoff e atualmente muito utilizada nas operações de "VSA". Wyckoff descobriu que a utilização da Máxima, mínima e fechamento deixava o gráfico muito mais limpo e fácil de ser analisado. O Indicador "HLC_bar_MT5 Wyckoff" permite: # Alterar a largura da barra; # Deixar a barra da mesma cor; # E destacar a barra que abriu e fechou no mesmo preço.
Description The indicator uses market profile theory to show the most relevant trading zones, on a daily basis. The zones to be shown are LVN (low volume nodes) and POC (point of control). An LVN zone is one which represents price areas with the least time or volume throughout the day. Typically, these areas indicate a supply or demand initiative, and in the future, they can turn into important breakout or retracement zones. A POC zone is one which represents price areas with the most time or vo
Your Trend Friend
Luigi Nunes Labigalini
5 (1)
A tendência é sua amiga! Veja a cor do indicador e faça suas operações nessa direção. Ele não repinta. Ou seja, depois que cada candle se fecha, a cor dele é definitiva e não irá se alterar. Você pode focar em movimentos mais curtos e rápidos ou tendências mais longas, basta testar o que melhor se encaixa no seu operacional de acordo com o ativo e tempo gráfico usado. Altere o parâmetro de entrada "Length" e o indicador irá se adaptar automaticamente (quanto maior ele for, maior a tendência a
VolumeDeltaBars
Stanislav Korotky
This indicator is a conventional analytical tool for tick volumes changes. It calculates tick volumes for buys and sells separately, and their delta on every bar, and displays volumes by price clusters (cells) within a specified bar (usually the latest one). The algorithm used internally is the same as in the indicator VolumeDeltaMT5 , but results are shown as cumulative volume delta bars (candlesticks). Analogous indicator for MetaTrader 4 exists - CumulativeDeltaBars . This is a limited substi
Mini Chart Indicators
Flavio Javier Jarabeck
The Metatrader 5 has a hidden jewel called Chart Object, mostly unknown to the common users and hidden in a sub-menu within the platform. Called Mini Chart, this object is a miniature instance of a big/normal chart that could be added/attached to any normal chart, this way the Mini Chart will be bound to the main Chart in a very minimalist way saving a precious amount of real state on your screen. If you don't know the Mini Chart, give it a try - see the video and screenshots below. This is a gr
HMA Trend Professional MT5
Pavel Zamoshnikov
4.5 (6)
Improved version of the free HMA Trend indicator (for MetaTrader 4) with statistical analysis. HMA Trend is a trend indicator based on the Hull Moving Average (HMA) with two periods. HMA with a slow period identifies the trend, while HMA with a fast period determines the short-term movements and signals in the trend direction. The main differences from the free version: Ability to predict the probability of a trend reversal using analysis of history data. Plotting statistical charts for analyz
No Demand No Supply MT5
Trade The Volume Waves Single Member P.C.
No Demand No Supply   This indicator identifies   No Demand –No Supply candles to your chart and plots volume bars colored according to the signal. It can be applied to all timeframes or to a specific one only. It can also be used as regular volume indicator  with exceptional future of WEIGHTED VOLUME. Furthermore is has an alert notification, sound and email when a signals occurs. The indicator does not repaint but the alert will come on two candles back due to the definition of No Demand No Su
RENKO PRICE ACTION ATR é um "Expert Advisor" desenvolvido através da construção do Gráfico Renko aonde cada BRICK tem o tamanho calculado através do ATR do período selecionado pelo usuário. Os gráficos Renko são projetados para filtrar movimentos menores de preços, desta forma tornando mais fácil que os traders concentrem-se em tendências importantes. Devido à sua eficiência em detecção de tendências de preços é possível também identificar com muita clareza suportes e resistências assim como as
RenkoFromRealTicks DEMO
Stanislav Korotky
1 (1)
This non-trading expert utilizes so called   custom symbols   feature to build renko charts based on history of real ticks of selected standard symbol. RenkoFromRealTicks generates custom symbol quotes, thus you may open many charts to apply different EAs and indicators to the renko. It also transmits real ticks to update renko charts in real time. This is a functionally limited demo version of  RenkoFromRealTicks . RenkoFromRealTicks utility can not work in the tester because it uses CustomSym
FREE
The Accumulation / Distribution is an indicator which was essentially designed to measure underlying supply and demand. It accomplishes this by trying to determine whether traders are actually accumulating (buying) or distributing (selling). This indicator should be more accurate than other default MT5 AD indicator for measuring buy/sell pressure by volume, identifying trend change through divergence and calculating Accumulation/Distribution (A/D) level. Application: - Buy/sell pressure: above
Esta é a versão customizada da Gekko para o famoso indicaor Heiken Ashi. Ele amplia o uso das famosas barras de Heiken Ashi e calcula sinais fortes de entrada e saída. Parâmetros de Entrada Number of Bars to Plot Indicator:  número de barras históricas para plotar o indicador, mantenha  baixo para melhor desempenho; Produce Arrow Signals:  escolha se o indicador irá produzir sinais de seta para compras e vendas; Produces Signal Only When a Bar Closes:  coloque true para esperar pelo fechamento d
Os compradores deste produto também adquirem
Atomic Analyst MT5
Issam Kassas
5 (15)
Primeiramente, vale ressaltar que este Indicador de Negociação não repinta, não redesenha e não apresenta atrasos, tornando-o ideal tanto para negociação manual quanto automatizada. Manual do utilizador: configurações, entradas e estratégia. O Analista Atômico é um Indicador de Ação de Preço PA que utiliza a força e o momentum do preço para encontrar uma vantagem melhor no mercado. Equipado com filtros avançados que ajudam a remover ruídos e sinais falsos, e aumentam o potencial de negociação.
Primeiramente, vale ressaltar que este Sistema de Trading é um Indicador Não Repintado, Não Redesenho e Não Atrasado, o que o torna ideal tanto para o trading manual quanto para o automatizado. Curso online, manual e download de predefinições. O "Sistema de Trading Inteligente MT5" é uma solução completa de trading projetada para traders novos e experientes. Ele combina mais de 10 indicadores premium e apresenta mais de 7 estratégias de trading robustas, tornando-o uma escolha versátil para dive
Quantum Trend Sniper
Bogdan Ion Puscasu
5 (46)
Apresentando       Quantum Trend Sniper Indicator   , o inovador Indicador MQL5 que está transformando a maneira como você identifica e negocia as reversões de tendência! Desenvolvido por uma equipe de traders experientes com experiência comercial de mais de 13 anos,       Indicador de Atirador de Tendência Quântica       foi projetado para impulsionar sua jornada de negociação a novos patamares com sua forma inovadora de identificar reversões de tendência com precisão extremamente alta. ***C
Gold Stuff mt5
Vasiliy Strukov
4.9 (181)
Gold Stuff mt5-um indicador de tendência projetado especificamente para o ouro, também pode ser usado em qualquer instrumento financeiro. O indicador não é redesenhado ou atrasado. O timeframe recomendado é H1. Importante! Entre em contato comigo imediatamente após a compra para obter instruções e bônus!  Você pode obter uma cópia gratuita do nosso indicador Strong Support e Trend Scanner, envie uma mensagem privada. a mim! PARÂMETRO Draw Arrow-incl.desligado. desenhar setas no gráfico. A
AT Forex Indicator MT5
Marzena Maria Szmit
5 (3)
The AT Forex Indicator MT5 is a sophisticated trading tool designed to provide traders with a comprehensive analysis of multiple currency pairs. This powerful indicator simplifies the complex nature of the forex market, making it accessible for both novice and experienced traders. AT Forex Indicator uses advanced algorithms to detect trends, patterns and is an essential tool for traders aiming to enhance their forex trading performance. With its robust features, ease of use, and reliable signal
Este é um indicador para MT5 que fornece sinais precisos para entrar em uma negociação sem redesenhar. Ele pode ser aplicado a qualquer ativo financeiro: forex, criptomoedas, metais, ações, índices. Ele fornecerá estimativas bastante precisas e informará quando é melhor abrir e fechar um negócio. Assista o vídeo (6:22) com um exemplo de processamento de apenas um sinal que compensou o indicador! A maioria dos traders melhora seus resultados de negociação durante a primeira semana de negociação c
Reversal First Impulse levels (RFI)      INSTRUCTIONS        RUS       -       ENG              R ecommended to use with an indicator   -   TPSpro  TREND PRO -  Version MT4                 A key element in trading is zones or levels from which decisions to buy or sell a trading instrument are made. Despite attempts by major players to conceal their presence in the market, they inevitably leave traces. Our task was to learn how to identify these traces and interpret them correctly. Main functi
Antes de tudo, vale ressaltar que esta Ferramenta de Negociação é um Indicador Não Repintante, Não Redesenhante e Não Atrasado, o que a torna ideal para negociação profissional. Curso online, manual do utilizador e demonstração. O Indicador de Conceitos de Ação de Preço Inteligente é uma ferramenta muito poderosa tanto para traders novos quanto experientes. Ele combina mais de 20 indicadores úteis em um único, combinando ideias avançadas de negociação como Análise do Trader do Círculo Intern
Trend Screener Pro MT5
STE S.S.COMPANY
4.88 (66)
Desbloqueie o poder da negociação de tendências com o indicador Trend Screener: sua solução definitiva de negociação de tendências, alimentada por lógica difusa e sistema de múltiplas moedas! Eleve sua negociação de tendências com o Trend Screener, o revolucionário indicador de tendências alimentado por lógica difusa. É um poderoso indicador de acompanhamento de tendências que combina mais de 13 ferramentas e recursos premium e 3 estratégias de negociação, tornando-o uma escolha versátil para to
TPA True Price Action indicator reveals the true price action of the market makers through 100% non-repainting signals strictly at the close of a candle! TPA shows entries and re-entries, every time the bulls are definitely stronger than the bears and vice versa. Not to confuse with red/green candles. The shift of power gets confirmed at the earliest stage and is ONE exit strategy of several. There are available now two free parts of the TPA User Guide for our customers. The first "The Basics"
FX Power MT5 NG
Daniel Stein
5 (5)
Receba a sua atualização diária do mercado com detalhes e screenshots através do nosso Morning Briefing aqui no mql5 e no Telegram ! O FX Power MT5 NG é a próxima geração do nosso medidor de força de moeda muito popular de longa data, o FX Power. E o que é que este medidor de força da próxima geração oferece? Tudo o que adorou no FX Power original MAIS Análise de força GOLD/XAU Resultados de cálculo ainda mais precisos Períodos de análise configuráveis individualmente Limite de cálculo personal
TPSproTREND PrO MT5
Roman Podpora
4.88 (8)
TPSpro TRENDPRO  - is a trend indicator that automatically analyzes the market and provides information about the trend and each of its changes, as well as giving signals for entering trades without redrawing! The indicator uses each candle, analyzing them separately. referring to different impulses - up or down impulse. Exact entry points into transactions for currencies, crypto, metals, stocks, indices!  -  Version MT4               DETAILED DESCRIPTION               R ecommended to use with
ICT, SMC, SMART MONEY CONCEPTS, SMART MONEY, Smart Money Concept, Support and Resistance, Trend Analysis, Price Action, Market Structure, Order Blocks, BOS/CHoCH,   Breaker Blocks ,  Momentum Shift,   Supply&Demand Zone/Order Blocks , Strong Imbalance,   HH/LL/HL/LH,    Fair Value Gap, FVG,  Premium  &   Discount   Zones, Fibonacci Retracement, OTE, Buy Side Liquidity, Sell Side Liquidity, BSL/SSL Taken, Equal Highs & Lows, MTF Dashboard, Multiple Time Frame, BigBar, HTF OB, HTF Market Structure
FX Volume MT5
Daniel Stein
4.94 (17)
Receba a sua atualização diária do mercado com detalhes e screenshots através do nosso Morning Briefing aqui no mql5 e no Telegram ! O Volume FX é o PRIMEIRO e ÚNICO indicador de volume que fornece uma visão REAL do sentimento do mercado do ponto de vista de um corretor. Ele fornece uma visão incrível de como os participantes do mercado institucional, como corretores, estão posicionados no mercado Forex, muito mais rápido do que os relatórios COT. Ver essas informações diretamente no seu gráfi
Torne-se um Negociador Breaker e lucre com as mudanças na estrutura do mercado à medida que o preço reverte. O indicador de quebra de bloco de pedidos identifica quando uma tendência ou movimento de preço está chegando à exaustão e pronto para reverter. Ele o alerta sobre mudanças na estrutura do mercado, que normalmente ocorrem quando uma reversão ou uma grande retração está prestes a ocorrer. O indicador usa um cálculo proprietário que identifica rupturas e momento do preço. Toda vez que
Matrix Arrow Indicator MT5
Juvenille Emperor Limited
5 (14)
O   Matrix Arrow Indicator MT5   é uma tendência única 10 em 1 seguindo um indicador multi-timeframe   100% sem repintura   que pode ser usado em todos os símbolos/instrumentos:   forex ,   commodities ,   criptomoedas ,   índices ,   ações .  O  Matrix Arrow Indicator MT5  determinará a tendência atual em seus estágios iniciais, reunindo informações e dados de até 10 indicadores padrão, que são: Índice de movimento direcional médio (ADX) Índice de canal de commodities (CCI) Velas clássicas de
XQ Indicator MetaTrader 5
Marzena Maria Szmit
5 (1)
Step into the realm of Forex trading with confidence and precision using XQ, a cutting-edge Forex indicator designed to elevate your trading game to unprecedented heights. Whether you're a seasoned trader or just stepping into the world of currency exchange, XQ Forex Indicator empowers you with the insights and signals needed to make informed trading decisions. The signal conditions are a combination of three indicators, and XQ Forex Indicator only display  medium and long-term trends . The ind
RelicusRoad Pro MT5
Relicus LLC
4.83 (23)
Agora US $ 147 (aumentando para US $ 499 após algumas atualizações) - Contas ilimitadas (PCs ou Macs) Manual do usuário do RelicusRoad + vídeos de treinamento + acesso ao grupo de discórdia privado + status VIP UMA NOVA FORMA DE OLHAR PARA O MERCADO O RelicusRoad é o indicador de negociação mais poderoso do mundo para forex, futuros, criptomoedas, ações e índices, oferecendo aos traders todas as informações e ferramentas necessárias para se manterem rentáveis. Fornecemos análises técnica
Auto Order Block with break of structure based on ICT and Smart Money Concepts (SMC) Futures Break of Structure ( BoS )             Order block ( OB )            Higher time frame Order block / Point of Interest ( POI )    shown on current chart           Fair value Gap ( FVG ) / Imbalance   -  MTF      ( Multi Time Frame )    HH/LL/HL/LH  -  MTF      ( Multi Time Frame )  Choch  MTF      ( Multi Time Frame )  Volume Imbalance     ,  MTF          vIMB Gap’s Power of 3 Equal High
Advanced Supply Demand MT5
Bernhard Schweigert
4.53 (15)
Atualmente com 33% de desconto! A melhor solução para qualquer Trader Novato ou especialista! Este indicador é uma ferramenta de negociação exclusiva, de alta qualidade e acessível porque incorporamos uma série de recursos proprietários e uma nova fórmula. Com esta atualização, você poderá mostrar fusos horários duplos. Você não só será capaz de mostrar um TF mais alto, mas também mostrar ambos, o TF do gráfico, MAIS o TF mais alto: MOSTRANDO ZONAS ANINHADAS. Todos os traders de Oferta e Demanda
Blahtech Supply Demand MT5
Blahtech Limited
4.54 (13)
Was: $299  Now: $99   Supply Demand uses previous price action to identify potential imbalances between buyers and sellers. The key is to identify the better odds zones, not just the untouched ones. Blahtech Supply Demand indicator delivers functionality previously unavailable on any trading platform. This 4-in-1 indicator not only highlights the higher probability zones using a multi-criteria strength engine, but also combines it with multi-timeframe trend analysis, previously confirmed swings
Bill Williams Advanced
Siarhei Vashchylka
5 (7)
Bill Williams Advanced is designed for automatic chart analysis using Bill Williams' "Profitunity" system. The indicator analyzes four timeframes at once. Manual (Be sure to read before purchasing) Advantages 1. Automatically analyzes the chart using the "Profitunity" system of Bill Williams. The found signals are placed in a table in the corner of the screen. 2. Equipped with a trend filter based on the Alligator indicator. Most of the system signals are recommended to be used only accordi
Dark Absolute Trend   is an Indicator for intraday trading. This Indicator is based on   Trend Following  strategy but use also candlestick patterns and Volatility. We can enter in good price with this Indicator, in order to follow the main trend on the current instrument. It is advised to use low spread ECN brokers. This Indicator does   Not repaint   and   N ot lag . Recommended timeframes are M5, M15 and H1. Recommended working pairs: All. I nstallation and  Update Guide   -  Troubleshooting
Este painel mostra os últimos   padrões harmónicos   disponíveis para os símbolos seleccionados, pelo que poupará tempo e será mais eficiente /   versão MT4 . Indicador gratuito:   Basic Harmonic Pattern Colunas do indicador Symbol :   aparecem os símbolos seleccionados Trend :   de alta ou de baixa Pattern :   tipo de padrão (gartley, borboleta, morcego, caranguejo, tubarão, cifra ou ABCD) Entry :   preço de entrada SL:   preço de paragem de perda TP1:   preço do 1º take profit TP2:   preç
Easy By Sell is a market indicator for opening and closing positions. It becomes easy to track market entries with alerts. It indicates trend reversal points when a price reaches extreme values ​​and the most favorable time to enter the market. it is as effective as a Fibonacci to find a level but it uses different tools such as an algorithm based on ATR indicators and Stochastic Oscillator. You can modify these two parameters as you wish to adapt the settings to the desired period. My othe
IX Power MT5
Daniel Stein
5 (3)
O   IX Power   traz finalmente a precisão imbatível do FX Power para símbolos não-Forex. Determina com exatidão a intensidade das tendências a curto, médio e longo prazo nos seus índices, acções, mercadorias, ETFs e até criptomoedas favoritos. Pode   analisar tudo o que   o seu terminal tem para oferecer. Experimente e veja como   o seu timing melhora significativamente   quando negoceia. Características principais do IX Power Resultados de cálculo 100% precisos e sem repintura - para tod
Apresentando       Quantum Breakout PRO   , o inovador Indicador MQL5 que está transformando a maneira como você negocia Breakout Zones! Desenvolvido por uma equipe de traders experientes com experiência comercial de mais de 13 anos,       Quantum Breakout PRO       foi projetado para impulsionar sua jornada comercial a novos patamares com sua estratégia de zona de fuga inovadora e dinâmica. O Quantum Breakout Indicator lhe dará setas de sinal em zonas de breakout com 5 zonas-alvo de lucro e
The Volume by Price Indicator for MetaTrader 5 features Volume Profile and Market Profile TPO (Time Price Opportunity). Volume and TPO histogram bar and line charts. Volume Footprint charts. TPO letter and block marker collapsed and split structure charts. Session filtering and grouping. Static, dynamic and flexible range segmentation and compositing methods with relative and absolute visualizations. Graphical layering, positioning and styling options to suit the user's analytic and aesthetic n
AW Trend Predictor MT5
AW Trading Software Limited
4.78 (58)
A combinação de níveis de tendência e quebra em um sistema. Um algoritmo de indicador avançado filtra o ruído do mercado, determina a tendência, os pontos de entrada e os possíveis níveis de saída. Os sinais indicadores são registrados em um módulo estatístico, que permite selecionar as ferramentas mais adequadas, mostrando a eficácia do histórico do sinal. O indicador calcula as marcas Take Profit e Stop Loss. Manual e instruções ->   AQUI   / versão MT4 ->   AQUI Como negociar com o indicador
Gartley Hunter Multi
Siarhei Vashchylka
5 (7)
Gartley Hunter Multi - An indicator for searching for harmonic patterns simultaneously on dozens of trading instruments and on all possible timeframes. Manual (Be sure to read before purchasing) | Version for MT4 Advantages 1. Patterns: Gartley, Butterfly, Shark, Crab. Bat, Alternate Bat, Deep Crab, Cypher 2. Simultaneous search for patterns on dozens of trading instruments and on all possible timeframes 3. Search for patterns of all possible sizes. From the smallest to the largest 4. A
Mais do autor
[跟单系统] T he most friendly Copier interactive interface, the most abundant easy-to-use functions, and the best Copy solution.    EASY   : Easy to use, load and select the Master or SLAVE to use easily FAST:   Quickly copy orders, algorithmic optimal follow-up mechanism, priority calculation of new signals, priority queue processing received special signals Multiple:   1. Support multiple signals to be sent at the same time, multiple accounts can select multiple accounts to copy at the same time 2
[跟单系统] T he most friendly Copier interactive interface, the most abundant easy-to-use functions, and the best Copy solution.    EASY   : Easy to use, load and select the Master or SLAVE to use easily  FAST:   Quickly copy orders, algorithmic optimal follow-up mechanism, priority calculation of new signals, priority queue processing received special signals Multiple:   1. Support multiple signals to be sent at the same time, multiple accounts can select multiple accounts to copy at the same time
KDJ Index 4   交易实用必备工具指标 波浪自动计算指标,通道趋势交易 完美的趋势-波浪自动计算通道计算 , MT4版本 完美的趋势-波浪自动计算通道计算 , MT5版本 本地跟单复制交易 Easy And Fast Copy , MT4版本 Easy And Fast Copy , MT5版本 本地跟单复制交易 模拟试用 Easy And Fast Copy , MT4 模拟账号运行 Easy And Fast Copy , MT5 模拟账号运行 "Cooperative QQ:556024  "  "Cooperation wechat:556024"  "Cooperative email:556024@qq.com" 强烈推荐趋势指标, 波浪的标准自动计算   和   波浪的标准自动计算MT5版本     KDJ指标又叫 随机指标 ,是一种相当新颖、实用的技术分析指标,它起先用于期货市场的分析,后被广泛用于股市的中短期趋势分析,是期货和股票市场上最常用的技术分析工具。 随机指标KDJ一般是用于股票分析的统计体系,根据统计学原理,通过一个特定的周期(常为9日、9周等
Necessary for traders: tools and indicators Waves automatically calculate indicators, channel trend trading Perfect trend-wave automatic calculation channel calculation , MT4 Perfect trend-wave automatic calculation channel calculation , MT5 Local Trading copying Easy And Fast Copy , MT4 Easy And Fast Copy , MT5 Local Trading copying For DEMO Easy And Fast Copy , MT4 DEMO Easy And Fast Copy , MT5 DEMO 砖图 Renko PRO->>>   The display of the brick map on the main map. The Renko chart ideal
FREE
Negociação dinâmica: 1.pp pivot 2. r1 r2 r3, s1 s2 s3 Necessary for traders: tools and indicators Waves automatically calculate indicators, channel trend trading Perfect trend-wave automatic calculation channel calculation , MT4 Perfect trend-wave automatic calculation channel calculation , MT5 Local Trading copying Easy And Fast Copy , MT4 Easy And Fast Copy , MT5 Local Trading copying For DEMO Easy And Fast Copy , MT4 DEMO Easy And Fast Copy , MT5 DEMO Cooperação QQ: 556024 " Coop
FREE
O       melhor parceiro para os comerciantes!       Assistente de negociação: Este é um auxílio comercial muito rico em recursos. O desenvolvimento não é fácil, por favor, apoie o Pro Clique para pular K Trade Assistant Pro MT5 Instruções de Operação do Assistente de Negociação Configurações básicas de uso Básico: Interruptor de seleção de idioma de suporte (atualmente suporta chinês e inglês)           reconhecimento automático de idioma Apoiar a ligação de       tecla de atalh
FREE
Fit Channel MT5
Kaijun Wang
3.67 (3)
The market price usually falls between the borders of the channel    .   If the price is out of range , it is a trading signal or trading opportunity  . Basically , Fit Channel can be used to help determine overbought and oversold conditions in the market. When the market price is close to the upper limit, the market is considered overbought (sell zone). Conversely, when the market price is close to the bottom range, the market is considered oversold (buy zone). However, the research can
Necessary for traders: tools and indicators Waves automatically calculate indicators, channel trend trading Perfect trend-wave automatic calculation channel calculation , MT4 Perfect trend-wave automatic calculation channel calculation , MT5 Local Trading copying Easy And Fast Copy , MT4 Easy And Fast Copy , MT5 Local Trading copying For DEMO Easy And Fast Copy , MT4 DEMO Easy And Fast Copy , MT5 DEMO O MACD é chamado de Convergência e Divergência de Média Móvel, que é desenvolvido a partir da
FREE
Necessary for traders: tools and indicators Waves automatically calculate indicators, channel trend trading Perfect trend-wave automatic calculation channel calculation , MT4 Perfect trend-wave automatic calculation channel calculation , MT5 Local Trading copying Easy And Fast Copy , MT4 Easy And Fast Copy , MT5 Local Trading copying For DEMO Easy And Fast Copy , MT4 DEMO Easy And Fast Copy , MT5 DEMO Bandas de Bollinger Avançadas: 1. O trilho Bollinger mudará de cor com a direção " 2. A ex
FREE
Pivot Trading 4
Kaijun Wang
5 (17)
Negociação dinâmica: 1.pp pivot 2. r1 r2 r3, s1 s2 s3 Necessary for traders: tools and indicators Waves automatically calculate indicators, channel trend trading Perfect trend-wave automatic calculation channel calculation , MT4 Perfect trend-wave automatic calculation channel calculation , MT5 Local Trading copying Easy And Fast Copy , MT4 Easy And Fast Copy , MT5 Local Trading copying For DEMO Easy And Fast Copy , MT4 DEMO Easy And Fast Copy , MT5 DEMO Recomendamos fortemente indicadore
FREE
MACD divergence signals   MACD is called Convergence and Divergence Moving Average, which is developed from the double exponential moving average. The fast exponential moving average (EMA12) is subtracted from the slow exponential moving average (EMA26) to get the fast DIF, and then 2× (Express DIF-DIF's 9-day weighted moving average DEA) Get the MACD bar. The meaning of MACD is basically the same as the double moving average, that is, the dispersion and aggregation of the fast and slow moving a
Necessary for traders: tools and indicators Waves automatically calculate indicators, channel trend trading Perfect trend-wave automatic calculation channel calculation , MT4 Perfect trend-wave automatic calculation channel calculation , MT5 Local Trading copying Easy And Fast Copy , MT4 Easy And Fast Copy , MT5 Local Trading copying For DEMO Easy And Fast Copy , MT4 DEMO Easy And Fast Copy , MT5 DEMO 砖图Renko PRO->>> The display of the brick map on the main map. The Renko chart ideally remo
FREE
K Trade Assistant
Kaijun Wang
4.76 (25)
O melhor parceiro para traders!     Assistente de negociação: Este é um auxílio comercial muito rico em recursos. O desenvolvimento não é fácil, por favor, apoie o Pro Clique para pular K Trade Assistant Pro     Instruções de Operação do Assistente de Negociação Configurações básicas de uso Básico: Interruptor de seleção de idioma de suporte (atualmente suporta chinês e inglês)       para identificar automaticamente o idioma Apoiar a ligação de       tecla de atal
FREE
KDJ Index For MT5
Kaijun Wang
4.29 (14)
Necessary for traders: tools and indicators Waves automatically calculate indicators, channel trend trading Perfect trend-wave automatic calculation channel calculation , MT4 Perfect trend-wave automatic calculation channel calculation , MT5 Local Trading copying Easy And Fast Copy , MT4 Easy And Fast Copy , MT5 Local Trading copying For DEMO Easy And Fast Copy , MT4 DEMO Easy And Fast Copy , MT5 DEMO "Cooperative QQ:556024"  "Cooperation wechat:556024"  "Cooperative email:556024@qq.com" Strong
FREE
Os indicadores são para seguidores de tendências! Um sistema de negociação construído por três médias móveis. Opere de acordo com a tendência e deixe os lucros correrem. Necessary for traders: tools and indicators Waves automatically calculate indicators, channel trend trading Perfect trend-wave automatic calculation channel calculation , MT4 Perfect trend-wave automatic calculation channel calculation , MT5 Local Trading copying Easy And Fast Copy , MT4 Easy And Fast Copy , MT5 Local Trading
FREE
Necessary for traders: tools and indicators Waves automatically calculate indicators, channel trend trading Perfect trend-wave automatic calculation channel calculation , MT4 Perfect trend-wave automatic calculation channel calculation , MT5 Local Trading copying Easy And Fast Copy , MT4 Easy And Fast Copy , MT5 Local Trading copying For DEMO Easy And Fast Copy , MT4 DEMO Easy And Fast Copy , MT5 DEMO Bandas de Bollinger Avançadas: 1. O trilho Bollinger mudará de cor com a direção " 2. A ex
FREE
KDJ Index 4
Kaijun Wang
5 (11)
Necessary for traders: tools and indicators Waves automatically calculate indicators, channel trend trading Perfect trend-wave automatic calculation channel calculation , MT4 Perfect trend-wave automatic calculation channel calculation , MT5 Local Trading copying Easy And Fast Copy , MT4 Easy And Fast Copy , MT5 Local Trading copying For DEMO Easy And Fast Copy , MT4 DEMO Easy And Fast Copy , MT5 DEMO "QQ cooperativa: 556024"  "Cooperação wechat: 556024"  "Cooperative email: 556024@qq.com" Reco
FREE
KTrade Fibo For MT5
Kaijun Wang
4.9 (10)
Necessary for traders: tools and indicators Waves automatically calculate indicators, channel trend trading Perfect trend-wave automatic calculation channel calculation , MT4 Perfect trend-wave automatic calculation channel calculation , MT5 Local Trading copying Easy And Fast Copy , MT4 Easy And Fast Copy , MT5 Local Trading copying For DEMO Easy And Fast Copy , MT4 DEMO Easy And Fast Copy , MT5 DEMO Fibo: from KTrade 1. Automatically calculate and analyze the band. -> Get the desired band 2.
FREE
Os indicadores são para seguidores de tendências! Um sistema de negociação construído por três médias móveis. Opere de acordo com a tendência e deixe os lucros correrem. Necessary for traders: tools and indicators Waves automatically calculate indicators, channel trend trading Perfect trend-wave automatic calculation channel calculation , MT4 Perfect trend-wave automatic calculation channel calculation , MT5 Local Trading copying Easy And Fast Copy , MT4 Easy And Fast Copy , MT5 Local Trading
FREE
Necessary for traders: tools and indicators Waves automatically calculate indicators, channel trend trading Perfect trend-wave automatic calculation channel calculation , MT4 Perfect trend-wave automatic calculation channel calculation , MT5 Local Trading copying Easy And Fast Copy , MT4 Easy And Fast Copy , MT5 Local Trading copying For DEMO Easy And Fast Copy , MT4 DEMO Easy And Fast Copy , MT5 DEMO The homeopathic indicator is also called the CCI indicator. The CCI indicator was propos
FREE
XM Channel
Kaijun Wang
4.67 (3)
The market price usually falls between the borders of the channel . If the price is out of range, it is a trading signal or trading opportunity . Basically, Fit Channel can be used to help determine overbought and oversold conditions in the market. When the market price is close to the upper limit, the market is considered overbought (sell zone). Conversely, when the market price is close to the bottom range, the market is considered oversold (buy zone). However, the research can be used
XM Channel MT5
Kaijun Wang
5 (1)
The market price usually falls between the borders of the channel  . If the price is out of range, it is a trading signal or trading opportunity. Basically, Fit Channel can be used to help determine overbought and oversold conditions in the market. When the market price is close to the upper limit, the market is considered overbought (sell zone). Conversely, when the market price is close to the bottom range, the market is considered oversold (buy zone). However, the research can be used
Necessary for traders: tools and indicators Waves automatically calculate indicators, channel trend trading Perfect trend-wave automatic calculation channel calculation , MT4 Perfect trend-wave automatic calculation channel calculation , MT5 Local Trading copying Easy And Fast Copy , MT4 Easy And Fast Copy , MT5 Local Trading copying For DEMO Easy And Fast Copy , MT4 DEMO Easy And Fast Copy , MT5 DEMO Can set the cycle for other varieties of K line graph covered this window, fluctuations obse
FREE
Donchian通道(唐奇安通道指标)是用于交易突破的最古老、最简单的技术指标之一。   一般来说,唐奇安通道的宽度越宽,市场波动就越大,而唐奇安通道越窄,市场波动性也就越小 。此外,价格走势可以穿过布林带,但你看不到唐奇安通道的这种特征,因为其波段正在测量特定时期的最高价和最低价。 交易实用必备工具指标 波浪自动计算指标,通道趋势交易 完美的趋势-波浪自动计算通道计算 , MT4版本 完美的趋势-波浪自动计算通道计算 , MT5版本 本地跟单复制交易 Easy And Fast Copy , MT4版本 Easy And Fast Copy , MT5版本 本地跟单复制交易 模拟试用 Easy And Fast Copy , MT4 模拟账号运行 Easy And Fast Copy , MT5 模拟账号运行 唐奇安通道指标计算: 唐奇安上阻力线 - 由过去N天的当日最高价的最大值形成。 唐奇安下支撑线 - 由过去N天的当日最低价的最小值形成。 中心线 - (上线 + 下线)/ 2   唐奇安通道信号   唐奇安通道常用作突破指标。它提供了两种主要类型的突破信号,一个是上阻力线或下支
FREE
KTrade Fibo
Kaijun Wang
4.89 (9)
Necessary for traders: tools and indicators Waves automatically calculate indicators, channel trend trading Perfect trend-wave automatic calculation channel calculation , MT4 Perfect trend-wave automatic calculation channel calculation , MT5 Local Trading copying Easy And Fast Copy , MT4 Easy And Fast Copy , MT5 Local Trading copying For DEMO Easy And Fast Copy , MT4 DEMO Easy And Fast Copy , MT5 DEMO Fibo: from KTrade 1. Automatically calculate and analyze the band. -> Get the desired band 2.
FREE
Fit Channel
Kaijun Wang
5 (5)
The market price usually falls between the borders of the channel. If the price is out of range, it is a trading signal or trading opportunity. Basically, Fit Channel can be used to help determine overbought and oversold conditions in the market. When the market price is close to the upper limit, the market is considered overbought (sell zone). Conversely, when the market price is close to the bottom range, the market is considered oversold (buy zone). However, the research can be used to
九转序列,源自于TD序列,是因TD序列的9天收盘价研判标准而得名。 汤姆·德马克(Tom DeMark)技术分析界的着名大师级人物,创建了以其名字首字母命名的TD系列的很多指标,价格反转的这个指标就是其中重要的一个,即TD序列。 德马克原版TD序列指标要复杂一些,想研究就自行看关于德马克的资料吧。 这里只说简单的TD序列(九转序列)。 九转序列分为两种结构,低九买入结构和高九卖出结构。 TD高九卖出结构:连续出现的九根K线,这些K线的收盘价都比各自前面的第四根K线的收盘价高,如果满足条件,就在各K线上方标记相应的数字,最后1根就标记为9,如果条件不满足,则K线计数中断,原计数作废重新来数K线。如出现高9,则股价大概率会出现转折。 TD低九买入结构:连续出现的九根K线,这些K线的收盘价都比各自前面的第四根K线的收盘价低,如果满足条件,就在各K线下方标记相应的数字,最后1根就标记为9,如果条件不满足,则K线计数中断,原计数作废重新来数K线。如出现低9,则股价大概率会出现转折。 结构的本质是时间和空间的组合,时间是横轴,空间是纵轴,不同的时间周期和空间大小的组合,形成不同的结构形态,不同
九转序列,源自于TD序列,是因TD序列的9天收盘价研判标准而得名。 汤姆·德马克(Tom DeMark)技术分析界的着名大师级人物,创建了以其名字首字母命名的TD系列的很多指标,价格反转的这个指标就是其中重要的一个,即TD序列。 德马克原版TD序列指标要复杂一些,想研究就自行看关于德马克的资料吧。这里只说简单的TD序列(九转序列)。 九转序列分为两种结构,低九买入结构和高九卖出结构。 TD高九卖出结构:连续出现的九根K线,这些K线的收盘价都比各自前面的第四根K线的收盘价高, 如果满足条件,就在各K线上方标记相应的数字,最后1根就标记为9,如果条件不满足,则K线计数中断,原计数作废重新来数K线。如出现高9,则股价大概率会出现转折。 TD低九买入结构:连续出现的九根K线,这些K线的收盘价都比各自前面的第四根K线的收盘价低,如果满足条件,就在各K线下方标记相应的数字,最后1根就标记为9,如果条件不满足,则K线计数中断,原计数作废重新来数K线。如出现低9,则股价大概率会出现转折。 结构的本质是时间和空间的组合,时间是横轴,空间是纵轴,不同的时间周期和空间大小的组合,形成不同的结构形态,不同
Necessary for traders: tools and indicators Waves automatically calculate indicators, channel trend trading Perfect trend-wave automatic calculation channel calculation , MT4 Perfect trend-wave automatic calculation channel calculation , MT5 Local Trading copying Easy And Fast Copy , MT4 Easy And Fast Copy , MT5 Local Trading copying For DEMO Easy And Fast Copy , MT4 DEMO Easy And Fast Copy , MT5 DEMO MACD is called Convergence and Divergence Moving Average, which is developed from the double e
FREE
Donchian通道(唐奇安通道指标)是用于交易突破的最古老、最简单的技术指标之一。 一般来说,唐奇安通道的宽度越宽,市场波动就越大,而唐奇安通道越窄,市场波动性也就越小 。此外,价格走势可以穿过布林带,但你看不到唐奇安通道的这种特征,因为其波段正在测量特定时期的最高价和最低价。 交易实用必备工具指标 波浪自动计算指标,通道趋势交易 完美的趋势-波浪自动计算通道计算 , MT4版本 完美的趋势-波浪自动计算通道计算 , MT5版本 本地跟单复制交易 Easy And Fast Copy , MT4版本 Easy And Fast Copy , MT5版本 本地跟单复制交易 模拟试用 Easy And Fast Copy , MT4 模拟账号运行 Easy And Fast Copy , MT5 模拟账号运行 唐奇安通道指标计算: 唐奇安上阻力线 - 由过去N天的当日最高价的最大值形成。 唐奇安下支撑线 - 由过去N天的当日最低价的最小值形成。 中心线 - (上线 + 下线)/ 2   唐奇安通道信号   唐奇安通道常用作突破指标。它提供了两种主要类型的突破信号,一个是上阻力线或下支撑线
FREE
Filtro:
Sem comentários
Responder ao comentário
Versão 3.9 2023.05.02
>>>>>>>>>>>>>>
Versão 2.55 2021.10.15
>>>>>>>>>>
Versão 2.51 2021.10.03
>>>>>>>>>>>>>>>>