• Visão global
  • Comentários (2)
  • Discussão (1)

Atr volatility alert

100 % PER MONTH PROFIT----MY NEW SIGNAL HERE -------> https://www.mql5.com/en/signals/2162238?source=Site+Signals+My#


What Is the Average True Range (ATR)?

The average true range (ATR) is a technical analysis indicator, introduced by market technician J. Welles Wilder Jr. in his book New Concepts in Technical Trading Systems, that measures market volatility by decomposing the entire range of an asset price for that period.

The true range indicator is taken as the greatest of the following: current high less the current low; the absolute value of the current high less the previous close; and the absolute value of the current low less the previous close. The ATR is then a moving average, generally using 14 days, of the true ranges.


TR=Max[(H  L),Abs(H  CP),Abs(L  CP)]ATR=(n 1)(i=1)(n)TRi

where:TRi=A particular true range

n=The time period employed


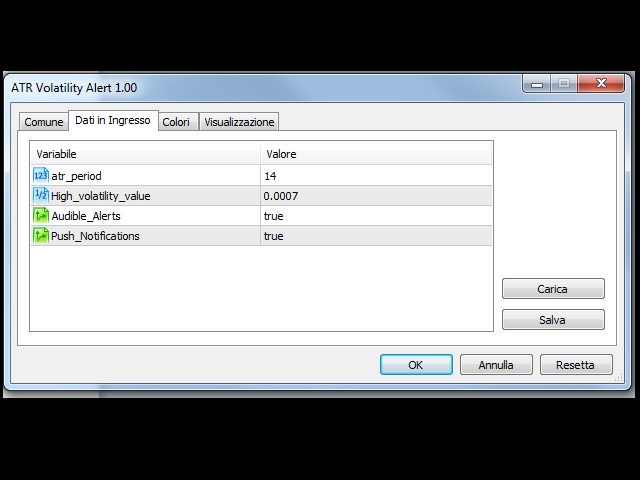
ATR VOLATILITY ALERT ,give you a signal directly to your phone whenever the atr value ( you can set atr period and value that you in parameters ) crosses above the value that you set.


This is a very important tool for experienced and not experienced traders .
Please feel free to contact me for every question.


Good Trading :)

Produtos recomendados
Você utiliza o volume na sua leitura do mercado? Certamente muitos traders usam, e não se imaginam operando sem ele. O indicador Color Histogram Volume Set permite que o usuário escolha o valor que ele considera interessante para monitorar. Ao ultrapassar este você terá a confirmação visual e se quiser terá também o alerta sonoro que é dado pelo indicador. Claro que existem outras maneiras de tentar encontrar um volume elevado, como avaliar se o v olume está acima da média, se é o maior vo
Owl Smart Levels MT5
Sergey Ermolov
4.39 (38)
Versão MT4  |  FAQ O Indicador Owl Smart Levels é um sistema de negociação completo dentro de um indicador que inclui ferramentas populares de análise de mercado, como fractais avançados de Bill Williams , Valable ZigZag que constrói a estrutura de onda correta do mercado e níveis de Fibonacci que marcam os níveis exatos de entrada no mercado e lugares para obter lucros. Descrição detalhada da estratégia Instruções para trabalhar com o indicador Consultor de negociação Owl Helper Chat privado d
Colored Chaikin Money Flow
Sidnei Da Silva Santos Junior
O Chaikin Money Flow é um indicador criado nos anos de 1980 por Marc Chaikin para monitorar zonas de acumulação e distribuição de uma ação por um determinado período. O período padrão sugerido é de 21 dias. Esse indicador flutua em uma escala que parte de -1 até +1. Qualquer cruzamento da linha zero pode ser usado para confirmar mudanças no fluxo de dinheiro, que resulta em mudanças na direção do preço. Muitos traders usam esse indicador para medir a pressão de compra ou venda em um período, tam
Follow The Line MT5
Oliver Gideon Amofa Appiah
4.42 (31)
This indicator obeys the popular maxim that: "THE TREND IS YOUR FRIEND" It paints a GREEN line for BUY and also paints a RED line for SELL. (you can change the colors). It gives alarms and alerts of all kinds. IT DOES NOT REPAINT and can be used for all currency pairs and timeframes. Yes, as easy and simple as that. Even a newbie can use it to make great and reliable trades. NB: For best results, get my other premium indicators for more powerful and reliable signals. Get them here: https://www.m
FREE
BoxInside MT5
Evgeny Shevtsov
5 (4)
This indicator calculates the volume profile and places labels that correspond to the VAH, VAL and POC levels, for each candle individually. Indicator operation features The indicator works on the timeframes from M3 to MN, but it uses the history data of smaller periods: M1 - for periods from M3 to H1, M5 - for periods from H2 to H12, M30 - for the D1 period, H4 - for the W1 period, D1 - for the MN period. The color and location of the VAL, VAH and POC labels on the current candle are consider
FREE
Robust median Renko style indicator for creating custom charts resembling Median Renko, Mean Renko, Turbo Renko and Better Renko candles as well as vanilla Renko with wicks plus Point-O charts. This all in one package provides all of the signals needed by day traders, scalpers, and even long-term traders. Main characteristics The indicator is an overlay on the main chart so it is possible to utilize one-click trading and order manipulation directly on the custom charts. Visual order placement
The indicator is designed to work on any trading platform. The program is based on proprietary algorithms and W.D.Ganna's mathematics, allowing you to calculate target levels of price movement based on three points with the highest degree of certainty. It is a great tool for stock trading. The indicator has three buttons: NEW - call up a triangle for calculation. DEL - delete the selected triangle. DELS - completely remove all constructions. The probability of achieving the goals is more than 80
Gold Super Trends AutoTrader Robot
Hesham Ahmed Kamal Barakat
5 (5)
60% Discount General description; This EA is made to be used in the Gold market. It's made for trading Gold in mind. This Trading Robot is based on more than 14 years of winning patterns and will open trades by the minute, 24 hours a day. It will handle everything, from opening positions, closing them, managing risk. Features; - Timeframe-Less Expert Advisor that works by the second and recalculate everything with whichever situation that might exist. - Dynamic market watcher that adjust it
Gioteen Volatility Index (GVI) - your ultimate solution to overcoming market unpredictability and maximizing trading opportunities. This revolutionary indicator helps you in lowering your losing trades due to choppy market movements. The GVI is designed to measure market volatility, providing you with valuable insights to identify the most favorable trading prospects. Its intuitive interface consists of a dynamic red line representing the volatility index, accompanied by blue line that indicate
High Tech EA Audcad
German Mazzaferro
This high quality, high tech EA detects reversions in AUDCAD H4 In longs, you will have a dynamic and complex way of closing trades that gives a very high winrate, while in shorts is simple but still has . Taking in consideration market dynamics. Longs and shorts should be treated always differently. Also longs and shorts have different indicators to get in, while the idea is the same. It is truly a high tech EA. Pros: Precise, high winrate (88% and more), dynamic open and close of trades, mo
Blahtech VWAP MT5
Blahtech Limited
5 (1)
Was: $69  Now: $34   Blahtech VWAP - Volume Weighted Average Price (VWAP) is the ratio of price to total volume. It provides an average price over a specified time interval.  Links [  Install  |  Update  |  Documentation   ] Feature Highlights Configurable VWAP Line Sessions, intervals, anchored or continuous Previous day settlement line Standard Deviation bands Alerts at bar close or real time Automatic Broker or Tick volumes Significantly reduced CPU usage Input Parameters Expert Advisor
Aggression Volume
Flavio Javier Jarabeck
3.91 (22)
O Indicador de Volume de Agressão é o tipo de indicador que raramente é encontrado na comunidade MQL5 porque não é baseado nos dados de Volume padrão fornecidos pela plataforma Metatrader 5. Ele requer a análise de todos os Ticks de tráfego solicitados na plataforma... Dito isso, o indicador de Volume de Agressão solicita todos os Dados de Tick do seu Broker e os processa para construir uma versão muito especial de um Indicador de Volume, onde as agressões de Compradores e Vendedores são plotada
FREE
BoxChart MT5
Evgeny Shevtsov
5 (7)
The market is unfair if only because 10% of participants manage 90% of funds. An ordinary trader has slim changes to stand against these "vultures". This problem can be solved. You just need to be among these 10%, learn to predict their intentions and move with them. Volume is the only preemptive factor that faultlessly works on any timeframe and symbol. First, the volume appears and is accumulated, and only then the price moves. The price moves from one volume to another. Areas of volume accumu
Value Chart Candlesticks
Flavio Javier Jarabeck
4.67 (9)
The idea of a Value Chart indicator was presented in the very good book I read back in 2020 , " Dynamic Trading Indicators: Winning with Value Charts and Price Action Profile ", from the authors Mark Helweg and David Stendahl. The idea is simple and the result is pure genius: Present candlestick Price analysis in a detrended way! HOW TO READ THIS INDICATOR Look for Overbought and Oversold levels. Of course, you will need to test the settings a lot to find the "correct" one for your approach.
FREE
Reversal Composite Candles
MetaQuotes Ltd.
3.43 (23)
A ideia do sistema é a identificação de padrões de reversão utilizando o cálculo de candles compostos. Os padrões de reversão são semelhantes aos padrões "Martelo" e o " Homem Enforcado " da análise candlestick Japonesa, porém ele usa candles compostos em vez de uma única barra e não precisa do pequeno corpo numa composição para confirmar a reversão. Os parâmetros de entrada: Range - número máximo de barras, utilizada no cálculo de composição dos candles compostos . Minimum - tamanho mínimo d
FREE
Wapv Price and volume
Eduardo Da Costa Custodio Santos
O Indicador WAPV Price and Volume para MT5 faz parte do conjunto de ferramentas do (Wyckoff Academy Wave Market) e ( Wyckoff Academy Price and Volume). O Indicador WAPV Price and Volume para MT5 foi criado para facilitar a visualização da movimentação do volume  no gráfico de forma intuitiva. Com ele você pode observar os momentos de pico de volume e momentos em que o mercado não tem interesse profissional Identificar momentos que o Mercado esta se movimentando por inércia e não por movim
Volume Analysis Trader looks at volume using a fixed average of volume. This averaging helps spot when volume is rising or declining. Also I have added volume spikes which are when volume suddenly is above the average. These help spot market reversals. This will hep a trader look for the following in their trading: Rising volume during a rally shows trend is strong. Falling volume on a rally shows trend is weakening. As a rule of thumb on daily charts if current volume is higher than yester
Was: $249  Now: $99   Market Profile defines a number of day types that can help the trader to determine market behaviour. A key feature is the Value Area, representing the range of price action where 70% of trading took place. Understanding the Value Area can give traders valuable insight into market direction and establish the higher odds trade. It is an excellent addition to any system you may be using. Inspired by Jim Dalton’s book “Mind Over Markets”, this indicator is designed to suit the
Start Midas SD Channel
Ricardo Almeida Branco
5 (1)
Já conhece o indicador Start Midas? E o indicador Vwap Standard Deviation? E preciso novamente falar no livro MIDAS Technical Analysis... O indicador Start Midas SD Channel combina os dois em um, trazendo a praticidade e eficiência da Midas com o cálculo estatístico do desvio padrão. Tudo isso com a praticidade dos indicadores Start da White Trader, onde você pode plotar o indicador e movimentá-los na tela usando atalhos de teclado. Se você acha que este indicador vai somar no seu operaciona
Each bar graph is a brick, take buy a bill now as an example, the brick that is in lowest position at the moment, go to the left, when the brick with the 3rd highest is in existence, take the height of this brick as a benchmark, when the price exceeds the height of this brick, can establish buy a bill, when appear opposite circumstance closes a position, establish empty order at the same time. This is a simple rule, need each friend grope by oneself.
This z-score indicator shows the correct z-score of an asset, as it uses the normalized price data for calculation, which is the only correct way. Z-score is only applicable for normal distributed data, therefore not the actual price is considered, but the normalised returns, which were assumed to follow a normal distribution. Returns are mean reverting and assumed to follow a normal distribution, therefore z-score calculation of returns is more reliable than z-score on price, as price is NOT m
O indicador cria cotações atuais, que podem ser comparadas com as históricas e, com base nisso, fazer uma previsão do movimento dos preços. O indicador possui um campo de texto para navegação rápida até a data desejada. Opções: Símbolo - seleção do símbolo que o indicador exibirá; SymbolPeriod - seleção do período do qual o indicador coletará dados; IndicatorColor - cor do indicador; HorisontalShift - deslocamento das cotações desenhadas pelo indicador pelo número especificado de
Este é o indicador Índice de Direção do Movimento (ADX - Average Directional Index) customizado da Gekko Trading, a versão customizada do famoso ADX. Use o ADX tradicional mas com a vantagem de configurar diferentes tipos de sinal de entrada e várias formas de ser alertado todas vez que houver um possível ponto de entrada ou saída do mercado. Parâmetros de Entrada Period: Período do ADX; PlotSignalType : Modo de cálculo do sinal de confirmação de tendência e direção do movimento 1- ShowSwingsO
Indcador/Oscilador basado en el concepto de la física clásica, "Cantidad de movimiento". Fácilmente adaptable a diferentes pares y activos, como a períodos de time frame. Los parámetros de entrada son los que siguen, y pueden modificarse por el usuario: TrendPeriod  = 14;      // Trend period Smooth       = 3;       // Smoothing period TriggerUp    =  0.05;   // Trigger up level TriggerDown  = -0.05;   // Trigger down level
Description Trend Influencer is an indicator that determines the potential dynamics of the influence of trend wave movements on the market. The indicator is based on the value of moving averages corrected by the standard deviation. The indicator is displayed as a main dash-dotted moving average and a signal solid moving average. The signal moving average is colored blue or red depending on what type of trend is currently observed in the market. The indicator also draws inhibition levels - blue
Based on the trading model/strategy/system of gold double-position hedging and arbitrage launched by Goodtrade Brokers, problems encountered in daily operations: 1. Account B immediately places an order immediately following account A. 2: After account A places an order, account B will automatically copy the stop loss and take profit. 3: Account A closes the position of Account B and closes the position at the same time. 4: When account B closes the position, account A also closes the position.
Donchian Pro
Paulo Henrique Faquineli Garcia
5 (2)
O Canal Donchian Os canais são uma das ferramentas de análise técnica mais populares porque transmitem intuitivamente aos analistas as restrições que tendem a ocorrer na maioria das mudanças de preço. Os usuários do canal sabem que informações valiosas podem ser obtidas a qualquer momento, independentemente de o preço estar no centro de uma faixa ou próximo a uma das fronteiras. Uma das técnicas mais famosas para explorar esses conceitos são as bandas de Bollinger. No entanto, John Bollinger não
FREE
White Weis Volume Ticks
Ricardo Almeida Branco
5 (3)
White Weis Volume Este indicador mostra o somatório do volume em cada onda, bulish ou bearish, conforme idealizado por David Weis, mas traz um importante adicional que é a marcação da barra de maior volume da onda (White Bar)! Na codificação do indicador, foi buscado otimizar o código para exigir o mínimo processamento durante o uso e não sobrecarregar o mt5. O indicador pode ser usado para análise e estudo pré pregão, onde o trader analisa possíveis pontos de suporte e resistência com
Blahtech Supply Demand MT5
Blahtech Limited
4.54 (13)
Was: $299  Now: $99   Supply Demand uses previous price action to identify potential imbalances between buyers and sellers. The key is to identify the better odds zones, not just the untouched ones. Blahtech Supply Demand indicator delivers functionality previously unavailable on any trading platform. This 4-in-1 indicator not only highlights the higher probability zones using a multi-criteria strength engine, but also combines it with multi-timeframe trend analysis, previously confirmed swings
Weis Waves
Flavio Javier Jarabeck
3.15 (26)
The original author is David Weis, an expert in the Wyckoff Method. The Weis Wave is a modern adaptation of the 1930's Wyckoff Method, another expert in Tape Reading techniques and Chart Analysis. Weis Waves takes market volume and stacks it into waves according to price conditions giving the trader valuable insights about the market conditions. If you want to learn more about this subject you can find tons of videos in YouTube. Just look for "The Wickoff Method", "Weis Wave" and "Volume Spread
FREE
Os compradores deste produto também adquirem
Atomic Analyst MT5
Issam Kassas
5 (15)
Primeiramente, vale ressaltar que este Indicador de Negociação não repinta, não redesenha e não apresenta atrasos, tornando-o ideal tanto para negociação manual quanto automatizada. Manual do utilizador: configurações, entradas e estratégia. O Analista Atômico é um Indicador de Ação de Preço PA que utiliza a força e o momentum do preço para encontrar uma vantagem melhor no mercado. Equipado com filtros avançados que ajudam a remover ruídos e sinais falsos, e aumentam o potencial de negociação.
Primeiramente, vale ressaltar que este Sistema de Trading é um Indicador Não Repintado, Não Redesenho e Não Atrasado, o que o torna ideal tanto para o trading manual quanto para o automatizado. Curso online, manual e download de predefinições. O "Sistema de Trading Inteligente MT5" é uma solução completa de trading projetada para traders novos e experientes. Ele combina mais de 10 indicadores premium e apresenta mais de 7 estratégias de trading robustas, tornando-o uma escolha versátil para dive
Quantum Trend Sniper
Bogdan Ion Puscasu
5 (46)
Apresentando       Quantum Trend Sniper Indicator   , o inovador Indicador MQL5 que está transformando a maneira como você identifica e negocia as reversões de tendência! Desenvolvido por uma equipe de traders experientes com experiência comercial de mais de 13 anos,       Indicador de Atirador de Tendência Quântica       foi projetado para impulsionar sua jornada de negociação a novos patamares com sua forma inovadora de identificar reversões de tendência com precisão extremamente alta. ***C
Este é um indicador para MT5 que fornece sinais precisos para entrar em uma negociação sem redesenhar. Ele pode ser aplicado a qualquer ativo financeiro: forex, criptomoedas, metais, ações, índices. Ele fornecerá estimativas bastante precisas e informará quando é melhor abrir e fechar um negócio. Assista o vídeo (6:22) com um exemplo de processamento de apenas um sinal que compensou o indicador! A maioria dos traders melhora seus resultados de negociação durante a primeira semana de negociação c
AT Forex Indicator MT5
Marzena Maria Szmit
5 (4)
The AT Forex Indicator MT5 is a sophisticated trading tool designed to provide traders with a comprehensive analysis of multiple currency pairs. This powerful indicator simplifies the complex nature of the forex market, making it accessible for both novice and experienced traders. AT Forex Indicator uses advanced algorithms to detect trends, patterns and is an essential tool for traders aiming to enhance their forex trading performance. With its robust features, ease of use, and reliable signal
Reversal First Impulse levels (RFI)      INSTRUCTIONS        RUS       -       ENG              R ecommended to use with an indicator   -   TPSpro  TREND PRO -  Version MT4                 A key element in trading is zones or levels from which decisions to buy or sell a trading instrument are made. Despite attempts by major players to conceal their presence in the market, they inevitably leave traces. Our task was to learn how to identify these traces and interpret them correctly. Main functi
FX Power MT5 NG
Daniel Stein
5 (5)
Receba a sua atualização diária do mercado com detalhes e screenshots através do nosso Morning Briefing aqui no mql5 e no Telegram ! O FX Power MT5 NG é a próxima geração do nosso medidor de força de moeda muito popular de longa data, o FX Power. E o que é que este medidor de força da próxima geração oferece? Tudo o que adorou no FX Power original MAIS Análise de força GOLD/XAU Resultados de cálculo ainda mais precisos Períodos de análise configuráveis individualmente Limite de cálculo personal
FX Volume MT5
Daniel Stein
4.94 (17)
Receba a sua atualização diária do mercado com detalhes e screenshots através do nosso Morning Briefing aqui no mql5 e no Telegram ! O Volume FX é o PRIMEIRO e ÚNICO indicador de volume que fornece uma visão REAL do sentimento do mercado do ponto de vista de um corretor. Ele fornece uma visão incrível de como os participantes do mercado institucional, como corretores, estão posicionados no mercado Forex, muito mais rápido do que os relatórios COT. Ver essas informações diretamente no seu gráfi
TPSproTREND PrO MT5
Roman Podpora
4.88 (8)
TPSpro TRENDPRO  - is a trend indicator that automatically analyzes the market and provides information about the trend and each of its changes, as well as giving signals for entering trades without redrawing! The indicator uses each candle, analyzing them separately. referring to different impulses - up or down impulse. Exact entry points into transactions for currencies, crypto, metals, stocks, indices!  -  Version MT4               DETAILED DESCRIPTION               R ecommended to use with
XQ Indicator MetaTrader 5
Marzena Maria Szmit
5 (1)
Step into the realm of Forex trading with confidence and precision using XQ, a cutting-edge Forex indicator designed to elevate your trading game to unprecedented heights. Whether you're a seasoned trader or just stepping into the world of currency exchange, XQ Forex Indicator empowers you with the insights and signals needed to make informed trading decisions. The signal conditions are a combination of three indicators, and XQ Forex Indicator only display  medium and long-term trends . The ind
Antes de tudo, vale ressaltar que esta Ferramenta de Negociação é um Indicador Não Repintante, Não Redesenhante e Não Atrasado, o que a torna ideal para negociação profissional. Curso online, manual do utilizador e demonstração. O Indicador de Conceitos de Ação de Preço Inteligente é uma ferramenta muito poderosa tanto para traders novos quanto experientes. Ele combina mais de 20 indicadores úteis em um único, combinando ideias avançadas de negociação como Análise do Trader do Círculo Intern
Apresentando       Quantum Breakout PRO   , o inovador Indicador MQL5 que está transformando a maneira como você negocia Breakout Zones! Desenvolvido por uma equipe de traders experientes com experiência comercial de mais de 13 anos,       Quantum Breakout PRO       foi projetado para impulsionar sua jornada comercial a novos patamares com sua estratégia de zona de fuga inovadora e dinâmica. O Quantum Breakout Indicator lhe dará setas de sinal em zonas de breakout com 5 zonas-alvo de lucro e
TPA True Price Action indicator reveals the true price action of the market makers through 100% non-repainting signals strictly at the close of a candle! TPA shows entries and re-entries, every time the bulls are definitely stronger than the bears and vice versa. Not to confuse with red/green candles. The shift of power gets confirmed at the earliest stage and is ONE exit strategy of several. There are available now two free parts of the TPA User Guide for our customers. The first "The Basics"
Advanced Supply Demand MT5
Bernhard Schweigert
4.53 (15)
Atualmente com 33% de desconto! A melhor solução para qualquer Trader Novato ou especialista! Este indicador é uma ferramenta de negociação exclusiva, de alta qualidade e acessível porque incorporamos uma série de recursos proprietários e uma nova fórmula. Com esta atualização, você poderá mostrar fusos horários duplos. Você não só será capaz de mostrar um TF mais alto, mas também mostrar ambos, o TF do gráfico, MAIS o TF mais alto: MOSTRANDO ZONAS ANINHADAS. Todos os traders de Oferta e Demanda
ICT, SMC, SMART MONEY CONCEPTS, SMART MONEY, Smart Money Concept, Support and Resistance, Trend Analysis, Price Action, Market Structure, Order Blocks, BOS/CHoCH,   Breaker Blocks ,  Momentum Shift,   Supply&Demand Zone/Order Blocks , Strong Imbalance,   HH/LL/HL/LH,    Fair Value Gap, FVG,  Premium  &   Discount   Zones, Fibonacci Retracement, OTE, Buy Side Liquidity, Sell Side Liquidity, BSL/SSL Taken, Equal Highs & Lows, MTF Dashboard, Multiple Time Frame, BigBar, HTF OB, HTF Market Structure
Matrix Arrow Indicator MT5
Juvenille Emperor Limited
5 (14)
O   Matrix Arrow Indicator MT5   é uma tendência única 10 em 1 seguindo um indicador multi-timeframe   100% sem repintura   que pode ser usado em todos os símbolos/instrumentos:   forex ,   commodities ,   criptomoedas ,   índices ,   ações .  O  Matrix Arrow Indicator MT5  determinará a tendência atual em seus estágios iniciais, reunindo informações e dados de até 10 indicadores padrão, que são: Índice de movimento direcional médio (ADX) Índice de canal de commodities (CCI) Velas clássicas de
Quantum Heiken Ashi PRO MT5
Bogdan Ion Puscasu
4.5 (8)
Apresentando o   Quantum Heiken Ashi PRO Projetadas para fornecer informações claras sobre as tendências do mercado, as velas Heiken Ashi são conhecidas por sua capacidade de filtrar o ruído e eliminar sinais falsos. Diga adeus às confusas flutuações de preços e olá para uma representação gráfica mais suave e confiável. O que torna o Quantum Heiken Ashi PRO verdadeiramente único é sua fórmula inovadora, que transforma os dados tradicionais de velas em barras coloridas fáceis de ler. As barras ve
Gartley Hunter Multi
Siarhei Vashchylka
5 (7)
Gartley Hunter Multi - An indicator for searching for harmonic patterns simultaneously on dozens of trading instruments and on all possible timeframes. Manual (Be sure to read before purchasing) | Version for MT4 Advantages 1. Patterns: Gartley, Butterfly, Shark, Crab. Bat, Alternate Bat, Deep Crab, Cypher 2. Simultaneous search for patterns on dozens of trading instruments and on all possible timeframes 3. Search for patterns of all possible sizes. From the smallest to the largest 4. A
Auto Order Block with break of structure based on ICT and Smart Money Concepts (SMC) Futures Break of Structure ( BoS )             Order block ( OB )            Higher time frame Order block / Point of Interest ( POI )    shown on current chart           Fair value Gap ( FVG ) / Imbalance   -  MTF      ( Multi Time Frame )    HH/LL/HL/LH  -  MTF      ( Multi Time Frame )  Choch  MTF      ( Multi Time Frame )  Volume Imbalance     ,  MTF          vIMB Gap’s Power of 3 Equal High
O Oscilador de Índice de Precisão (Pi-Osc) de Roger Medcalf da Precision Trading Systems A Versão 2 foi cuidadosamente reconfigurada para carregar rapidamente em seu gráfico, e algumas outras melhorias técnicas foram incorporadas para aprimorar a experiência. O Pi-Osc foi criado para fornecer sinais precisos de temporização de negociações projetados para encontrar pontos de exaustão extremos, os pontos para os quais os mercados são forçados a ir apenas para tirar as ordens de todos. Este
Legacy of Gann for MT5
Pavel Zamoshnikov
5 (6)
The indicator very accurately determines the levels of the possible end of the trend and profit fixing. The method of determining levels is based on the ideas of W.D.Gann, using an algorithm developed by his follower Kirill Borovsky. Extremely high reliability of reaching levels (according to K. Borovsky  - 80-90%) Indispensable for any trading strategy – every trader needs to determine the exit point from the market! Precisely determines targets on any timeframes and any instruments (forex, met
Bill Williams Advanced
Siarhei Vashchylka
5 (7)
Bill Williams Advanced is designed for automatic chart analysis using Bill Williams' "Profitunity" system. The indicator analyzes four timeframes at once. Manual (Be sure to read before purchasing) Advantages 1. Automatically analyzes the chart using the "Profitunity" system of Bill Williams. The found signals are placed in a table in the corner of the screen. 2. Equipped with a trend filter based on the Alligator indicator. Most of the system signals are recommended to be used only accordi
SMCpro
Arief
5 (1)
Currently Price  20% OFF  ( for unlimited use ) Indicator   USER MANUAL , trade setups, solving issues, etc :  Direct Download Here     (  for users only  ) Hello World! Introducing.. SMCpro tool and Indicator for  MetaTrader 5 , a cutting-edge feature designed to revolutionize your trading experience. With innovative ICT Smart Money Concept, you gain unparalleled insight into market dynamics, empowering you to make informed trading decisions like never before. SMC Indicator built on th
AW Trend Predictor MT5
AW Trading Software Limited
4.78 (58)
A combinação de níveis de tendência e quebra em um sistema. Um algoritmo de indicador avançado filtra o ruído do mercado, determina a tendência, os pontos de entrada e os possíveis níveis de saída. Os sinais indicadores são registrados em um módulo estatístico, que permite selecionar as ferramentas mais adequadas, mostrando a eficácia do histórico do sinal. O indicador calcula as marcas Take Profit e Stop Loss. Manual e instruções ->   AQUI   / versão MT4 ->   AQUI Como negociar com o indicador
Este é sem dúvida o indicador de reconhecimento automático de formação de preço harmônico mais completo que você pode encontrar para a MetaTrader Platform. Ele detecta 19 padrões diferentes, leva as projeções de Fibonacci tão a sério quanto você, exibe a Zona de Reversão Potencial (PRZ) e encontra níveis adequados de stop loss e take-profit. [ Guia de instalação | Guia de atualização | Solução de problemas | FAQ | Todos os produtos ] Detecta 19 formações harmônicas de preços diferentes Tr
Go Way TREND
Ywsf Hsyn Hmad Alrsh
Go with the trend.  Yes, wait for an entry signal, whether buy or sell, and enter with the price, and the profit is taken when the drawing line changes, the profit is booked, or when an opposite signal appears. It is very simple and works on all currencies, metals, indices, and on all frames.   How to enter?  Wait for a buy or sell signal and enter with it. You can take or reserve profit after a change appears in the drawing line or the appearance of an opposite signal.
IVISTscalp5
Vadym Zhukovskyi
5 (5)
Apresentamos a você o indicador iVISTscalp5, que não é apenas único, mas também eficaz em operações de negociação. Este indicador é baseado em dados de tempo e é o resultado de muitos anos de experiência e análise aprofundada dos mercados financeiros. O indicador iVISTscalp5 é uma excelente ferramenta para negociação manual. Conveniência, simplicidade e visualização - toda a complexidade está escondida dentro dele. Simplificamos as configurações e o uso do indicador iVISTscalp5 ao máximo. O indi
Volume by Price MT5
Brian Collard
4.2 (5)
The Volumebyprice.com Indicator for MetaTrader 5 features Volume Profile and Market Profile TPO (Time Price Opportunity). Volume and TPO histogram bar and line charts. Volume Footprint charts. TPO letter and block marker collapsed and split structure charts. Static, dynamic and flexible range segmentation and compositing methods with relative and absolute visualizations. Session hours filtering and segment concatenation with Market Watch and custom user specifications. Graphical layering, posit
Pivot Prof
Paul Anscombe
4.94 (49)
Our 5 Star Best Seller Beginner or Professional our best selling multi-timeframe Pivot Prof will enhance your trading and bring you great trade opportunities with the Support and Resistance levels that professionals use. Pivot trading is a simple effective method for entering and exiting the market at key levels and has been used by professionals for decades and works on all symbols: Forex, Crypto, Stocks, Indicies etc. Pivot Prof brings premium levels to the trader where the market is most like
O Multi-Oscillator é o melhor canivete suíço para negociação em várias moedas e prazos múltiplos. Ele plota o oscilador desejado para muitos pares de moedas e / ou prazos em um único gráfico. Pode ser usado para negociar arbitragem estatística, como uma ferramenta de triagem de mercado ou como um indicador refinado de múltiplos prazos. [ Guia de instalação | Guia de atualização | Solução de problemas | FAQ | Todos os produtos ] Fácil interpretação e configuração Suporta 16 indicadores conhecido
Mais do autor
Martina Advisor
Giovanna Talio
100 % PER MONTH PROFIT---- MY NEW SIGNAL HERE ------->   https://www.mql5.com/en/signals/2162238?source=Site+Signals+My# THANKS FOR TRUST IN OUR PRODUCT AND SUPPORT US ! Martina Advisor 2021 is a 100 % Automatic System . Based on severals indicators on different timeframes and a SECRET TRENDING INDICATOR BUILT IN SYSTEM CHARACTERISTICS: TAKE PROFIT AND STOP LOSS FOR EVERY POSITION SIMPLE SETTINGS PLUG AND PLAY  RECOVERING SYSTEM FOR EVERY LOSS STARTING ALSO FROM 560 USD CENTS PASSED STR
GIVE A LOOK TO MY OTHER PRODUCTS ! 100 % PER MONTH PROFIT---- MY NEW SIGNAL HERE ------->   https://www.mql5.com/en/signals/2162238?source=Site+Signals+My# BROKEN TRENDLINE ALERT IS A SIMPLE TOOL INDICATOR. JUST DRAW IN YOUR CHART A DYNAMIC OR STATIC TRENDLINE,AND THE INDICATOR WILL SEND YOU ALERT WHENEVER THE PRICE CROSSES BELOW OR ABOVE YOUR DRAWN TRENDLINE. IT WORKS IN ANY TIMEFRAME AND ANY CHART YOU WANT.JUST GOT A VPS AND DON'T STRESS IN FRONT OF YOUR COMPUTER. FOR ANY KIND OF QUESTION
GIVE A LOOK TO MY OTHER PRODUCTS ! 100 % PER MONTH PROFIT---- MY NEW SIGNAL HERE ------->   https://www.mql5.com/en/signals/2162238?source=Site+Signals+My#                       MACD Cross Alert is a tool indicator that notificate directly to your phone whenever the signal line crosses the base line. For more accurate signals,crosses are filtered like this : Buy Signal : SIGNAL LINE CROSSES ABOVE BASE LINE AND BOTH ARE ABOVE THE 0 VALUE Sell Signal : SIGNAL LINE CROSSES BELOW BASE LINE AN
Breakout Wall
Giovanna Talio
5 (1)
GIVE A LOOK TO MY OTHER PRODUCTS ! 100 % PER MONTH PROFIT---- MY NEW SIGNAL HERE ------->   https://www.mql5.com/en/signals/2162238?source=Site+Signals+My# Breakout Wall is a very cool indicator. It paints a resistance and a support in the chart given by a "  n  " number of candles ( you can choose the parameter ),and give you an alert when a candle closes below a support or above a resistance.Very important tool if you trade daily candles for example..... Just close your pc and don'
GIVE A LOOK TO MY OTHER PRODUCTS ! 100 % PER MONTH PROFIT---- MY NEW SIGNAL HERE ------->   https://www.mql5.com/en/signals/2162238?source=Site+Signals+My# Double MA Cross Alert,is a cool indicator that notificate you directly on your telephone or email when 2 Moving average ( you choose the parameters ) crosses. This is very important when you want to know a change of trend and you can't stay in front of your pc! The indicator give you the alert just when the next bar opens ,so give you a more
GIVE A LOOK TO MY OTHER PRODUCTS ! There are patterns that are more affidable then others.One of the most important is the  engulfing pattern .It is very helpful to understand if there is a change of trend. This indicator find for you affidable engulfing patterns and send you an alert when a pattern is completely formed . To make this alert indicator more reliable,there is a parameter that you can change relative to the engulfing bar ( so the lost one closed before signal ). In fact you can cho
GIVE A LOOK TO MY OTHER PRODUCTS !                                                          100 % PER MONTH PROFIT---- MY NEW SIGNAL HERE ------->   https://www.mql5.com/en/signals/2162238?source=Site+Signals+My# Morning and evening star are 2 famous and reliable candlestick patterns, very helpful to understand an imminent change of trend. This indicator finds for you this patterns on your chart and send you an alert just when a pattern is 100 % formed. To make this indicator more reliable,y
GIVE A LOOK TO MY OTHER PRODUCTS ! 100 % PER MONTH PROFIT---- MY NEW SIGNAL HERE ------->   https://www.mql5.com/en/signals/2162238?source=Site+Signals+My# The Parabolic SAR (PSAR) helps trader identifying direction of the stock movement and also provides them with the entry and exit. This indicator on the chart appears as a series of dots either above or below the price bars. When the Dots are below the price bar is then the price movement is considered to be bullish and when the Dots are a
100 % PER MONTH PROFIT---- MY NEW SIGNAL HERE ------->   https://www.mql5.com/en/signals/2162238?source=Site+Signals+My# ENGULFING PATTER EA IS AN EXPERT ADVISOR THAT OPENS POSITION BASED ON THE " ENGULFING CANDLESTICK PATTERN "  FREE INDICATOR HERE  ------>>>>   https://www.mql5.com/en/market/product/62135?source=Site+Profile+Seller PLEASE KINDLY NOTE THAT THIS EA IS NOT OPTIMIZED AND WITH STANDARD SET IS NOT PROFITABLE.SO PLEASE OPTIMIZE THIS ROBOT BEFORE GOING LIVE . THE ROBOT OPENS POSITIO
CCI Alert
Giovanna Talio
100 % PER MONTH PROFIT---- MY NEW SIGNAL HERE ------->   https://www.mql5.com/en/signals/2162238?source=Site+Signals+My# The Commodity Channel Index (CCI) measures the current price level relative to an average price level over a given period of time. CCI is relatively high when prices are far above their average. CCI is relatively low when prices are far below their average. Using this method, CCI can be used to identify overbought and oversold levels. You can set the period of CCI. The i
100 % PER MONTH PROFIT---- MY NEW SIGNAL HERE ------->   https://www.mql5.com/en/signals/2162238?source=Site+Signals+My# GENERAL BREAKOUT EXPERT ADVISOR The EA is 100 % automatic.Suitable for FTMO. Works on breakout levels with SL and TP for every position and a system of trailing for bad positions.SL & TP are put in strategic level points automatically by an innovative algo system. It's possible to use a fixed lot for the first position,or a automatic lot.( If you have doubs,just send me a
GIVE A LOOK TO MY OTHER PRODUCTS ! 100 % PER MONTH PROFIT---- MY NEW SIGNAL HERE ------->   https://www.mql5.com/en/signals/2162238?source=Site+Signals+My# Smoothed MA cross alert,is a cool indicator that notificate you directly on your telephone or email when 2 Smoothed Moving average ( you choose the parameters ) crosses. This is very important when you want to know a change of trend and you can't stay in front of your pc! The indicator give you the alert just when the next bar opens ,so give
Filtro:
LEONARDO NOCERA
1095
LEONARDO NOCERA 2024.01.14 21:08 
 

O usuário não deixou nenhum comentário para sua avaliação

Fernando Alonso
903
Fernando Alonso 2022.09.11 20:17 
 

O usuário não deixou nenhum comentário para sua avaliação

Responder ao comentário