MACD Max MT5
- Indicadores
- John Louis Fernando Diamante
- Versão: 1.1
- Atualizado: 23 setembro 2021
- Ativações: 5
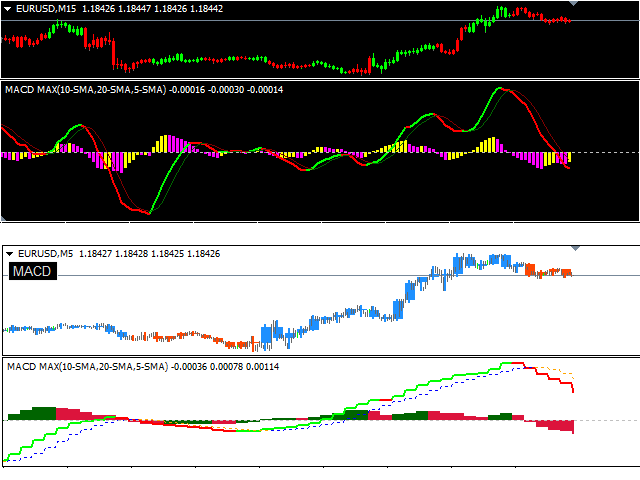
A flexible 2-Line MACD indicator
The default MACD indicator inside MT4, limits you to using the MACD with a fast-EMA, slow-EMA.
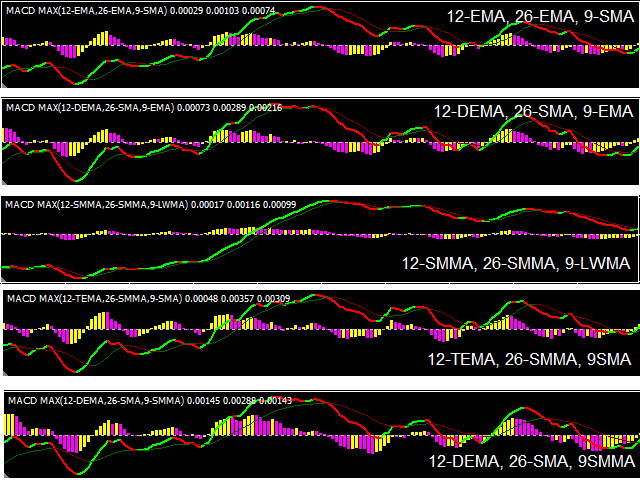
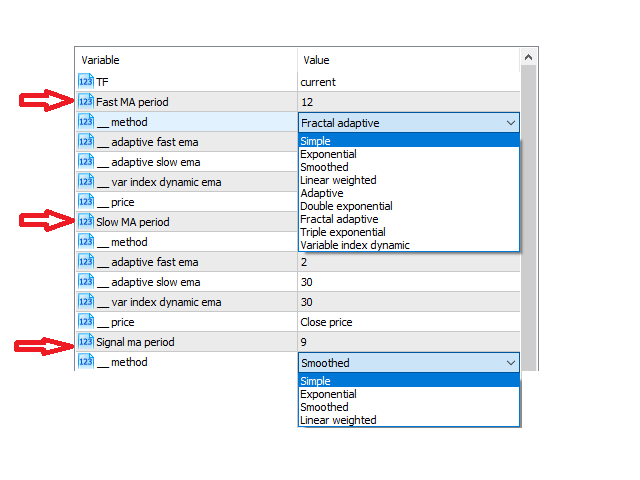
This MACD indicator allows you to set your own MA-Method choices for these 2 components, separately! You can select from SMA, EMA, SMMA, LWMA, ADAPTIVE MA, FRACTAL MA, DEMA, TEMA, VARIABLE INDEX DYNAMIC MA, and can even use a separate method for each 2 fast-slow. The signal line has options from SMA-EMA-SMMA-LWMA.
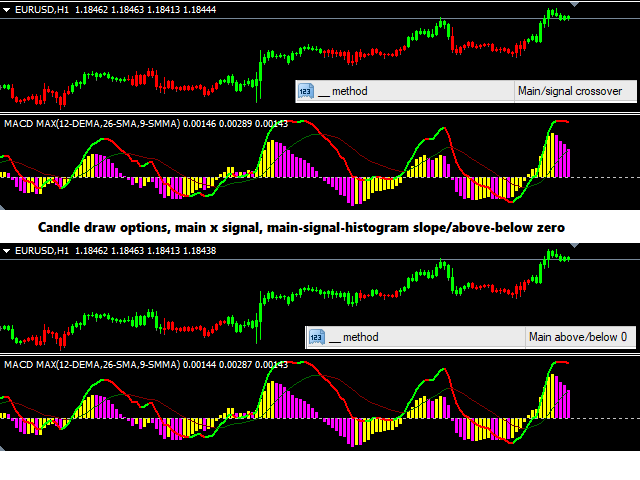
On-chart colored candles, with drawing condition types is included, with a show/hide button too.
Features
- Fast/Slow options: SMA, EMA, SMMA, LWMA, AMA, FrMA, DEMA, TEMA, VIDMA
- Signal options: SMA, EMA, SMMA, LWMA
- separate MA method options for each fast-slow MACD components ie 12-fast-DEMA, 26-slow-LWMA, 9-signal-EMA
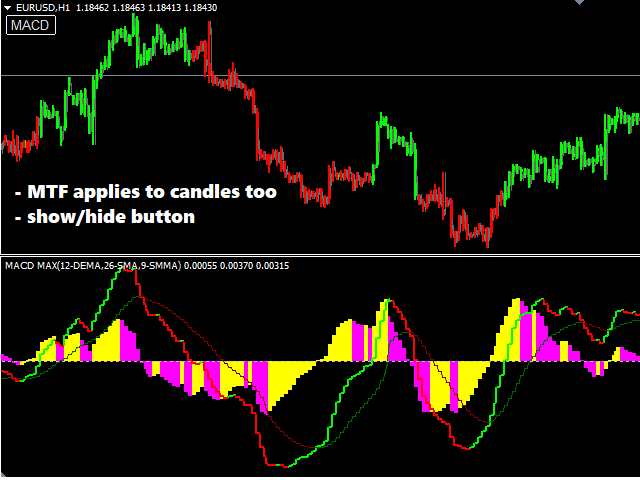
- MTF
- lines and historgram are slope colored
- colored candles on chart, option of 7 drawing conditions, ie main/signal crossover, histogram slope, main slope
- show/hide button for the chart candles
- full alerts with 3 conditions
Troubleshooting:
- If there are any issues or suggestions for the indicator, please comment and let me know. The feedback will be noted and considered in future updates.