Trend Probability Oscillator
- Indicadores
- Michael Goh Joon Seng
- Versão: 1.0
- Ativações: 5
Simple to read and powerful, no fancy lines and drawings to clutter your chart or distract you.
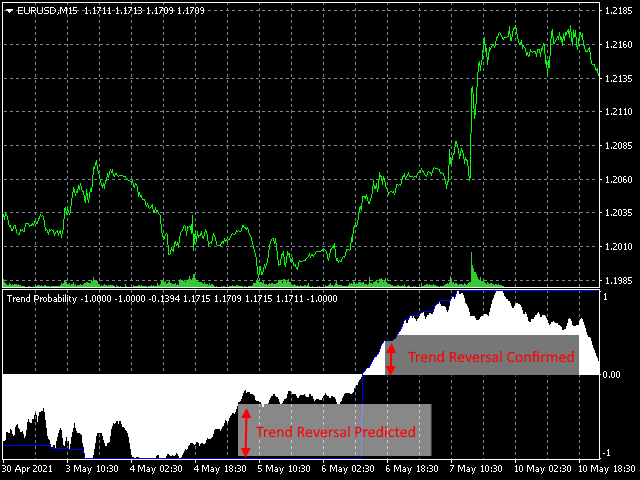
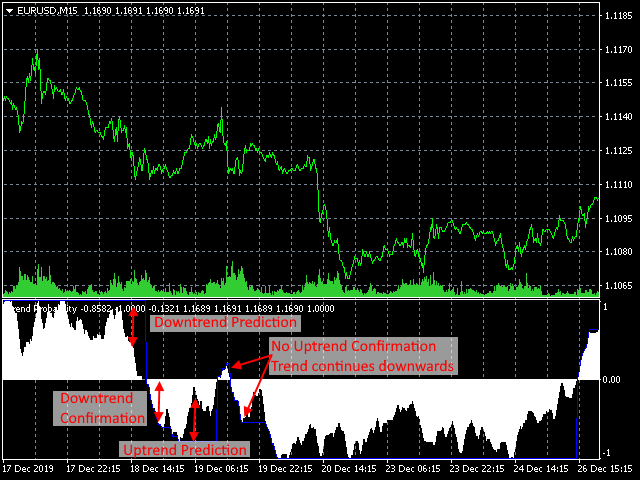
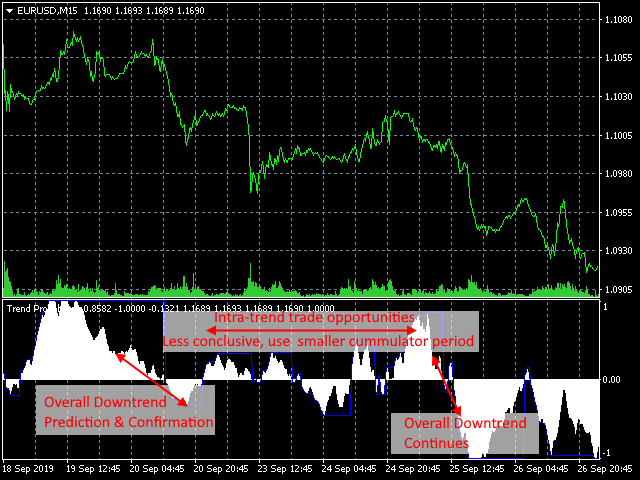
The trend probability oscillator estimates how likely a trend will continue in a certain period. The cummulator period controls how many bars in the past to use and is a proxy for the timescale the trend probability should hold. The use of a Max Line improves this further by indicating when a trend is likely to reverse. In most cases a trend must lose momentum before reversing. Hence, a trend probability departure from a strong Max Line can be a good indication of trend reversal.
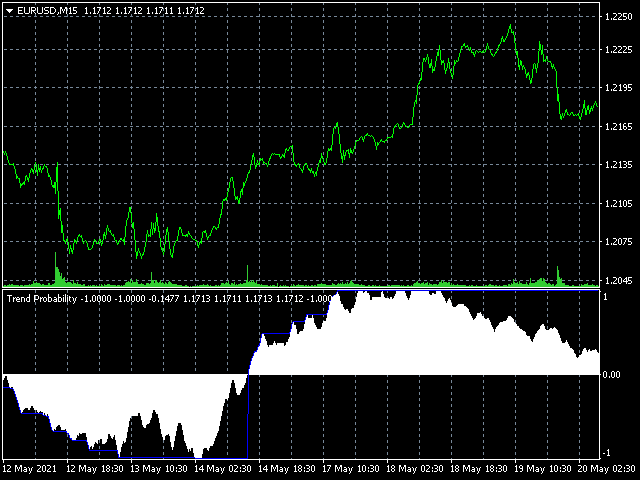
Trend probability more than 0 is the likelihood of an uptrend with 1 being the highest probability
Trend probability less than 0 is the likelihood of an downtrend with -1 being the highest probability
The Max Line is a very important feature to provide a reference of the recent strongest probability
Input
Cummulator Period: Accumulation Period for calculating trend probability
Max Line Period: Period to check for strongest trend probability
Output
Buffer 0: Trend Probability --- Ranges from -1 to 1. 1 indicates strongest uptrend and -1 indicates strongest downtrend
Buffer 1: Max Line --- Ranges from -1 to 1. The strongest recent Trend Probability ( up to Max Line Period)
Buffer 2-7: Calculation Buffer, do not use.
*Disclaimer
As with all patterns and indicators, anomalous market actions may cause unusual behaviors. No guarantees of future repeatability and/or accuracy is possible.

