Variativity
- Indicadores
- Maxim Kuznetsov
- Versão: 1.0
- Ativações: 5
O indicador avalia o grau de volatilidade dos preços e identifica os componentes que levam ao crescimento e queda. Usando a Variatividade, você pode determinar onde o movimento muda, bons momentos para negociar com a tendência ou contra a tendência. Acompanhe as transações abertas.
Exibição
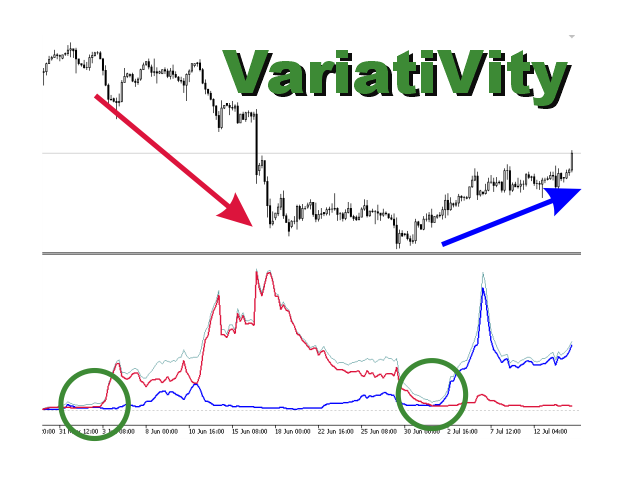
O indicador exibe 3 linhas:
VARIATIVITY - linha cinza fina. Volatilidade total dos preços. O crescimento da linha indica um aumento na atividade do mercado. O declínio indica a possibilidade de negociação contra a tendência. Uma queda significativa para valores pequenos significa uma alta probabilidade de reversão da tendência.
UP - linha azul. A proporção de mudanças que levam a um aumento na taxa de câmbio. O início do crescimento do UP a partir de pequenos valores, enquanto a volatilidade geral diminui, pode servir como um sinal para compras.
DN é a fração que leva a uma diminuição. A proporção de mudanças que levam a uma depreciação.
O cruzamento das linhas UP e DN também pode ser usado como um sinal de entrada.
Usando o indicador
Negociação de tendênciasA negociação de tendências é realizada quando a linha VARIATIVITY começa a subir de valores baixos. A direção é escolhida de acordo com o UP ou DN predominantemente crescente
Negociação de contra-tendênciaA negociação contra-tendência é realizada quando a linha VARIATIVITY diminui e UP ou DN começa a crescer a partir de valores pequenos
Acompanhamento de transaçõesRecomenda-se arrastar as ordens de stop apenas quando a volatilidade total cair.
Tendência e movimento lateral
Uma queda significativa na VARIATIVIDADE para mínimos precede apenas uma possível mudança de tendência e pode indicar o início de um movimento lateral.
Há pouca variabilidade no movimento lateral e pode persistir por muito tempo.
Outras recomendações
Recomenda-se usar o indicador em conjunto com indicadores de faixa (por exemplo ATR) e um cronograma de negociação
Ao usar intervalos de tempo de M30 a H4, você precisa considerar cuidadosamente a ciclicidade diária.
Considere as especificações do instrumento ao escolher um período de tempo. Para metais, é recomendado o uso de grandes prazos H4, D1
Configurações do indicador
O indicador é muito fácil de configurar, possui apenas dois parâmetros principais:
PRICE - seleção de preços para análise. Por padrão, o cálculo é baseado nos preços de abertura de barra
DEPTH - a profundidade da história analisada. Para fins práticos, deve ser significativo, pelo menos 100 bares. O padrão é 240.
SMOOTCH - suavização de linhas. Desativado por padrão, mas você pode definir o período de média. 13 seria uma boa escolha
O indicador realiza uma quantidade significativa de cálculos e para um desempenho ideal, você pode limitar o número de barras calculadas e exibidas
LIMIT - se definido, limita o número de barras calculadas
Boa sorte !
O código-fonte pode ser fornecido ao comprador final para revisão.