Supreme RSI Divergence Scanner
- Utilitários
- Eveline Van Neyghem
- Versão: 1.0
- Ativações: 5
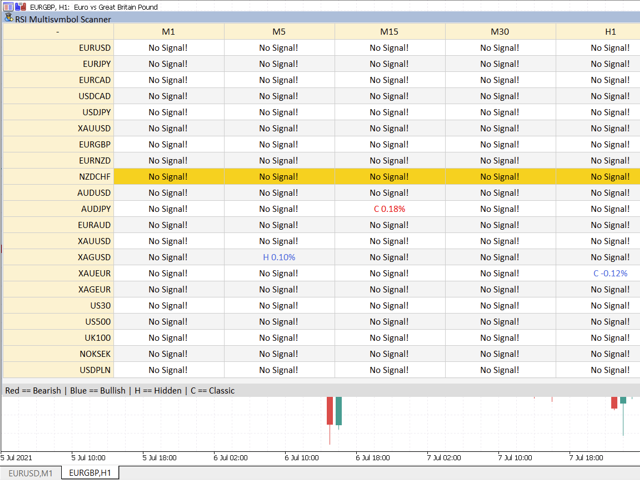
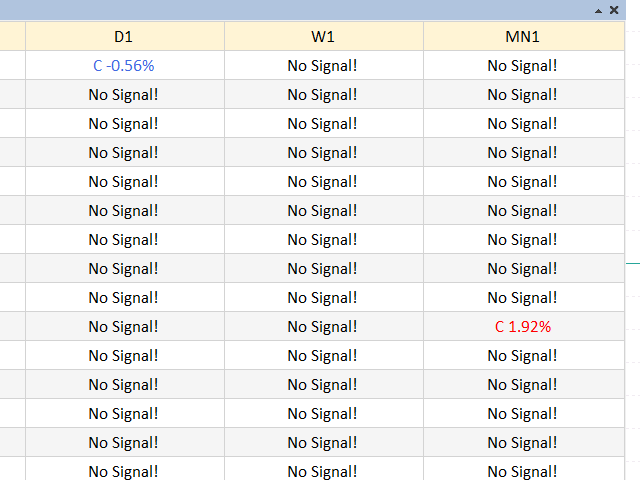
As add-on to our professional divergence indicators we also created superb divergence scanners. These scanners give an overview of the different timeframes of the selected instruments and can save your tons of time. You can instantly see which instrument has a divergence on which timeframe. So no need to run through the charts manually anymore searching for good setups, with this scanner you see the whole market and you know where to look for a good trade opportunity. Even when you are not in front of your screen you get alerted when there is an opportunity in the market!
We have scanners for: RSI, MACD, Stochastics, CCI and OBV.
- RSI Scanner: https://www.mql5.com/en/market/product/69268
- MACD Scanner: https://www.mql5.com/en/market/product/69270
- STOCH Scanner: https://www.mql5.com/en/market/product/69269
- CCI Scanner: https://www.mql5.com/en/market/product/69272
- OBV Scanner: https://www.mql5.com/en/market/product/69271
WARNING: We advise at least a medium speed computer with sufficient CPU power and enough memory to make the indicator run fluently when used on more than 10 pairs. This because it’s a very advanced scanner which does tons of calculations continiously. Please note that the attachment of the scanner to the charts takes about 10-30 seconds to initialize.
FEATURES
- Use the tools that pro traders use
- High quality, non repainting divergence signals
- Classic bearish, classic bullish, hidden bearish and hidden bullish signals
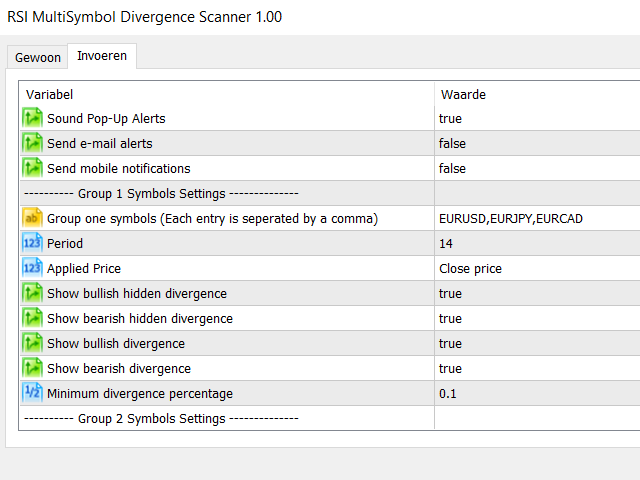
- Pick desired divergence size (only big divergences of all kinds of divergences?)
- Scan the whole market for divergences instantly
- Very easy to use and clean interface
- Direct click trough from the scanner to the chart that contains the signal (ideal for scalping)
- Alerts (pop up with audio, email, mobile)
- Fully compatible with our divergence indicators
- Five different scanning groups, so you can use 5 different settings for the scanner (for example: forex pairs, commodities, indices, … can have their own settings)
HOW TO USE?
Simply attach the scanner to a random chart on a random timeframe. Fill in the inputs as desired and the scanner will generate an overview table on the chart. When attaching the scanner it can take a while for the system to load everything, but once loaded the system will work as supposed.
To be able to use a divergence scanner you need to have the corresponding divergence indicator because the scanner uses the indicator to generate it’s signals. The indicators can be found here:
- RSI: https://www.mql5.com/en/market/product/69264
- MACD: https://www.mql5.com/en/market/product/69265
- STOCH: https://www.mql5.com/en/market/product/69263
- CCI: https://www.mql5.com/en/market/product/69267
- OBV: https://www.mql5.com/en/market/product/69266
For more technical info or questions, please send us a message.
