TheStrat TFC Monitor MT5
- Indicadores
- Robert Gerald Wood
- Versão: 1.5
- Atualizado: 23 novembro 2023
- Ativações: 10
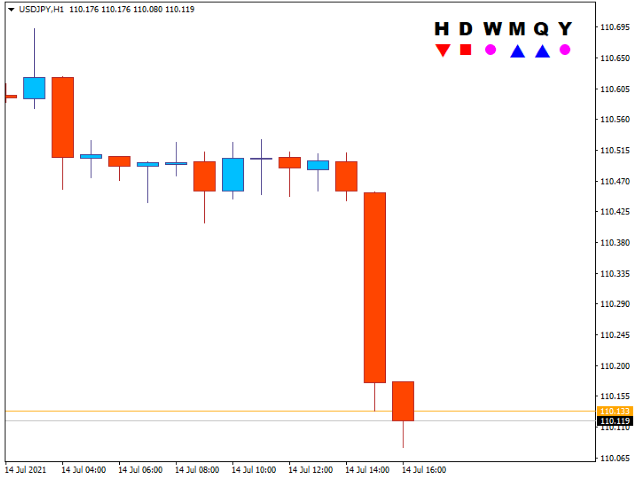
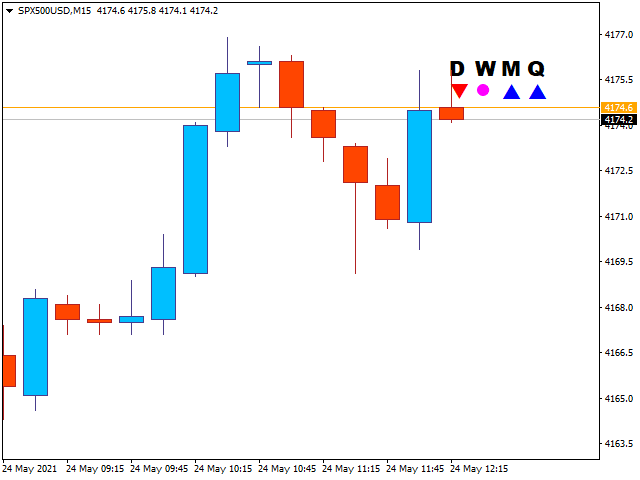
Ao negociar usando o The Strat , é importante ficar de olho em vários prazos.
Este indicador mostrará o estado Diário, Semanal, Mensal e Trimestral da vela atual para cada período de tempo.
- Um ícone de Círculo mostra que a vela nesse período de tempo é atualmente um Inside ou Type 1 na terminologia TheStrat. Uma vela Inside Day está consolidando a ação do preço e estamos procurando uma quebra do intervalo.
- Um ícone Triângulo, apontando para cima ou para baixo, é uma vela de tendência ou Tipo 2 na terminologia TheStrat. Uma vela de tendência pode ser de alta ou de baixa, indicando que ela saiu da faixa de velas anterior e agora está tendendo em uma direção.
- Um ícone quadrado é uma vela externa ou tipo 3 na terminologia Strat. Isso indica duas coisas, uma que o preço está indeciso sobre a direção nesse período de tempo, e provavelmente bastante instável, e dois, que em prazos mais baixos provavelmente há boas oportunidades para negociar reversões curtas. O quadrado terá uma cor de alta ou baixa para mostrar qual lado está ganhando no momento.
As cores usadas para cada ícone podem ser configuradas ao seu gosto, e o tamanho do texto e ícones também são configuráveis.
CONFIGURAÇÕES
Seleções de período de tempo
Mostrar por hora
Quando True, mostra o estado da vela por hora.
Mostrar diariamente
Quando True, mostra o estado diário da vela.
ShowWeekly
Quando True, mostra o estado da vela semanal.
Mostrar mensalmente
Quando True, mostra o estado da vela mensal.
Mostrar trimestralmente
Quando True, mostra o estado da vela trimestral.
ShowAnual
Quando True, mostra o estado anual da vela.
Formatação de Exibição
InsideFontColour
A cor a ser usada ao desenhar velas internas (Tipo 1).
BullishFontColor
A cor a ser usada ao desenhar tendências de alta (tipo 2) ou velas externas (tipo 3).
BearishFontColor
A cor a ser usada ao desenhar tendências de alta (tipo 2) ou velas externas (tipo 3).
HeaderFontName
A fonte a ser usada para cabeçalhos dos ícones de estado da vela.
Tamanho da fonte
O tamanho da fonte a ser usada para os títulos. Isso também controla o tamanho geral da exibição do indicador.

Great tool to see higher time frame confluence