Pi Cycle Top Indicator
- Indicadores
- Sergei Kopylov
- Versão: 1.1
- Atualizado: 15 maio 2021
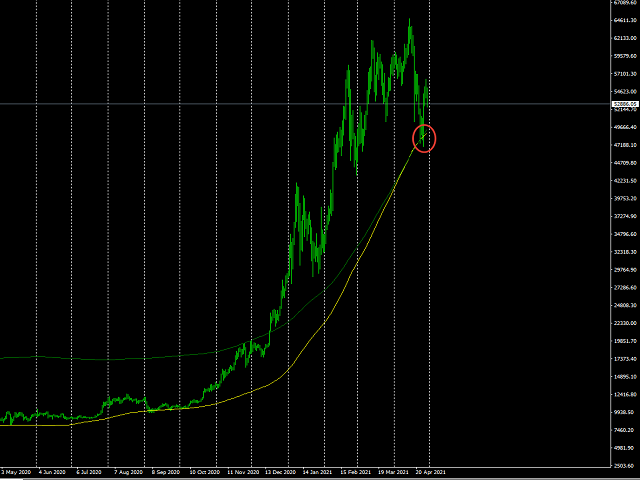
There is a very simple and surprisingly effective indicator called Pi Cycle, which starts to give the first warning. It is worth a look, so as not to miss the giant elephant in the living room!))
What is Pi Cycle?
Pi Cycle is a very simple indicator created by analyst Philip Swift . It takes into account two (DMA biased moving averages ):
- 350-day average x 2
- 111-day average
Both can be considered long-term indicators. The second one is obviously more sensitive to current market changes, since it takes into account a smaller range of dates.
The main argument in favor of this indicator is very clear: whenever the 111-day average crosses the 350-day average multiplied by 2. This is the signal of the peak of the bitcoin cycle.
This indicator is called the "Black Mark for Bitcoin".
Historical performance
In a cycle that peaked at the end of 2013, the Pi cycle very accurately predicted the end of the increase. And I did it twice. In April 2013, when Bitcoin hit its first major high, the aforementioned two moving averages crossed 5 days ahead of their $ 259 peak.
Previous peaks
In the entire history of statistics, the Pi indicator gave signals only twice: in 2013 and in 2017. In both cases, Bitcoin formed a top within five days of crossing
Features of this version
The indicator is initially designed only for Bitcoin and the daily chart.
But in this version, the multiplier and the divisor of the averages are displayed in the settings. This makes it possible to configure this indicator for other timeframes as well !


It is very useful but same concept to be develop for stocks and currency market and that too it should work on lower timeframe .