PZ Multi TDI
- Indicadores
- PZ TRADING SLU
- Versão: 2.2
- Atualizado: 20 maio 2021
- Ativações: 20
All-in-one trading powerhouse: trend, reversal, and exhaustion detection
This indicator is a personal implementation of the famous Traders Dynamic Index, which uses RSI, moving averages and volatility bands to find trends, reversals and price exhaustions. However, this particular implementation supports not only RSI, but many others. It is suitable for scalping, day trading, and swing trading and aims to provide a full picture of the current market conditions.
[ Installation Guide | Update Guide | Troubleshooting | FAQ | All Products ]
- It is a complex but very useful indicator
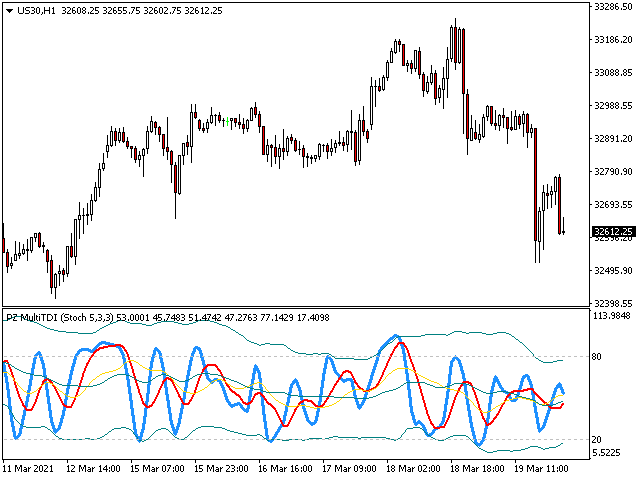
- Supports RSI, CCI, Stoch, AO, AC, Momentum, WPR, Demarker, RVI, ATR and ROC.
- Alerts on oversold/overbought levels
- Alerts on trend reversals
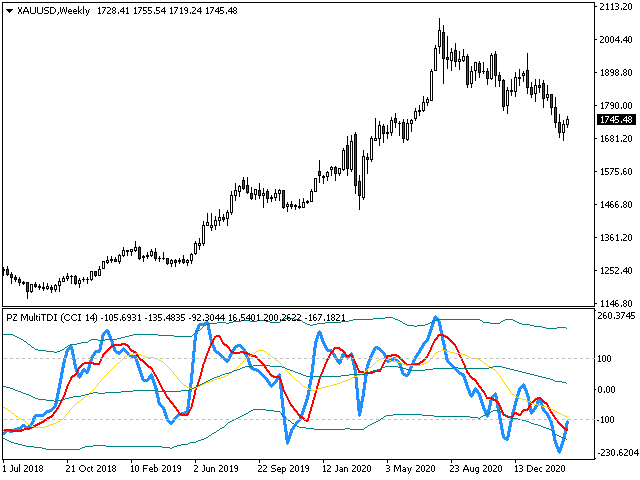
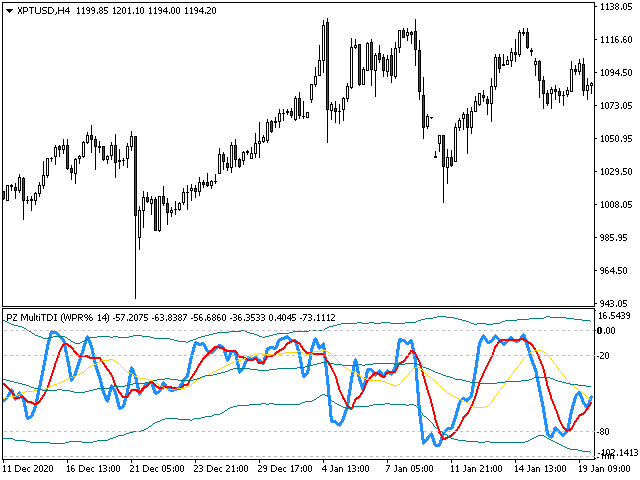
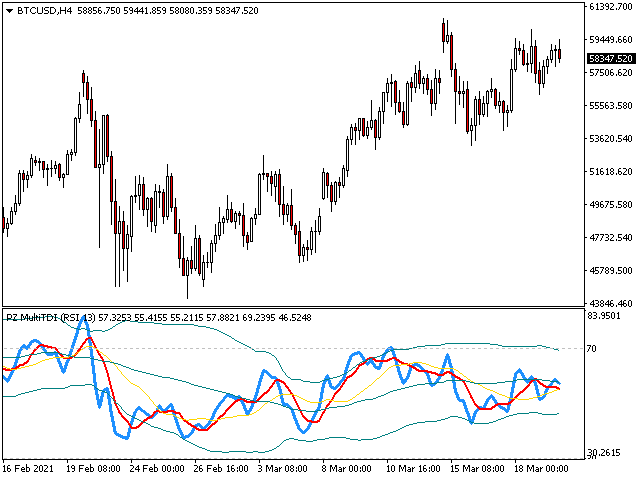
The components of the indicator are the following:
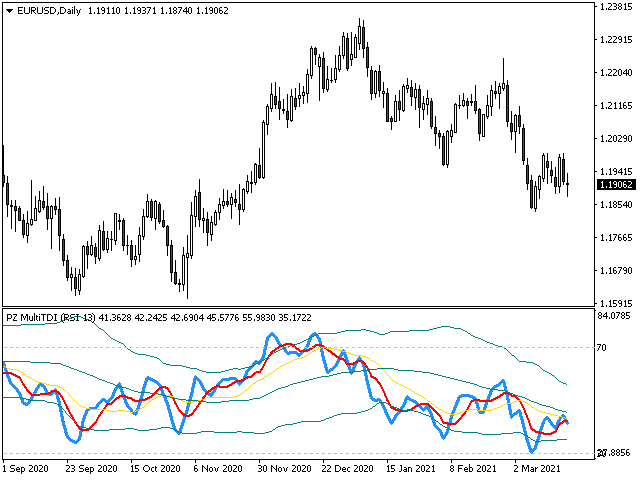
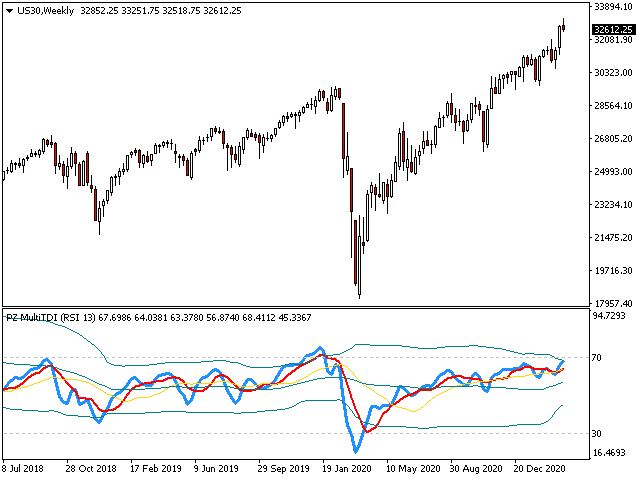
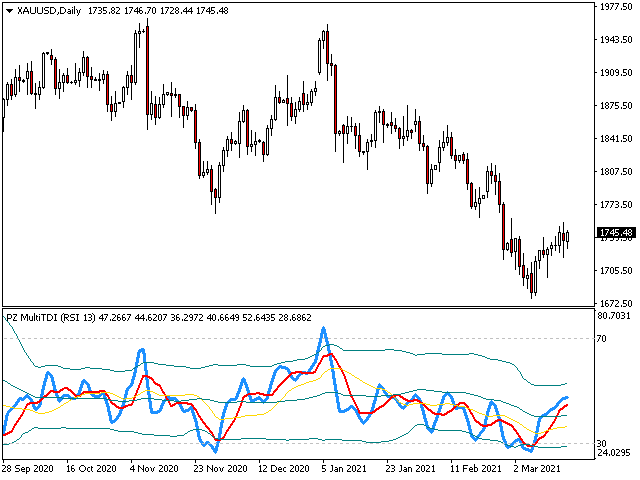
- The blue line is the main line
- The red line is the signal line
- The yellow line is the trend line
- The bands are relative oversold and overbought levels
- The oscillatorlevels are absolute oversold and overbought levels
For position trading
- Long if the blue line falls below the lower band
- Short if the blue line shoots above the upper band
- Confirm optional with the native oversold/overbought levels of the oscillator used
For scalping
- Long if the blue line crosses the red line upwards, after leaving the deviation bands
- Short if the blue line crosses the red line downwards, after leaving the deviation bands
For day trading
- Long if the blue line crosses the red line upwards and is above the yellow line
- Short if the blue line crosses the red line downwards and it below the yellow line
For swing trading
- Long if the blue is above both red and yellow lines, however only if all the lines are below the 50 level.
- Short if the blue line is below both red and yellow lines, however only if all the lines are above the 50 level.
Optionally, you can use higher timeframes to discard or confirm trades and get better timing.
Input Parameters
- Oscillator: Select the oscillator used as the main indicator
- Main Period: Averaging period used for the main indicator
- Signal Period: Averaging period used for the short-term trend
- Trend Period: Averagign period used for the long-term trend
- BB Period: Averaging period used to calculate the deviation bands
- BB Deviations: Deviations used for the deviation bands.
- Max History Bars: Maximum amount of past bars in the chart to evaluate
- RSI period
- CCI period
- Williams %R period
- Momentum period
- Stoch K
- Stoch D
- Stoch Slowing
- RVI period
- Demarker period
- Force Index period
- ATR Period
- Alert on OS/OB: Enable or disable alerts on oversold/overbought levels
- Alert on signals: Enable or disable alerts on short-term trend changes after OS/OV happens
- Custom alert: Custom alert text for this instance of the indicator
- Display alerts: Enable or disable visual alerts
- Mail alerts: Enable or disable email alerts
- Push alerts: Enable or disable push alerts
- Sound alerts: Enable or disable sound alerts
- Sound file: Sound to play on alert
Author
Arturo López Pérez, private investor and speculator, software engineer and founder of Point Zero Trading Solutions.







O usuário não deixou nenhum comentário para sua avaliação