Levels of Pivots
- Utilitários
- Nikolay Mitrofanov
- Versão: 1.1
- Atualizado: 16 abril 2021
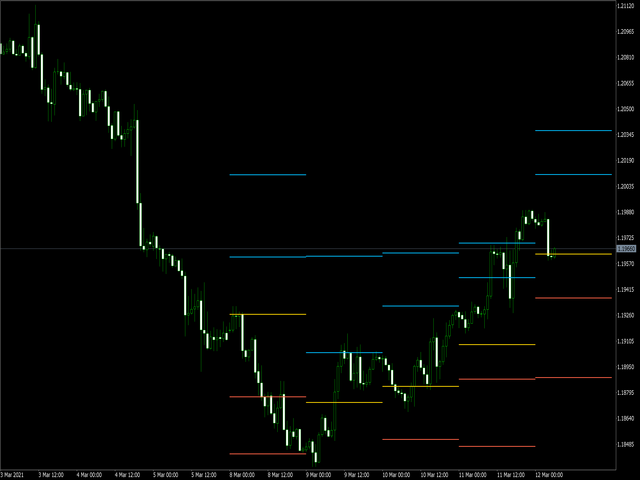
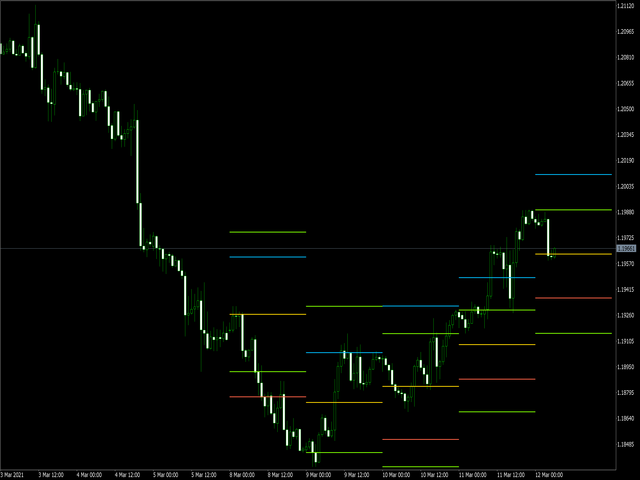
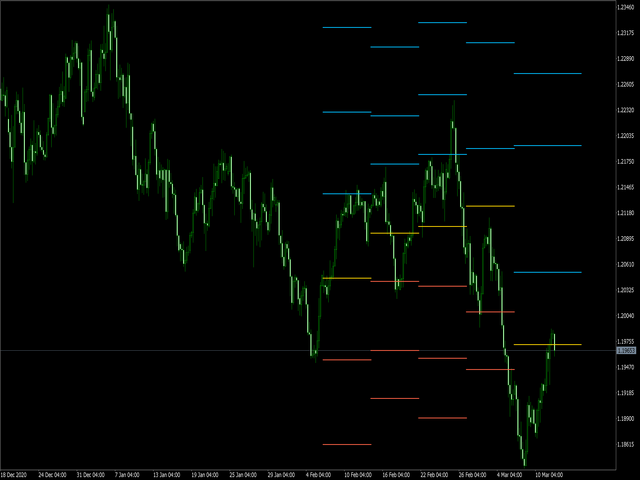
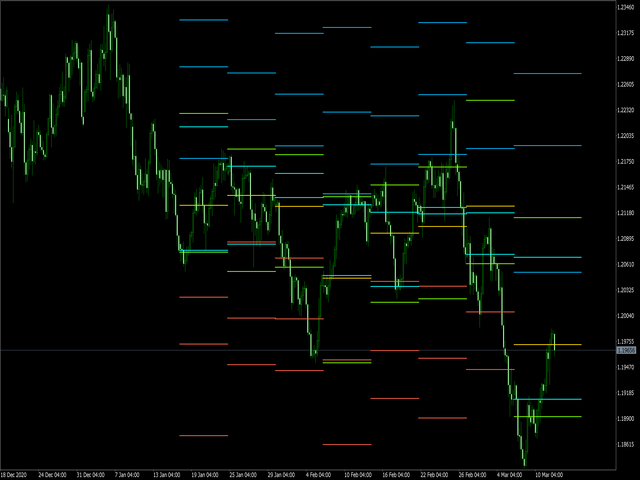
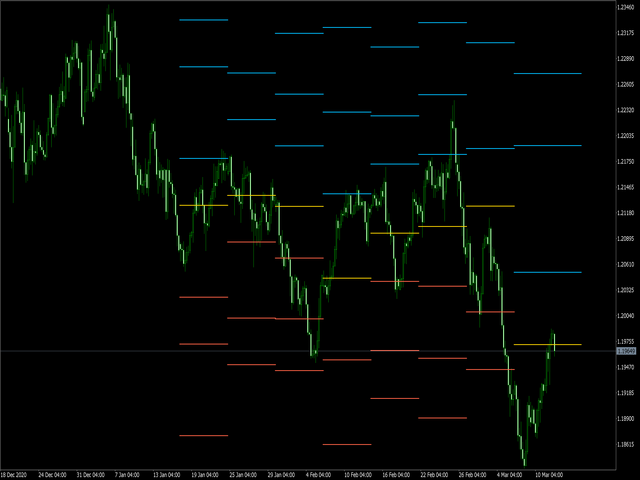
The utility draws reversal levels using the formulas for each of the selected number of candles:
Pivot = (high + close + low) / 3
R1 = (2 * Pivot) - low
S1 = (2 * Pivot) - high
R2 = Pivot + (R1 -S1)
R3 = high + (2 * (Pivot - low))
S2 = Pivot - (R1 - S1)
S3 = low - (2 * (high - Pivot))
H = high
L = low
U = if the candle is bullish, then close. Otherwise - open
D = if the candle is bullish, then open. Otherwise - close
On any timeframe.
After a new candle closes on the calculated timeframe, the levels of the last day are deleted.
That is, the chart always contains up-to-date data for the selected period.
It is possible to turn off levels. In addition to the main one - Pivot

