• Visão global
  • Comentários (2)
  • Discussão (5)
  • O que há de novo

VPO Profile MT5

5

Definition :

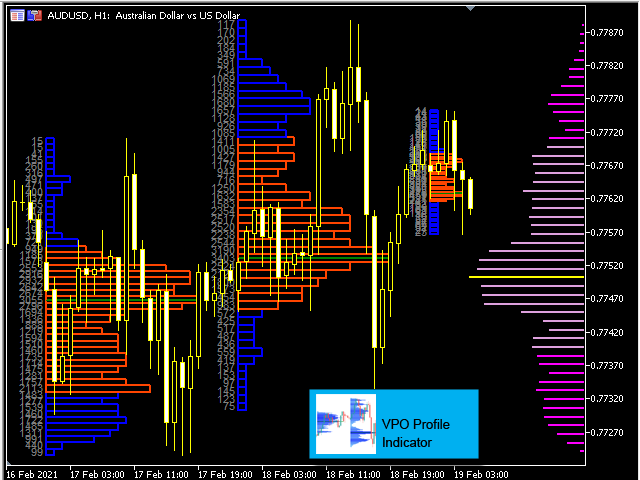
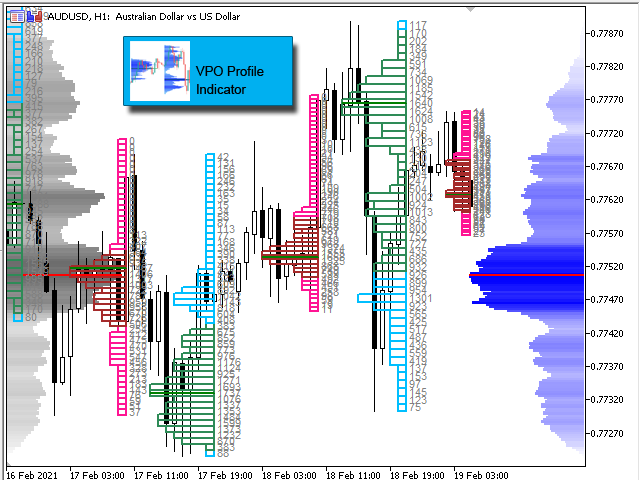
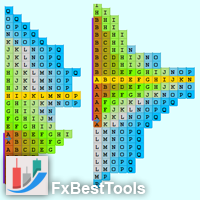
VPO is a Volume Price Opportunity. Instead of using bars or candles with an Open, High, Low, and Close price, each "bar" in a Market Profile is represented by horizontal bars against the price It is called Market Profile terminology.
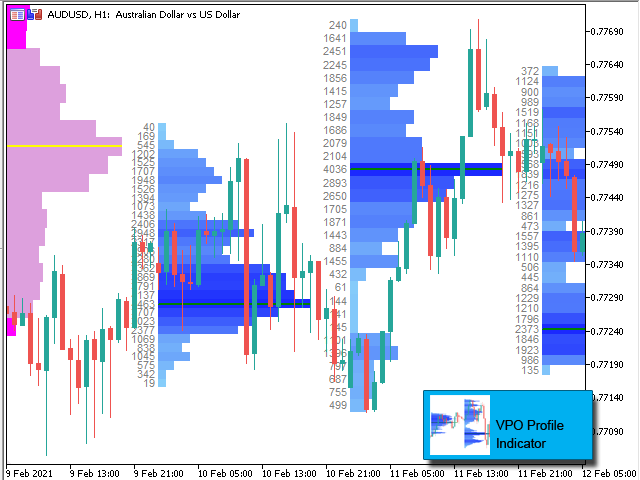
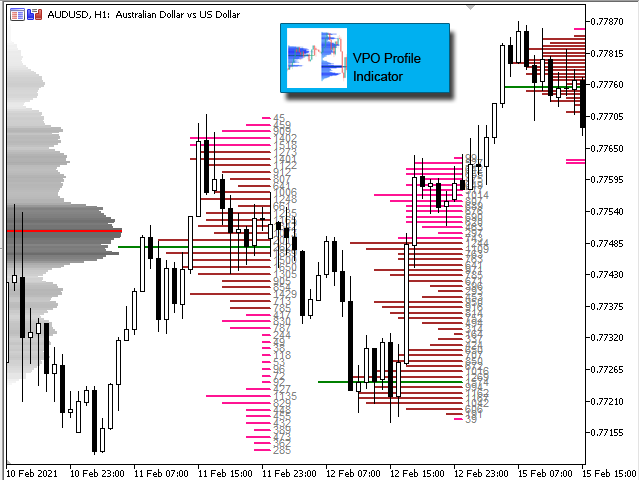
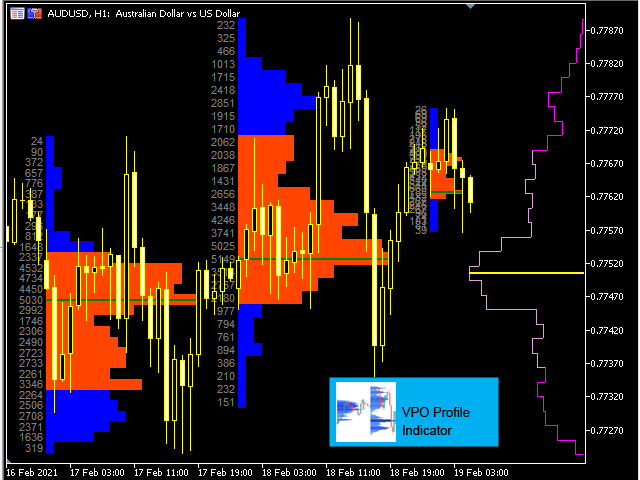
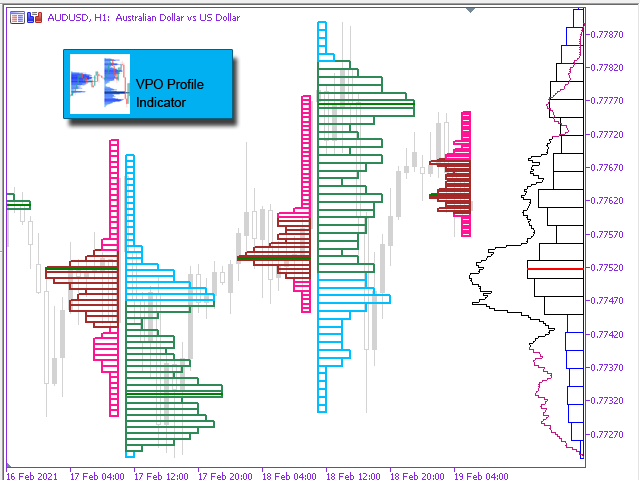
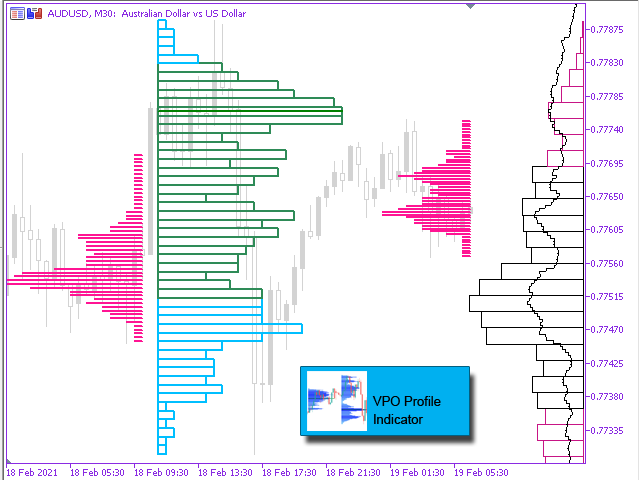
In other words volume-price-opportunity (VPO) profiles are histograms of how many volumes were traded at each price within the span of the profile.
By using a VPO chart, you are able to analyze the amount of trading activity, based on volume, for each price level the market traded at for any given time period. The VPO Profile Chart study allows you to clearly see the areas where the market is trading with the max volumes.

The indicator can help determine Support-Resistance levels.


Inputs :

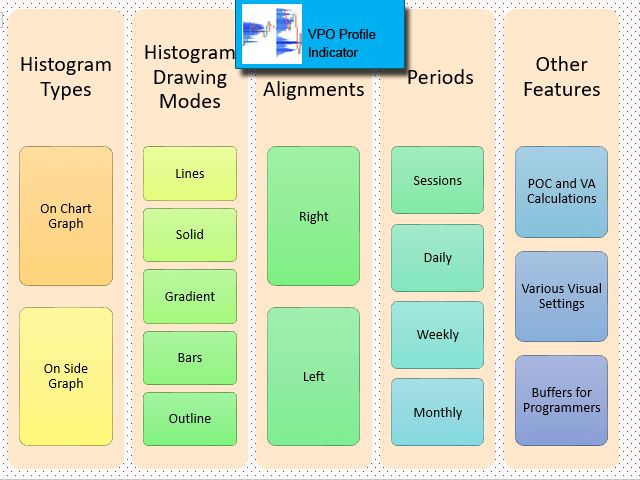
  • On Chart Profile Options
    • Enable/Disable
    • Volumes : Tick/Real Volumes
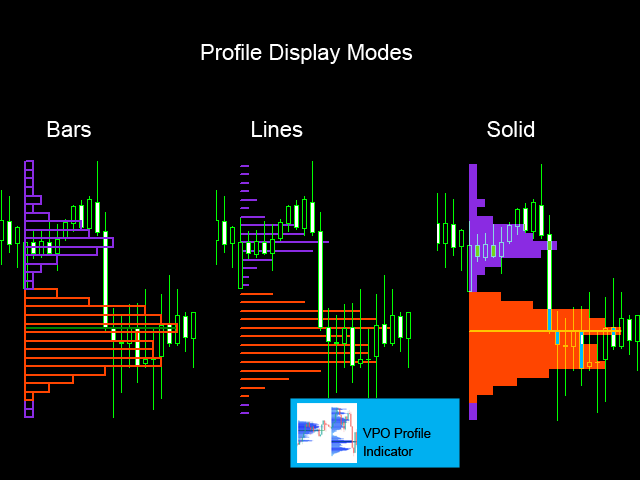
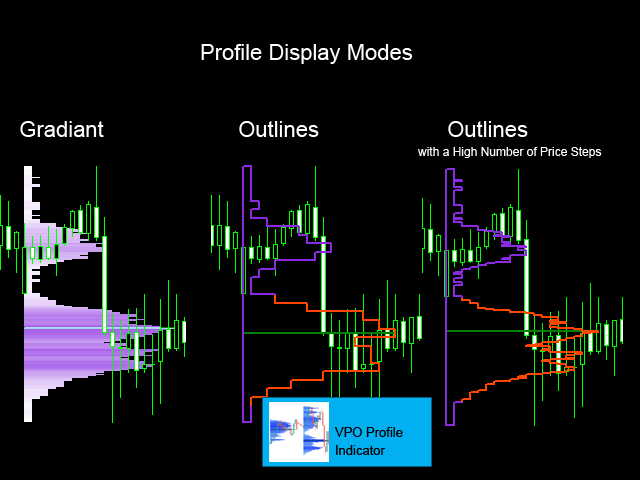
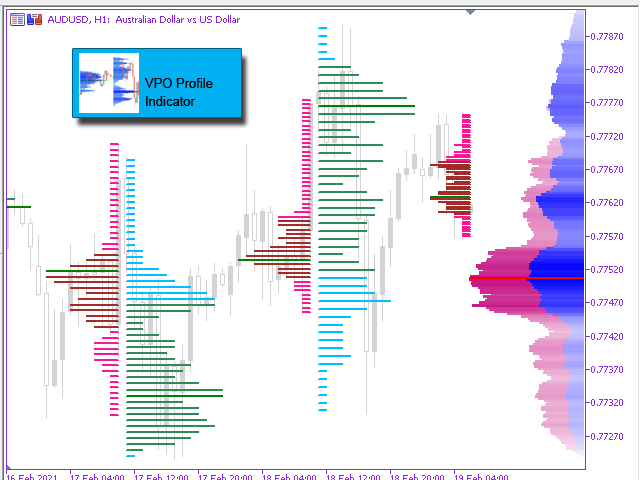
    • Profile Display Mode : Lines/Solid/Gradient/Bars/OutLine
    • Profile Alignment : Right/Left
    • Profile Periods : Session/Daily/Weekly/Monthly
    • Show Volume Text : Enable Text of Volumes
    • Number of Price Steps : Number of horizontal divisions of profile
    • VA Percentage : Percentage of Value Area
    • Number of Profiles (Sessions)
    • Session Start Time
    • Session End Time
  • On Side Profile Options
    • Enable/Disable
    • Volumes : Tick/Real Volumes
    • Profile Display Mode : Lines/Solid/Gradient/Bars/OutLine
    • Profile Alignment : Right/Left
    • Number of Days : Number of days included in profile calculation
    • Number of Price Steps : Number of horizontal divisions of profile
    • VA Percentage : Percentage of Value Area
    • Profile Size (% of Chart Width)
  • Visual Settings
    • On Chart Profile Color
    • On Chart Profile Back Color (for Gradient)
    • On Chart Profile Draw VA
    • On Chart Profile VA Color
    • On Chart Profile Draw POC
    • On Chart Profile POC Color
    • On Chart Profile POC Thickness
    • On Chart Profile Text Color
    • On Chart Profile Text Font Size
    • On Chart Profile Longitudinal Scale (%)
    • On Side Profile Color
    • On Side Profile Back Color (for Gradient)
    • On Side Profile Draw VA
    • On Side Profile VA Color
    • On Side Profile Draw POC
    • On Side Profile POC Color
    • On Side Profile POC Thickness

Buffers for programmers :

Manual of using buffers.


    Tips :

    • You can attach more than one indicator to a chart with different settings in these cases :
      • If you want multiple sessions on a day,
      • If you want both right and left on side histograms on a chart,
      • If you want 2 or more histograms overlapping each other.


    We are ready to help you for using the EA, Please don't hesitate to contact us.
    Visit our other useful utilities, Indicators and experts here.


    Comentários 2
    Florian Leonhard Schaal
    471
    Florian Leonhard Schaal 2023.07.16 11:35 
     

    Nice indicator, works with ticks on forex and real volume on others (didnt check yet). Recommended!

    CSG CSG
    1641
    CSG CSG 2024.01.26 15:59 
     

    Ein toller Indikator mit wertvollen Einstellungsmöglichkeiten. Funktioniert alles ohne Probleme. Leider schiebt sich die Darstellung öfter über andere Objekte, es wäre schön, wenn man das auch noch einstellen könnte. Dann gibts 5 Sterne ;-)

    Produtos recomendados
    Includes almost all the concepts related to Volume Profile: POC , Value Area , Developing POC , Anchored VWAP , Volume Delta ; since the “Total” in its name. It is fast in its calculations and simple to work with. Features: 1.    Selectable calculation timeframe to find most traded levels. 2.    Capable of calculating Volume Profile based on tick data 3.    Adjustable histogram bars by their count. 4.    Adjustable histogram bars by their height (price range). 5.    Showing Value Area (VA
    PivotWave
    Jeffrey Quiatchon
    Introducing PivotWave – your ultimate trading companion that redefines precision and market analysis. Designed with traders in mind, PivotWave is more than just an indicator; it’s a powerful tool that captures the pulse of the market, identifying key turning points and trends with pinpoint accuracy. PivotWave leverages advanced algorithms to provide clear visual signals for optimal entry and exit points, making it easier for traders to navigate volatile market conditions. Whether you are a begin
    A "Volume Profile" is an advanced charting indicator that displays total volume traded at every price level over a user specified time period. The main components of the volume profile are POC ( Point Of Control - the price level, at which the maximum number of contracts were executed during a selected period), VAH ( Value Area High - the highest price in the Value Area) and VAL ( Value Area Low - the lowest price in the Value Area). When we settled on the original indicator, we spent a lot of
    Was: $249  Now: $149   Market Profile defines a number of day types that can help the trader to determine market behaviour. A key feature is the Value Area, representing the range of price action where 70% of trading took place. Understanding the Value Area can give traders valuable insight into market direction and establish the higher odds trade. It is an excellent addition to any system you may be using. Inspired by Jim Dalton’s book “Mind Over Markets”, this indicator is designed to suit the
    Este indicador permite-lhe desfrutar os dois produtos mais populares para analisar volumes de ofertas e das negociações no mercado a um preço favorável: Actual Depth of Market Chart Actual Tick Footprint Volume Chart Este produto combina o poder de ambos os indicadores e é fornecido como um único arquivo. Venda Anti-crise. Hoje com menor preço. Anda logo! A funcionalidade do COMBO Actual Depth of Market e Tick Volume Chart é totalmente idêntica aos indicadores originais. Você vai aproveitar o po
    Este indicador é projetado para determinar o horário da maior atividade de negociação em um dia. Após esse cálculo, o indicador constrói os níveis de negociação mais significativos. A comparação desses níveis com a ação real do preço pode fornecer informações sobre a força e a direção das tendências do mercado. Características do indicador O prazo deve ser inferior a D1. Prazos recomendados: M15, M30 e H1. Os prazos acima de H1 podem fornecer uma imagem muito aproximada. E o uso de timeframes
    BoxChart MT5
    Evgeny Shevtsov
    5 (7)
    The market is unfair if only because 10% of participants manage 90% of funds. An ordinary trader has slim changes to stand against these "vultures". This problem can be solved. You just need to be among these 10%, learn to predict their intentions and move with them. Volume is the only preemptive factor that faultlessly works on any timeframe and symbol. First, the volume appears and is accumulated, and only then the price moves. The price moves from one volume to another. Areas of volume accumu
    Market profile was developed by Peter Steidlmayer in the second half of last century. This is a very effective tool if you understand the nature and usage. It's not like common tools like EMA, RSI, MACD or Bollinger Bands. It operates independently of price, not based on price but its core is volume. The volume is normal, as the instrument is sung everywhere. But the special thing here is that the Market Profile represents the volume at each price level. 1. Price Histogram The Price Histogram i
    Volume Profile V6
    Andrey Kolesnik
    4.5 (2)
    The volume profile indicator of the market + a S mart oscillator . It works on almost all instruments - currency pairs , stocks , futures , cryptocurrency , on real volumes and on tick ones . You can set both the automatic definition of the profile range , for example , for a week or a month , etc . , and set the range manually by moving the boundaries ( two vertical lines red and blue ) . It is shown as a histogram . The width of the histogram at this level means , conditionally , the number of
    VolumeDeltaBars
    Stanislav Korotky
    This indicator is a conventional analytical tool for tick volumes changes. It calculates tick volumes for buys and sells separately, and their delta on every bar, and displays volumes by price clusters (cells) within a specified bar (usually the latest one). The algorithm used internally is the same as in the indicator VolumeDeltaMT5 , but results are shown as cumulative volume delta bars (candlesticks). Analogous indicator for MetaTrader 4 exists - CumulativeDeltaBars . This is a limited substi
    This is a multi timeframe version of the  Supply and Demand indicator . It allows you to analyze a chart using the law of supply and demand on three different timeframes at a time. You will see zones of sales and purchases and determine the most profitable points to open positions. The indicator is based on the principle of market fractality. Supply and demand zones show places where a strong buyer or seller has made the price reverse and change its direction. The indicator has several types of
    The balance of supply and demand is a simple and effective market analysis method. The supply and demand diagram can show you in advance, even before the trend reversal, where the supply ends and the demand is already emerging, where the demand ends and the supply is emerging, while substantially increasing the probability of making a deal in the right direction and with a high profit factor. Indicator signals The indicator uses the price/volume values to generate signals: ED – excess demand. E
    UPD1 Profile Levels MT5
    Vitaliy Kuznetsov
    5 (3)
    O indicador localiza os níveis de volume máximo e mínimo de preços (perfil do mercado) no histograma de trabalho para o número especificado de barras.   Perfil composto. A altura do histograma é totalmente automática e se adapta a qualquer instrumento e período de tempo. O algoritmo do autor é usado e não repete análogos conhecidos. A altura dos dois histogramas é aproximadamente igual à altura média da vela. Um alerta inteligente irá ajudá-lo a informar sobre o preço relativo ao nível de volume
    Blahtech Supply Demand MT5
    Blahtech Limited
    4.54 (13)
    Was: $299  Now: $149  Supply Demand uses previous price action to identify potential imbalances between buyers and sellers. The key is to identify the better odds zones, not just the untouched ones. Blahtech Supply Demand indicator delivers functionality previously unavailable on any trading platform. This 4-in-1 indicator not only highlights the higher probability zones using a multi-criteria strength engine, but also combines it with multi-timeframe trend analysis, previously confirmed swings
    Mt5 Market Profile
    Mcblastus Gicharu Ndiba
    Market Profile Introducing the Market Profile MetaTrader Indicator—your gateway to mastering market dynamics with precision and insight. This powerful tool delivers a classic Market Profile analysis, revealing price density over time and highlighting crucial levels, including the value area and control value for any trading session.  Compatible with timeframes from M1 to D1, it adapts to daily, weekly, monthly, or even intraday sessions, offering you unmatched flexibility. Lower timeframes prov
    Market Profile Heat indicator  — is a classic Market Profile implementation that can show the price density over time, outlining the most important price levels, value area, and control value of a given trading session. This indicator can be attached to timeframes between M1 and D1 and will show the Market Profile for daily, weekly, monthly, or even intraday sessions. Lower timeframes offer higher precision. Higher timeframes are recommended for better visibility. It is also possible to use a fr
    To get access to MT4 version please click here . This is the exact conversion from TradingView: " WaveTrend" by LazyBear. This is a light-load processing and non-repaint indicator. All input options are available. Buffers are available for processing in EAs. You can message in private chat for further changes you need. The filling area option is omitted to fit into MT5 graphics.
    40% off. Original price: $50 ATR Scanner Pro is a multi symbol multi timeframe volatility scanner that monitors and analyzes Average True Range indicator value in up to 28 symbols and 9 timeframes in 3 modes : ATR value:   As a volatility dashboard it shows the ATR indicator value in all pairs and timeframes and signals when the ATR value reaches a maximum or minimum in a given duration. Short term ATR/Long term ATR ratio:  It shows ratio of 2 ATRs with different periods. It's useful in detect
    Novo Indicador Combinado - 3 em 1 Está à procura de ferramentas de negociação que possam melhorar sua análise de mercado e suas estratégias de investimento? Combinamos três dos nossos melhores indicadores em uma solução poderosa e conveniente, permitindo que você obtenha o máximo valor para sua negociação. 1. Indicador de Bloco de Ordens (anteriormente vendido por 32,90$) O Indicador de Bloco de Ordens é uma ferramenta essencial para identificar áreas de forte interesse institucional dentro do m
    First and foremost, the Insight Flow Indicator stands out as a Non-Repainting, Non-Redrawing, and Non-Lagging tool. This makes it a prime choice for both manual and algorithmic trading, ensuring reliable and consistent signals. User Manual: Settings, Inputs, and Strategy The Insight Flow Indicator leverages price action, strength, and momentum to provide a clear edge in the market. Equipped with advanced filters, it eliminates noise and false signals, enhancing trading potential. By using multip
    VolumeProfile MT5
    Robert Hess
    4.14 (7)
    Description: The Volume Profile displays detailed informations of historical trading activities at certain price levels (Market Profile). Locate the areas with the best prices in the market and get an advantage over other market participants. Features: Customizable Market Profile Shows the "fair" Value Area with 70% of all Volume Shows critical low volume zones Shows VPOC, VAL and VAH Points integrated resource management to reduce the load while working with multiple charts Works on all timefr
    This indicator provides an original mix of WPR, VSA, and volume delta. It shows ratio of buy/sell volumes scaled on 100% range based on total volume change for a selected period. The convetional VSA (Volume Spread Analysis) studies interconnections of price action and volume change in absolute values, whereas WPR (Williams Percent Range) offers a convenient approach of price moves normalization into the fixed percentage metric: 0 - 100%. Hence overbough and oversold states are easily spotted. N
    KT Volume Profile MT5
    KEENBASE SOFTWARE SOLUTIONS
    O KT Volume Profile exibe os dados de acumulação de volume como um histograma no eixo Y, permitindo visualizar a atividade de negociação ao longo de determinados períodos e níveis de preço. Ponto de Controle (POC) no Perfil de Volume O POC representa o nível de preço com o maior volume negociado dentro do histograma do perfil de volume. Geralmente, é utilizado como suporte/resistência ou como um nível-chave onde o mercado pode fazer um reteste antes de seguir em uma direção específica. Recurso
    Scalper Pivot
    Yosi Malatta Madsu
    Scalper Pivot detects respectable small reversal areas that can be used to mark repeatable opportunity windows. For M1 timeframe. Setup/inputs: First, set one pip on price, e.g. EURUSD to 0.0001, USDJPY to 0.01, or XAUUSD to 0.1. Or select AUTO for autodetect common symbols. Set minimum and maximum range on pips, if you want scalp between 10 to 20 pips then set it to 10 and 20 respectively. Set detection window to any candle count you want. Set it too low or too high would be less accurate.
    O indicador cria cotações atuais, que podem ser comparadas com as históricas e, com base nisso, fazer uma previsão do movimento dos preços. O indicador possui um campo de texto para navegação rápida até a data desejada. Opções: Símbolo - seleção do símbolo que o indicador exibirá; SymbolPeriod - seleção do período do qual o indicador coletará dados; IndicatorColor - cor do indicador; HorisontalShift - deslocamento das cotações desenhadas pelo indicador pelo número especificado de barras; I
    AVISO IMPORTANTE – LICENÇA E ATIVAÇÃO NECESSÁRIAS Instruções de Ativação: Após concluir sua compra, entre em contato conosco imediatamente para receber sua chave de licença, senha ou detalhes de ativação. Sem esses itens, o software não funcionará. Estamos aqui para garantir um processo de ativação tranquilo e ajudá-lo com qualquer dúvida. Personalização Multilíngue Para melhorar sua experiência de trading, oferecemos personalização completa do software em vários idiomas. Nossa equipe po
    The   Supply and Demand Zones indicator   is one of the best tools we have ever made. This great tool automatically draws supply and demand zones, the best places for opening and closing positions. It has many advanced features such as multi timeframe zones support, displaying the width of zones, alert notifications for retouched zones, and much more. Because of market fractality, this indicator can be used for any kind of trading. Whether you are a positional, swing, or intraday trader does no
    VR Grid Mt5
    Vladimir Pastushak
    3.43 (7)
    O indicador VR Grid foi projetado para criar uma grade gráfica com configurações definidas pelo usuário. Ao contrário da grade padrão , a VR Grid é usada para construir níveis circulares . Dependendo da escolha do usuário, o passo entre os níveis de rodada pode ser arbitrário. Além disso, ao contrário de outros indicadores e utilitários, o VR Grid mantém a posição da rede mesmo quando o período de tempo muda ou o terminal é reiniciado. Configurações, arquivos de configuração, versões demo, instr
    FREE
    A singularidade deste indicador reside no algoritmo de contabilidade de volume: a acumulação ocorre diretamente para o período selecionado sem referência ao início do dia. As últimas barras podem ser excluídas do cálculo, então os dados atuais terão menos influência sobre os níveis significativos (volumes) formados anteriormente. Para um cálculo mais preciso, os dados do gráfico M1 são usados por padrão. A etapa de distribuição dos volumes de preços é regulamentada. Por padrão, a borda direita d
    Before installing the HeatMap indicator make sure you are using a broker that gives you access to the Depth of market (DOM) !! This indicator creates a heatmap on your chart allowing you to see the buy or sell limit orders easily and in real time. You have the possibility to change the setting and the colors of the HeatMap in order to adapt to all markets and all charts. Here is an example of a setting you can use with the NASDAQ100 on the AMPGlobal broker :  https://www.youtube.com/watch?v=x0Y
    Os compradores deste produto também adquirem
    Algo Pumping
    Ihor Otkydach
    5 (7)
    PUMPING STATION – Sua estratégia pessoal “tudo incluído” Apresentamos o PUMPING STATION — um indicador revolucionário para Forex que vai transformar sua maneira de operar em uma experiência empolgante e eficaz. Este não é apenas um assistente, mas sim um sistema de trading completo com algoritmos poderosos que vão te ajudar a operar de forma mais estável. Ao adquirir este produto, você recebe GRATUITAMENTE: Arquivos de configuração exclusivos: para uma configuração automática e desempenho máxim
    Golden Trend Indicator MT5
    Noha Mohamed Fathy Younes Badr
    4.89 (18)
    Golden Trend indicator  is The best indicator for predicting trend movement this indicator never lags and never repaints and never back paints    and give  arrow buy and sell    before the candle appear  and it will help you and  will make your trading decisions clearer its work on all currencies and  gold and crypto and all time frame This unique  indicator uses very secret algorithms to catch the  trends, so you can trade using this indicator and see the trend clear on charts  manual guide and
    FX Volume MT5
    Daniel Stein
    4.82 (17)
    FX Volume: Vivencie o Verdadeiro Sentimento de Mercado sob a Perspectiva de um Corretor Visão Geral Rápida Quer aprimorar sua abordagem de trading? FX Volume fornece insights em tempo real sobre como traders de varejo e corretores estão posicionados—bem antes de relatórios atrasados como o COT. Seja para buscar ganhos consistentes ou simplesmente ter uma vantagem mais clara no mercado, FX Volume ajuda você a detectar grandes desequilíbrios, confirmar rompimentos e aperfeiçoar sua gestão de ris
    Grabber System MT5
    Ihor Otkydach
    5 (5)
    Apresento a você um excelente indicador técnico: Grabber, que funciona como uma estratégia de trading “tudo incluído”, pronta para usar. Em um único código estão integradas ferramentas poderosas de análise técnica de mercado, sinais de entrada (setas), funções de alertas e notificações push. Cada comprador deste indicador também recebe gratuitamente: Utilitário Grabber: ferramenta para gerenciamento automático de ordens abertas Vídeo tutorial passo a passo: como instalar, configurar e operar com
    Quantum TrendPulse
    Bogdan Ion Puscasu
    5 (13)
    Apresentando   Quantum TrendPulse   , a ferramenta de negociação definitiva que combina o poder do   SuperTrend   ,   RSI   e   Stochastic   em um indicador abrangente para maximizar seu potencial de negociação. Projetado para traders que buscam precisão e eficiência, este indicador ajuda você a identificar tendências de mercado, mudanças de momentum e pontos de entrada e saída ideais com confiança. Principais características: Integração SuperTrend:   siga facilmente a tendência predominante do
    TPSproTREND PrO MT5
    Roman Podpora
    4.72 (18)
    VERSION MT4        —        ИНСТРУКЦИЯ RUS           —        INSTRUCTIONS  ENG Principais funções: Sinais de entrada precisos SEM RENDERIZAÇÃO! Se aparecer um sinal, ele permanece relevante! Esta é uma diferença importante em relação aos indicadores de redesenho, que podem fornecer um sinal e depois alterá-lo, o que pode levar à perda de fundos depositados. Agora você pode entrar no mercado com maior probabilidade e precisão. Também existe a função de colorir as velas após o aparecimento da set
    Matrix Arrow Indicator MT5
    Juvenille Emperor Limited
    5 (13)
    O   Matrix Arrow Indicator MT5   é uma tendência única 10 em 1 seguindo um indicador multi-timeframe   100% sem repintura   que pode ser usado em todos os símbolos/instrumentos:   forex ,   commodities ,   criptomoedas ,   índices ,   ações .  O  Matrix Arrow Indicator MT5  determinará a tendência atual em seus estágios iniciais, reunindo informações e dados de até 10 indicadores padrão, que são: Índice de movimento direcional médio (ADX) Índice de canal de commodities (CCI) Velas clássicas de
    TPSpro RFI Levels MT5
    Roman Podpora
    4.55 (20)
    Zonas de reversão / Volumes de pico / Zonas ativas de um grande player =       SISTEMA TS TPSPRO INSTRUÇÕES RUS       /       INSTRUÇÕES       ENG       /           Versão MT4        Cada comprador deste indicador recebe adicionalmente GRATUITAMENTE: 6 meses de acesso aos sinais de negociação do serviço RFI SIGNALS - pontos de entrada prontos de acordo com o algoritmo TPSproSYSTEM. Materiais de treinamento com atualizações regulares - mergulhe na estratégia e aumente seu nível profissional. Su
    Este é sem dúvida o indicador de reconhecimento automático de formação de preço harmônico mais completo que você pode encontrar para a MetaTrader Platform. Ele detecta 19 padrões diferentes, leva as projeções de Fibonacci tão a sério quanto você, exibe a Zona de Reversão Potencial (PRZ) e encontra níveis adequados de stop loss e take-profit. [ Guia de instalação | Guia de atualização | Solução de problemas | FAQ | Todos os produtos ] Detecta 19 formações harmônicas de preços diferentes Traça
    MTF Supply Demand Zones MT5
    Georgios Kalomoiropoulos
    5 (1)
    Próxima geração de zonas automatizadas de oferta e demanda. Algoritmo novo e inovador que funciona em qualquer gráfico. Todas as zonas estão sendo criadas dinamicamente de acordo com a ação do preço do mercado. DOIS TIPOS DE ALERTAS --> 1) QUANDO O PREÇO ATINGE UMA ZONA 2) QUANDO UMA NOVA ZONA É FORMADA Você não recebe mais um indicador inútil. Você obtém uma estratégia de negociação completa com resultados comprovados.     Novas características:     Alertas quando o preço atinge a zona d
    O Oscilador de Índice de Precisão (Pi-Osc) de Roger Medcalf da Precision Trading Systems A Versão 2 foi cuidadosamente reconfigurada para carregar rapidamente em seu gráfico, e algumas outras melhorias técnicas foram incorporadas para aprimorar a experiência. O Pi-Osc foi criado para fornecer sinais precisos de temporização de negociações projetados para encontrar pontos de exaustão extremos, os pontos para os quais os mercados são forçados a ir apenas para tirar as ordens de todos. Este pro
    The   Time_Price_SQ9_Degree   indicator is based on the 9 Gann square. Using this indicator, you can identify strong time and price zones. The indicator displays the levels as a degree value. The degrees can be set in the settings. After launching, the MENU button appears. If it is highlighted, it can be moved to any point on the graph, and after double-clicking on it, it stops being highlighted and menu buttons appear. To hide the menu, just double-click on the button, it will become highlight
    Indicador único que implementa uma abordagem profissional e quantitativa para significar negociação de reversão. Ele capitaliza o fato de que o preço desvia e retorna à média de maneira previsível e mensurável, o que permite regras claras de entrada e saída que superam amplamente as estratégias de negociação não quantitativas. [ Installation Guide | Update Guide | Troubleshooting | FAQ | All Products ] Sinais de negociação claros Incrivelmente fácil de negociar Cores e tamanhos personalizáveis
    Cansado de traçar linhas de suporte e resistência? A Resistência de suporte é um indicador de período múltiplo que detecta e plota automaticamente linhas de suporte e resistência no gráfico com um toque muito interessante: conforme os níveis de preços são testados ao longo do tempo e sua importância aumenta, as linhas se tornam mais espessas e mais escuras. [ Guia de instalação | Guia de atualização | Solução de problemas | FAQ | Todos os produtos ] Melhore sua análise técnica da noite para o d
    Legend mt5
    Vladyslava Shaviernieva
    This is an indicator that includes the best basic forex indicators , without redrawing. Based on this data, a sell or buy signal is generated. It does not disappear anywhere after the signal, which gives us the opportunity to see the results on the history. It can be used on any currency pair, crypto, metals, stocks It is best used on an hourly chart, but other periods are also acceptable. The best results for the period H1,H4,daily If customers have any questions, I will answer them and af
    DESCRIÇÃO ICSM (Impulse-Correction SCOB Mapper) é o indicador que analisa o movimento do preço e identifica impulsos válidos, correções e SCOBs (Single Candle Order Block). É uma ferramenta poderosa que pode ser usada com qualquer tipo de análise técnica porque é flexível, informativa, fácil de usar e melhora substancialmente a consciência do trader sobre as zonas de interesse mais líquidas. CONFIGURAÇÕES Geral | Visuais Tema de cor — define o tema de cor do ICSM. SCOB | Visuais Mostrar S
    Advanced Supply Demand MT5
    Bernhard Schweigert
    4.5 (14)
    Atualmente com 33% de desconto! A melhor solução para qualquer Trader Novato ou especialista! Este indicador é uma ferramenta de negociação exclusiva, de alta qualidade e acessível porque incorporamos uma série de recursos proprietários e uma nova fórmula. Com esta atualização, você poderá mostrar fusos horários duplos. Você não só será capaz de mostrar um TF mais alto, mas também mostrar ambos, o TF do gráfico, MAIS o TF mais alto: MOSTRANDO ZONAS ANINHADAS. Todos os traders de Oferta e Demanda
    Este painel mostra os últimos   padrões harmónicos   disponíveis para os símbolos seleccionados, pelo que poupará tempo e será mais eficiente /   versão MT4 . Indicador gratuito:   Basic Harmonic Pattern Colunas do indicador Symbol :   aparecem os símbolos seleccionados Trend :   de alta ou de baixa Pattern :   tipo de padrão (gartley, borboleta, morcego, caranguejo, tubarão, cifra ou ABCD) Entry :   preço de entrada SL:   preço de paragem de perda TP1:   preço do 1º take profit TP2:   preço
    KT Candlestick Patterns MT5
    KEENBASE SOFTWARE SOLUTIONS
    KT Candlestick Patterns identifica e marca em tempo real os 24 padrões de velas japonesas mais confiáveis. Desde o século XVIII, os traders japoneses utilizam esses padrões para prever a direção do preço. É verdade que nem todos os padrões de velas são igualmente confiáveis. No entanto, quando combinados com técnicas como Suporte e Resistência, oferecem uma leitura precisa da situação atual do mercado. Este indicador inclui muitos dos padrões discutidos no livro de Steve Nison - "Japanese Cand
    FxaccurateLS
    Shiv Raj Kumawat
    WHY IS OUR FXACCCURATE LS MT5 THE PROFITABLE ? PROTECT YOUR CAPITAL WITH RISK MANAGEMENT Gives entry, stop and target levels from time to time. It finds Trading opportunities by analyzing what the price is doing during established trends. POWERFUL INDICATOR FOR A RELIABLE STRATEGIES We have made these indicators with a lot of years of hard work. It is made at a very advanced level. Established trends provide dozens of trading opportunities, but most trend indicators completely ignore them! The
    TPA True Price Action indicator reveals the true price action of the market makers through 100% non-repainting signals strictly at the close of a candle! TPA shows entries and re-entries, every time the bulls are definitely stronger than the bears and vice versa. Not to confuse with red/green candles. The shift of power gets confirmed at the earliest stage and is ONE exit strategy of several. There are available now two free parts of the TPA User Guide for our customers. The first "The Basics"
    MetaBands M5
    Vahidreza Heidar Gholami
    4.5 (2)
    MetaBands utiliza algoritmos poderosos e únicos para desenhar canais e detectar tendências, a fim de fornecer aos traders pontos potenciais para entrar e sair de negociações. É um indicador de canal mais um indicador de tendência poderoso. Inclui diferentes tipos de canais que podem ser mesclados para criar novos canais simplesmente usando os parâmetros de entrada. O MetaBands usa todos os tipos de alertas para notificar os usuários sobre eventos de mercado. Recursos Suporta a maioria dos algori
    MT4 Version SMT Divergences MT5 SMT Divergences is one of the most innovative indicators in the market. It offers the possibility of analyzing price divergences between 2 pairs. These divergences highlight and help to foresee what banks and institutions are planning to do. SMT divergences also provides you with a kill zones indicator and the possibility of filtering divergences occurring during these kill zones.  This indicator is specially powerful if applied in 2 highly correlated pairs. A pri
    Primeiramente, vale a pena enfatizar que este indicador de trading não repinta, não redesenha e não tem atrasos, o que o torna ideal tanto para trading manual quanto algorítmico. Manual do usuário, predefinições e suporte online incluídos. O AI Trend Pro Max é um sistema de trading sofisticado, tudo-em-um, projetado para traders que buscam precisão, poder e simplicidade. Baseado em anos de desenvolvimento através de indicadores anteriores, e esta é a versão mais avançada até agora — equipada com
    Easy Breakout MT5
    Mohamed Hassan
    4.6 (5)
    After your purchase, feel free to contact me for more details on how to receive a bonus indicator called VFI, which pairs perfectly with Easy Breakout for enhanced confluence!     Easy Breakout MT5   is a powerful price action trading system built on one of the most popular and widely trusted strategies among traders: the   Breakout strategy ! This indicator delivers crystal-clear Buy and Sell signals based on breakouts from key support and resistance zones. Unlike typical breakout indicators
    Este é um indicador para MT5 que fornece sinais precisos para entrar em uma negociação sem redesenhar. Ele pode ser aplicado a qualquer ativo financeiro: forex, criptomoedas, metais, ações, índices. Ele fornecerá estimativas bastante precisas e informará quando é melhor abrir e fechar um negócio. Assista o vídeo (6:22) com um exemplo de processamento de apenas um sinal que compensou o indicador! A maioria dos traders melhora seus resultados de negociação durante a primeira semana de negociação c
    Volume by Price MT5
    Brian Collard
    3.25 (4)
    Volume Profile, Footprint and Market Profile TPO (Time Price Opportunity). Volume and TPO histogram bar and line charts. Volume Footprint charts. TPO letter and block marker collapsed and split structure charts. Static, dynamic and flexible range segmentation and compositing methods with relative and absolute visualizations. Session hours filtering and segment concatenation with Market Watch and custom user specifications. Graphical layering, positioning and styling options to suit the user's a
    Gartley Hunter Multi
    Siarhei Vashchylka
    5 (9)
    Gartley Hunter Multi - An indicator for searching for harmonic patterns simultaneously on dozens of trading instruments and on all possible timeframes. Manual (Be sure to read before purchasing) | Version for MT4 Advantages 1. Patterns: Gartley, Butterfly, Shark, Crab. Bat, Alternate Bat, Deep Crab, Cypher 2. Simultaneous search for patterns on dozens of trading instruments and on all possible timeframes 3. Search for patterns of all possible sizes. From the smallest to the largest 4. All fou
    Trend Hunter MT5
    Andrey Tatarinov
    5 (2)
    Trend Hunter é um indicador de tendência para trabalhar nos mercados Forex, criptomoeda e CFD. Uma característica especial do indicador é que ele segue a tendência com confiança, sem alterar o sinal quando o preço ultrapassa ligeiramente a linha de tendência. O indicador não é redesenhado; um sinal para entrar no mercado aparece após o fechamento da barra. Ao avançar ao longo de uma tendência, o indicador mostra pontos de entrada adicionais na direção da tendência. Com base nesses sinais, você
    CONTACT US  after purchase to get the Indicator Manual. Download Now!  Offer valid only for next 10 Buyers.  Price   will   increase  gradually !  Download the  Metatrader 4 Version Read the product description carefully before purchasing the product.  Due to regulatory restrictions, our service is unavailable in certain countries such as India, Pakistan, and Bangladesh. Disclaimer: • Our products are available only on mql5.com. • We never contact anyone or sell our products privately. • We d
    Mais do autor
    Smart Copy Local MT4
    Kyra Nickaline Watson-gordon
    5 (7)
    Smart Copy is an Easy-to-Use EA that supports Multi Copying Metatrader4 and Metatrader5 and Local/Remote Copying. (Remote Version is coming soon) Free version is available on Smart Copy Local Free MT4 Specifications :     Real Time, Multi Terminal - Multi Account - MT4/MT5 trade copying     Copy from netting to hedge and hedge to netting is supported.     Fast and instant copy     All settings are input visually.     Easy modifying symbol names, prefix, suffix     Enable/Disable copying s
    Smart Copy Local MT5
    Kyra Nickaline Watson-gordon
    5 (4)
    Smart Copy is an Easy-to-Use EA that supports Multi Copying Metatrader4 and Metatrader5 and Local/Remote Copying. (Remote Version is coming soon) Free version is available on Smart Copy Local Free MT5 Specifications :     Real Time, Multi Terminal - Multi Account - MT4/MT5 trade copying     Copy from netting to hedge and hedge to netting is supported.     Fast and instant copy     All settings are input visually.     Easy modifying symbol names, prefix, suffix     Enable/Disable copying
    Account Graph MT4
    Kyra Nickaline Watson-gordon
    5 (2)
    An indicator to draw a graph of account current and historical state such as Balance, Equity, Margin, Free Margin, Margin Level, Drawdown, Account Profit, Deposit and Withdrawals. Indicator Inputs : Draw Balance Graph Draw Equity Graph Draw Margin Graph Draw Free Margin Graph Draw Margin Level Graph Draw Drawdown Graph Draw Account Profit Graph Connect Gaps by Lines Sign of DDs on Profit Sign of DDs on Loss Tips : The Indicator will draw historical balance graphs and deposit/withdraw arrows b
    Online Accounts Manager MT4
    Kyra Nickaline Watson-gordon
    5 (1)
    OneClick Online Account Manager is a powerful utility that helps you to manage all your accounts from a centralized panel. It is suitable for all single account traders and specially for multiple accounts traders. The utility help you to : Monitor status of all accounts on a private web page. Some information such as account connection status, account profit, DD, Balance, Equity, Margin Level, Number of positions and orders, Daily and Weekly profit/loss and also overall summation of all these p
    TPO Profile MT5
    Kyra Nickaline Watson-gordon
    Definition : TPO is a Time Price Opportunity. Instead of using bars or candles with an Open, High, Low, and Close price, each "bar" in a Market Profile is represented by horizontal bars against the price It is called Market Profile terminology. In other words time-price-opportunity (TPO) profiles are histograms of how much time was spent at each price within the span of the profile. By using a TPO chart, you are able to analyze the amount of trading activity, based on time, for each price level
    Loss Recovery 1 MT5
    Kyra Nickaline Watson-gordon
    4.2 (5)
    Loss Recovery 1 is an Expert Advisor for recovering losses of positions that were opened in the wrong direction (that were opened by another EA or manually). This EA recovers your loss and closes your position without using dangerous martingale/Averaging methods. This EA places some positions in opposite directions and some positions in direction of wrong position and manages these positions with mathematical methods until recovering total loss of the position. Using EA : EA Action: Single P
    Loss Recovery 1 MT4
    Kyra Nickaline Watson-gordon
    4 (6)
    Loss Recovery 1 is an Expert Advisor for recovering losses of positions that were opened in the wrong direction (that were opened by another EA or manually). This EA recovers your loss and closes your position without using dangerous martingale/Averaging methods. This EA places some positions in opposite directions and some positions in direction of wrong position and manages these positions with mathematical methods until recovering total loss of the position. Using EA : EA Action: Single P
    Loss Recovery 3 MT5
    Kyra Nickaline Watson-gordon
    Loss Recovery 3 is an Expert Advisor for recovering losses of positions that were opened in the wrong direction (that were opened by another EA or manually). This EA recovers your loss and closes your position on Break Even or with determined profit. Trading Strategy: Loss Recover3 EA try to Recover Wrong Positions, by using Averaging method. There are various features on the EA to control risk of the strategy. Using EA : The EA is very simple and without complicated input parameters. Th
    Loss Recovery 3 MT4
    Kyra Nickaline Watson-gordon
    3.5 (2)
    Loss Recovery 3 is an Expert Advisor for recovering losses of positions that were opened in the wrong direction (that were opened by another EA or manually). This EA recovers your loss and closes your position on Break Even or with determined profit. Trading Strategy: Loss Recover3 EA try to Recover Wrong Positions, by using Averaging method. There are various features on the EA to control risk of the strategy. Using EA : The EA is very simple and without complicated input parameters. Th
    Fundamental Signals Scanner MT5
    Kyra Nickaline Watson-gordon
    5 (1)
    Fundamental Scanner is a Non-Repaint, Multi Symbol and Multi Time Frame Dashboard based on Fundamental Signals Indicator . Fundamental Signals Indicator has a powerful calculation engine that can predict market movement over 3000 pips (30000 points). The indicator is named fundamental because it can predict trends with large movements, no complicated inputs and low risk. Features : Multi-Symbol Support (Support automatic listing of market watch symbols) Multi-TimeFrame Support (Over 7 custo
    Loss Recovery 2 MT5
    Kyra Nickaline Watson-gordon
    3 (2)
    Loss Recovery 2 is an Expert Advisor for recovering losses of positions that were opened in the wrong direction (that were opened by another EA or manually). This EA recovers your loss and closes your position without using dangerous martingale/Averaging methods. Trading Strategy: Loss Recover2 EA try to close wrong positions without any loss (Recover Wrong Positions), by using Zone Recovery method and without using martingale methods. Anytime price exits from zone, EA will close basket of t
    First Scalper MT5
    Kyra Nickaline Watson-gordon
    5 (4)
    First Scalper is an Expert Advisor based on Scalping, Using the best and safest scalping EA on market. Large number of inputs and settings are tested and optimized and embedded in the program thus inputs are limited and very simple. Using EA  doesn't need any professional information or Forex Trading Knowledge. First Scalper can trade on all symbols and all time frames, using a special and unique strategy developed by the author. Using EA : General Options Trade Type : Long/Short/Both Stop
    Market Profile iMT4
    Kyra Nickaline Watson-gordon
    Definition : A Market Profile is an intra-day charting technique (price vertical, time/activity horizontal). Market Profile is best understood as a way to see order in the markets. Market Profile was a way for traders to get a better understanding of what was going on, without having to be on the trading floor. The current indicator is developed based on Easy-to-Use architecture including a wide range of visual settings. Major Features of Indicator : Various Views of Market Profile The indicat
    Account Graph MT5
    Kyra Nickaline Watson-gordon
    5 (1)
    An indicator to draw a graph of account current and historical state such as Balance, Equity, Margin, Free Margin, Margin Level, Drawdown, Account Profit, Deposit and Withdrawals. Indicator Inputs : Draw Balance Graph Draw Equity Graph Draw Margin Graph Draw Free Margin Graph Draw Margin Level Graph Draw Drawdown Graph Draw Account Profit Graph Hide Data on Chart and Buffers Connect Gaps by Lines Sign of DDs on Profit Sign of DDs on Loss Tips : The Indicator will draw historical balance graph
    Triangular EA Limited vMT5
    Kyra Nickaline Watson-gordon
    3 (4)
    Note : Limited version can trade with the volume less than 0.05 lots. Important : This is Arbitrage EA and may not work on all accounts. It is recommended to follow the testing process described on product screenshots. If you are not familiar with arbitrage trading, It is recommended to use our other trading robots . Strategy : EA will place trades based on Triangular Arbitrage strategy. Triangular arbitrage (also referred to as cross currency arbitrage or three-point arbitrage) is the act
    Fundamental Signals Indicator is a Non-Repaint Indicator with a powerful calculation engine that can predict market movement over 3000 pips (30000 points). The indicator does not analyze the market fundamentally, it is named fundamental because it can predict trends with large movements, no complicated inputs and low risk. Also Indicator can alert on market trend changes. Using Indicator : The Indicator is very simple and without complicated input parameters. (No need to optimize anything.)T
    Triangular EA Free vMT5
    Kyra Nickaline Watson-gordon
    2 (1)
    Note : Free version can be used for trading on Demo Accounts. Important : This is Arbitrage EA and may not work on all accounts. It is recommended to follow the testing process described on product screenshots. Strategy : EA will place trades based on Triangular Arbitrage strategy. Triangular arbitrage (also referred to as cross currency arbitrage or three-point arbitrage) is the act of exploiting an arbitrage opportunity resulting from a pricing discrepancy among three different currencie
    FREE
    OneClick Auto Close MT5
    Kyra Nickaline Watson-gordon
    5 (2)
    A utility to close all orders automatically when conditions meet. Various options are available to filter or select orders : Conditions : Closing conditions. 3 different conditions can be defined. EA will close orders anytime one or more defined conditions meet. Conditions can be defined based on account properties or selected orders properties. Also a fixed time to close orders is available. Type of orders : Buy / Sell / Buy Limit / Sell Limit / Buy Stop / Sell Stop Symbol Selection : All / Ch
    VWAP Indicator MT4
    Kyra Nickaline Watson-gordon
    5 (1)
    Description : VWAP (Volume-Weighted Average Price) is the ratio of the value traded to total volume traded over a particular time horizon. It is a measure of the average price at which pair is traded over the trading horizon. Read More. All Symbols and All Timeframes are supported. Indicator Inputs :     VWAP Mode : Mode of VWAP Calculation. Options can be selected : Single,Session,Daily,Weekly,Monthly     Volumes : Real Volumes,Tick Volumes     Price Type : Used price for calculating.
    Smart Copy Local Free MT4
    Kyra Nickaline Watson-gordon
    5 (2)
    Smart Copy is an Easy-to-Use EA that supports Multi Copying Metatrader4 and Metatrader5 and Local/Remote Copying. (Remote Version is coming soon) This is Free Version and can be used on Demo accounts only. Use the Full Version for real trading. Specifications :     Real Time, Multi Terminal - Multi Account - MT4/MT5 trade copying     Copy from netting to hedge and hedge to netting is supported.     Fast and instant copy     All settings are input visually.     Easy modifying symbol names,
    FREE
    OneClick Screenshot MT5
    Kyra Nickaline Watson-gordon
    Description : A utility to create and save screenshots automatically and send to a chat/group/channel on telegram. The saved/sent image file will include all objects that exist on the chart and also all indicators are displayed on the chart. Features: Save screenshot of chart including all objects, indicators, ... Send screenshots to a telegram chat/group/channel Wide range options to select when create screenshots Logo and text adding feature Inputs and How to setup the EA : Various option
    Risk Monitor MT5
    Kyra Nickaline Watson-gordon
    Definition : Risk Monitor is an expert for Analyzing, monitoring, controlling account risks. Strategy :     Analyze Each Currency Volume and Direction on Account and Sort Them     Find and Suggest Best Three Symbols in Opposite Direction (Hedging Positions) for Controlling Risk.     Analyze User-Defined Position and preview effect before placing /Closing Features of EA :     Graphical Interface     Show Risk Graph for each currency     Smart Analyze and suggest best hedging positions    
    Loss Recovery 2 MT4
    Kyra Nickaline Watson-gordon
    3.83 (6)
    Loss Recovery 2 is an Expert Advisor for recovering losses of positions that were opened in the wrong direction (that were opened by another EA or manually). This EA recovers your loss and closes your position without using dangerous martingale/Averaging methods. Trading Strategy: Loss Recover2 EA try to close wrong positions without any loss (Recover Wrong Positions), by using Zone Recovery method and without using martingale methods. Anytime price exits from zone, EA will close basket of t
    Triangular EA Free MT4
    Kyra Nickaline Watson-gordon
    Note: MT4 Backtest cannot test EAs that trades with several symbols simultaneously. For backtest use MT5 versions download here . Note : Free version can be used for trading on Demo Accounts. Important : This is Arbitrage EA and may not work on all accounts. It is recommended to follow the testing process described on product screenshots. Strategy : EA will place trades based on Triangular Arbitrage strategy. Triangular arbitrage (also referred to as cross currency arbitrage or three-point
    FREE
    Smart Copy Local Free MT5
    Kyra Nickaline Watson-gordon
    4.5 (2)
    Smart Copy is an Easy-to-Use EA that supports Multi Copying Metatrader4 and Metatrader5 and Local/Remote Copying. (Remote Version is coming soon) This is Free Version and can be used on Demo accounts only. Use the Full Version for real trading. Specifications :     Real Time, Multi Terminal - Multi Account - MT4/MT5 trade copying     Copy from netting to hedge and hedge to netting is supported.     Fast and instant copy     All settings are input visually.     Easy modifying symbol names,
    FREE
    Triangular EA MT4
    Kyra Nickaline Watson-gordon
    1 (1)
    Note: MT4 Backtest cannot test EAs that trades with several symbols simultaneously. For backtest use MT5 versions download here . Important : This is Arbitrage EA and may not work on all accounts. It is recommended to follow the testing process described on product screenshots. If you are not familiar with arbitrage trading, It is recommended to use our other trading robots . Strategy : EA will place trades based on Triangular Arbitrage strategy. Triangular arbitrage (also referred to as cr
    Triangular EA Limited MT4
    Kyra Nickaline Watson-gordon
    1 (2)
    Note: MT4 Backtest cannot test EAs that trades with several symbols simultaneously. For backtest use MT5 versions download here . Note : Limited version can trade with the volume less than 0.05 lots. Important : This is Arbitrage EA and may not work on all accounts. It is recommended to follow the testing process described on product screenshots. If you are not familiar with arbitrage trading, It is recommended to use our other trading robots . Strategy : EA will place trades based on Tria
    Magic EA MT4
    Kyra Nickaline Watson-gordon
    3 (1)
    Magic EA is an Expert Advisor based on Scalping, Elliot Waves and with filters such as RSI, Stochastic and 3 other strategies managed and decided with the robot smartly. Large number of inputs and settings are tested and optimized and embedded in the program thus inputs are limited and very simple. Using EA doesn't need any professional information or Forex Trading Knowledge. EA can trade on all symbols and all time frames, using special and unique strategies developed by the author. The EA wo
    VPO Profile MT4
    Kyra Nickaline Watson-gordon
    5 (2)
    Definition : VPO is a Volume Price Opportunity. Instead of using bars or candles with an Open, High, Low, and Close price, each "bar" in a Market Profile is represented by horizontal bars against the price It is called Market Profile terminology. In other words volume-price-opportunity (VPO) profiles are histograms of how many volumes were traded at each price within the span of the profile. By using a VPO chart, you are able to analyze the amount of trading activity, based on volume, for each
    TPO Profile MT4
    Kyra Nickaline Watson-gordon
    5 (1)
    Definition : TPO is a Time Price Opportunity. Instead of using bars or candles with an Open, High, Low, and Close price, each "bar" in a Market Profile is represented by horizontal bars against the price It is called Market Profile terminology. In other words time-price-opportunity (TPO) profiles are histograms of how much time was spent at each price within the span of the profile. By using a TPO chart, you are able to analyze the amount of trading activity, based on time, for each price level
    Filtro:
    CSG CSG
    1641
    CSG CSG 2024.01.26 15:59 
     

    Ein toller Indikator mit wertvollen Einstellungsmöglichkeiten. Funktioniert alles ohne Probleme. Leider schiebt sich die Darstellung öfter über andere Objekte, es wäre schön, wenn man das auch noch einstellen könnte. Dann gibts 5 Sterne ;-)

    Kyra Nickaline Watson-gordon
    54212
    Resposta do desenvolvedor Kyra Nickaline Watson-gordon 2024.01.27 04:05
    Thank you for your interest. Please explain your issue details to update and fix the product. You can send me details on "Comments" or on PV.
    Florian Leonhard Schaal
    471
    Florian Leonhard Schaal 2023.07.16 11:35 
     

    Nice indicator, works with ticks on forex and real volume on others (didnt check yet). Recommended!

    Responder ao comentário
    Versão 1.5 2024.07.17
    Fixed a minor issue on daily season.
    Versão 1.4 2024.02.22
    Added option to select font type.
    Versão 1.3 2023.01.27
    Minor updates on buffers filling.
    Versão 1.2 2021.10.03
    Added more buffers for developers.
    Versão 1.1 2021.03.13
    Optimized Performance when multiple indicators run on chart.