RSI Average Digit
- Indicadores
- Andrian Armand Gannery
- Versão: 2.0
- Atualizado: 27 dezembro 2020
- Ativações: 5
This Relative Strength Index version using four different Period.
Calculate on Timeframe M1, M5, M15, M30, H1, H4 and D1.
Each using median price for valid average calculation.
How to use this indicator, as follows;
1. This indicator design for FOLLOW THE TREND, not using for Overbought or Oversold, but if you want to use it as Reversal trades, is up to you.
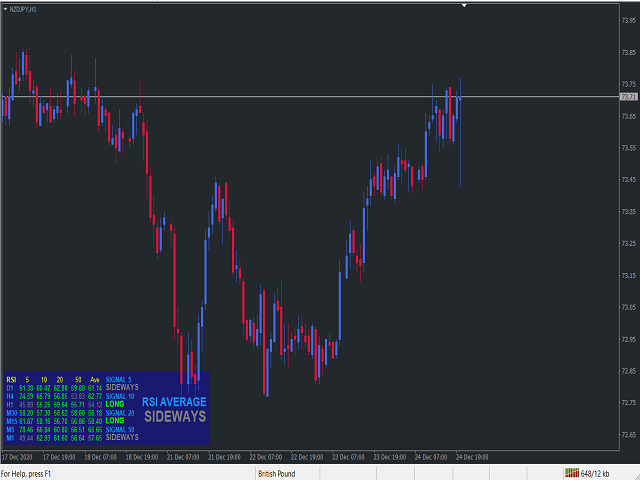
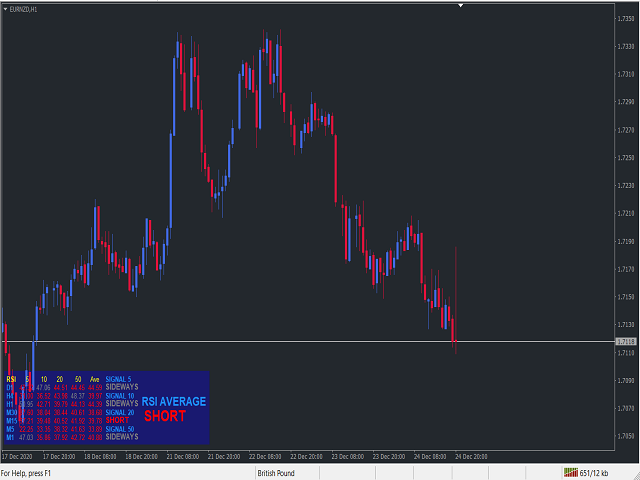
2. You can see on pictures attachment, it produce three type of signal, LONG, SHORT and SIDEWAYS.
3. Recommended for trading, Open trades only base RSI Average Signal, if LONG do LONG, if SHORT do SHORT.
4. If SIDEWAYS, NO TRADES.
In the parameter setting you can change your desire Period (default on RSI 5, RSI 10, RSI 20, RSI 50).
And you can change your desire Overbought and Oversold level.
Happy Follow the Trend
Regards.
