CandleStick MT5
- Indicadores
- Du Zhi Shan Tian
- Versão: 1.3
- Atualizado: 5 setembro 2023
- Ativações: 5
What you can do with CandleStick
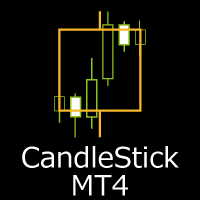
CandleStick is a useful indicator for doing MTF analysis.
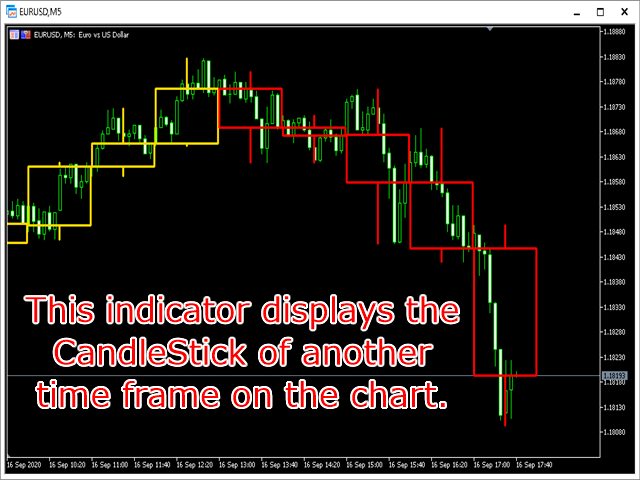
This indicator displays the CandleStick of another time frame on the chart.
By understanding the information in multiple time charts at the same time, it is easier to understand the overall market view.
It is also a useful tool for validating and studying past quotes and trades.
There are similar products made by others, but I designed and developed it so that it is easy for me to use.
Features of CandleStick only
When I trade, the important thing is operability.
There are traders who operate by opening multiple charts of different time frame on the display.
But I don't.
It's hard to see and hard to understand.
I open one chart for one currency pair.
While switching the chart's timeframe, I trade using MTF analysis to get the information I need.
Until now, similar indicators existed, but there was a problem that only one time frame could be set.
For example, if I set H1-CandleStick to draw, I could draw on the 15-minute chart, but could not draw on the daily chart.
Therefore, this indicator allows you to set the CandleStick time frame for each MT4/MT5 chart.
In other words, the specified CandleStick can be displayed by switching to any chart.
This way is easy to see and understand.
This way also makes MT4/MT5 work lighter and more comfortable.
I developed the CandleStick to get the best performance in this way.
What can be set in the property
- Can set CandleStick time frame for each MT4/MT5 chart.
- Supports 8 types of CandleStick: M5, M15, M30, H1, H4, D1, W1, MN1.
- You can switch Show/Hide the CandleStick by pressing a key on the keyboard.( The default key is “C”)
- CandleStick can specify the line color, line width, and line type. ( However, the line type can be set only when the line width is 1.)
- It is possible to set whether or not to display the CandleStick when loading the indicator.
- The recommended value for the “Calculation Range” is 2000-10000. The higher this number, the more CandleSticks will be drawn, but slower.Adjust according to the specifications of your computer.
My settings
As I said, I only open one chart for one currency pair and use it by switching the time frame.
I don't want the Candle Stick to appear when I switch between timeframes.
I don't always want to see it.
I want to see it when I need it.
Therefore, set ”Show on load” to false. (Default is true)
Use the Show/Hide key to display the CandleStick.
You can assign a-z keys to “Show/Hide” keys. (Default is C)
In the case of H1 chart, I want to display CandleStick of D1, so set it in the property to do so.
Set the other time frames in the same way.
Also set CandleStick Color, Line Width, and Line Style.
In my case…
Bullish CandleStick Color=Gold.
Bearish CandleStick Color=Red.
Line Width=1.
Line Style=Solid.
Calculation Range is 5000 by default.
I have no trouble with this setting.
Change it if necessary.










Tian-san,I request a small feature to add Range "High-Low" of the HTF candle .Kindly also provide options for Font color and Font Size.Thanks !I am really hoping that you will implement this feature.I will say special thanks in my post.