Hybrid Stochastic
- Indicadores
- Flavio Javier Jarabeck
- Versão: 1.0
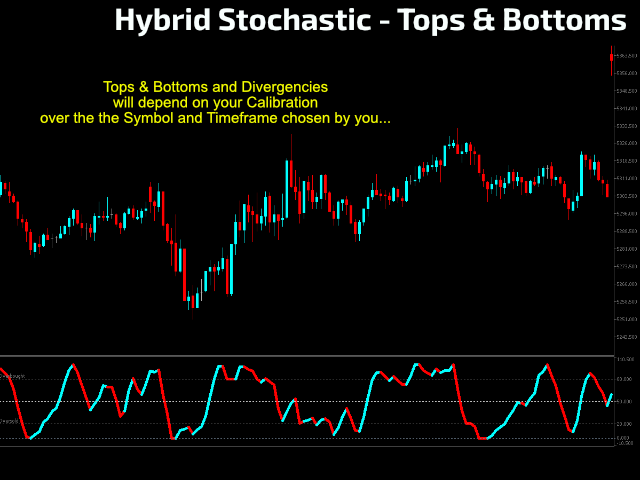
The Hybrid Stochastic indicator is a Stochastic RSI described by the famous Tushar Chande and Stanley Kroll in their book called "The New Technical Trader". The main goal of this indicator is to generate more Overbought and Oversold signals than the traditional Relative Strength indicator (RSI). Combining these 2 indicators expands the range of the overbought and oversold territory.
The idea behind it is to use the Stochastic formula over RSI values. If you want to know more about its internal workings there is a fantastic article in the Investopedia website.
HOW TO "READ" THE HYBRID STOCHASTIC
- The authors suggest that 20/80 levels be used as the oversold/Overbought regions, but as we actually know, every single indicator must be calibrated to the Symbol, Timeframe and Strategy the trader is currently using.
- Stay alert when Hybrid Stochastic reaches values below 20 and above 80 and then it starts to revert its direction, that's why we put a coloring system to the UP and DOWN slopes.
- The Hybrid Stochastic is a powerful tool for spot Divergences between Price Action swings and the indicator's swings.
- You can also spot strong opposite moves when the Price stays at also the same level on the chart but the Hybrid Stochastic moves from on side of the oscillator range to the other side fast - more noticeable on lower timeframes.
SETTINGS
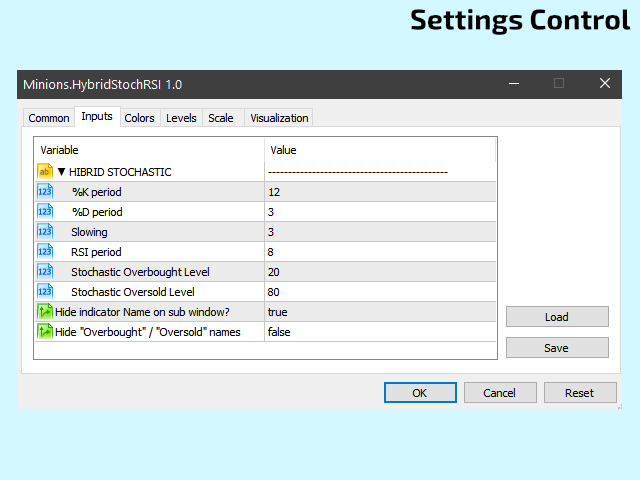
- %K, %D, and Slowing calculations periods.
- RSI period.
- Overbought & Oversold levels & styles
- Do you want to hide indicator's name from the sub-window? (ideal if you are using a Mini Chart).
- Do you want to hide the "Overbought" and "Oversold" labels from the indicator?
Enjoy!
If you like this indicator, all I am asking is a little Review (not a Comment, but a REVIEW!)...
This will mean A LOT to me... And this way I can continue to give away Cool Stuff for Free...
With No Strings Attached! Ever!
Live Long and Prosper!
;)


rewelacyjny