• Visão global
  • Comentários (11)
  • Discussão (9)

MACD Double

5
This indicator calculates buy and sell signals by using MACD indicator on two timeframes.
MACD is a trend-following showing the relationship between two moving averages of the closing price. The MACD is calculated by subtracting the 26-period Exponential Moving Average (EMA) from the 12-period EMA.The result of that calculation is the MACD line. A nine-day EMA of the MACD called the "signal line".


This indicator has 2 modes to calculate the buy/sell signals:
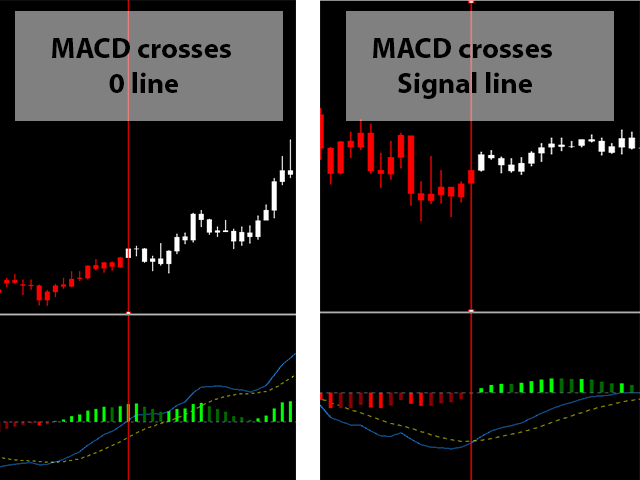
- MACD crosses 0 line
- MACD crosses Signal line


Screenshot shows an example for each mode
Comentários 11
zofesu
350
zofesu 2023.03.23 15:47 
 

Easy to use

Cristian Mantovani
2907
Cristian Mantovani 2022.11.04 08:10 
 

Very intuitive

John Winsome Munar
3471
John Winsome Munar 2022.06.14 14:17 
 

Good indicator. MACD is visualized clearly.

Produtos recomendados
PZ Oscillator
PZ TRADING SLU
3 (10)
O Pz Oscillator é um acelerômetro muito suave e sensível que fornece uma série de informações úteis e detecta automaticamente as divergências . É uma grande confirmação de negociação e pode ser usado para identificar a direção e força da tendência. Ele foi projetado como um complemento para as nossas ferramentas de negociação. Direção de tendência O oscilador plota duas médias móveis para mostrar a direção da tendência. Se a média móvel rápida está acima da média móvel lenta, o mercado está em
FREE
OsMA Arrow MTF
Pavel Shutovskiy
3.92 (12)
The indicator displays crossing zero level by Moving Average of Oscillator (OsMA) in the form of arrows. The this is a multi-timeframe indicator, and it displays signals from other timeframes. The indicator notifies about a signal by means of a pop-up Alert window, or sending notification to e-mail. Parameters Time-frame - select timeframe to show indicator signals. Fast EMA Period - fast EMA. This is an exponential moving average from a price with a short period. Slow EMA Period - slow EMA. T
FREE
Tipu Heikin Ashi Panel
Kaleem Haider
4.56 (25)
Tipu Heikin-Ashi Panel is the modified version of the original Heiken Ashi indicator published by MetaQuotes here . A professional version of this indicator is available here . Features An easy to use Panel that shows the Heiken Ashi trend of selected timeframe. Customizable Buy/Sell alerts, push alerts, email alerts, or visual on-screen alerts. Customizable Panel. The panel can be moved to any place on the chart or minimized to allow more space. Heikin means "the average", and Ashi means "foo
FREE
HMA Trend
Pavel Zamoshnikov
4.62 (84)
A trend indicator based on the Hull Moving Average (HMA) with two periods. The Hull Moving Average is an improved variant of the moving average, which shows the moment of trend reversal quite accurately. It is often used as a signal filter. Combination of two types of Hull Moving Averages makes a better use of these advantages: HMA with a slow period identifies the trend, while HMA with a fast period determines the short-term movements and signals in the trend direction. Features The movement
FREE
FREE FOR A LIMITED TIME ONLY!!! The Ultimate Indicator For Trading Trend This indicator clearly shows you the strength of the market in one direction or the other, which means that you can trade knowing you are either with or against the market. When used in conjunction with the +3R principles you are sure to have some serious results. The +3R Principles Routine - This is when you trade and how often  Rules - This is the rule you follow  Risk:Reward - This is the percentage amount of your accoun
FREE
TrendPlus
Sivakumar Subbaiya
4.21 (14)
Trend Plus   Trendplus  Indicator   Time Frame: Suitable for any time frame.  Purpose: Trend Prediction. Blue and red candle indicate the buy and sell call respectively. Buy: When the blue candle is formed buy call is initiated. close the buy trades when the next red candle will formed.   Sell: When the Red candle is formed Sell call is initiated. close the Sell trades when the next blue candle will formed.   Happy trade!!
FREE
MTF Stochastic and RSI
Georgiy Gazaryan
5 (2)
A simple but effective helper that will allow you to track both global and local market trends. The indicator combines the work of two oscillators: Stochastic and RSI. Both indicators can be set to any timeframe. Advantages of Use Multitimeframe - you can adjust both indicators to the desired timeframes. To obtain the entry points, you can use the Elder's triple screen system. Highly customizable - you can configure not only the parameters of the indicators, but also their appearance (color an
FREE
Power Trend Free
Yurij Kozhevnikov
5 (2)
Power Trend Free - the indicator shows the trend strength in the selected period. Input Parameters The indicator has three input parameters: Period - a positive number greater than one, it shows the number of candlesticks used for calculations. If you enter one or zero, there will be no error, but the indicator will not be drawn. Applied Price - the standard "Apply to:" set meaning data used for the indicator calculation: Close - Close prices; Open - Open prices; High - High prices; Low - Low
FREE
Color Macd Tf
Syarif Nur Arief
MACD is well known indicator that still can be use for prediction where price will go next few minutes, hours or even weekly  With colored bar of Macd, your eyes can easily catch when color is changed based what market price movement to find any early trend on market. here is the parameter of the indicator: TF_MACD , default is 1 Hour , this mean you can see clearly MACD of 1 Hour TimeFrame on Lower TimeFrame. InpPrice , default is Price Close , this is original MACD parameter from Metaquotes st
FREE
OrderBlock TS Roman
Vladislav Vlastovskii
3.88 (8)
Индикатор строит блоки заказов (БЗ) по торговой системе (ТС) Романа. Поиск блоков осуществляется одновременно на двух таймфремах: текущем и старшем (определяемым в настройках). Для оптимизации и игнорирования устаревших блоков в настройках задается ограничение количества дней в пределах которых осуществляется поиск блоков. Блоки строятся по правилам ТС состоящем из трех шагов: какую свечу вынесли (что?); какой свечой вынесли (чем?); правило отрисовки (как?).
FREE
CCI Signal 2 AM
Andriy Matviyevs'kyy
This indicator displays the moment when the CCI oscillator crosses the zero value, and the moment when the CCI oscillator crosses its smoothed value. Crossing the zero value by the CCI oscillator is a buy/sell signal. If the CCI oscillator crosses its smoothed value, it is a signal of a trend change. The signal is given after the end of the formation of the candle. The signal is confirmed when the price crosses the high/low of the bar on which the signal was given. The indicator does not redraw.
FREE
Signals and Alerts for Accelerator/Decelerator indicator based on these MQL5 posts: Accelerator Oscillator and Signals of the Indicator Accelerator Oscillator . Note : this tool is based on the code of Accelerator indicator developed by MetaQuotes Software Corp. Features The signals are triggered at   closing   of last bar/opening of a new bar; Any kind of alerts can be enabled: Dialog Box, Email message, SMS notifications for smartphones and tablets, and Sound alerts; Customizable arrows. By
FREE
TCCI with Alert
Wen Huang
4.67 (6)
Esta é UMA média de índice semelhante com base num algoritmo definido pelo utilizador. De acordo com a banda, o uplink e o downlink podem ser identificados por Cor. A caixa de pop-up Pode ser ligada ou desligada para indicar que a ordem de compra Ou Venda actual deve ser colocada. Descrição Da lista de parâmetros: Preço exterior = 0; // preço médio inicial do indicador Comprimento exterior = 20; // o indicador calcula o período médio, que é equivalente Ao período médio de Ma.
FREE
With this system you can spot high-probability trades in direction of strong trends. You can profit from stop hunt moves initiated by the smart money! Important Information How you can maximize the potential of the scanner, please read here: www.mql5.com/en/blogs/post/718109 Please read also the blog about the usage of the indicator: Professional Trading With Strong Momentum This FREE Version of the indicator works only on EURUSD and GBPUSD. The full version of the indicator can be found here:
FREE
The Cossover MA Histogram indicator is a simple tool showing the trend based on crossover of moving averages. Simply specify two mobving averages and addicional parameters like MA method and Applied price. When fast MA is above slow MA the histogram is green, indicating an uptrend. When MA fast is below MA slow the histogram is red, indicating an downtrend.
FREE
FFx Momentum
Eric Venturi-Bloxs
4.33 (3)
The purpose of this new version of the MT4 standard indicator provided in your platform is to display in a sub-window multiple timeframes of the same indicator. See the example shown in the picture below. But the display isn’t like a simple MTF indicator. This is the real display of the indicator on its timeframe. Here's the options available in the FFx indicator: Select the timeframes to be displayed (M1 to Monthly) Define the width (number of bars) for each timeframe box Alert pop up/sound/ema
FREE
RSI Signal 2 AM
Andriy Matviyevs'kyy
This indicator displays the moment when the RSI oscillator crosses the zero value, and the moment when the RSI oscillator crosses its smoothed value. Crossing the zero value by the RSI oscillator is a buy/sell signal. If the RSI oscillator crosses its smoothed value, it is a signal of a trend change. The signal is given after the end of the formation of the candle. The signal is confirmed when the price crosses the high/low of the bar on which the signal was given. The indicator does not redraw.
FREE
With the MACD Multi Time Frame indicator, you can spot divergences of higher timeframes while you are searching for pinpointed entries on lower timeframes. This FREE version of the indicator works only on EURUSD and GBPUSD. The full version of the indicator can be found here: MACD Multi Time Frame This blog post gives you REAL-TIME MACD Divergence Analysis for FREE and tips how to trade the divergences: REAL-TIME MACD Divergence Analysis The MACD Multi Time Frame gives you a very good overview o
FREE
Are you tired of drawing trendlines every time you're analyzing charts? Or perhaps you would like more consistency in your technical analysis. Then this is for you. This indicator will draw trend lines automatically when dropped on a chart. How it works Works similar to standard deviation channel found on mt4 and mt5. It has 2 parameters: 1. Starting Bar 2. Number of bars for calculation The   starting bar   is the bar which drawing of the trend lines will begin, while the   number of bars for c
FREE
User friendly indicator.  This indicator will help you catch the trend an fast as possible. Indicator developed based on moving averages. User can select which type of moving averages they want to use. Indicator draws an arrow when the moving average crosses. The moving average cross over arrow can be filtered with RSI, OsMA, and Parabolic Sar. There are options for selecting specific criteria for the filters.  Such as period of Rsi and Rsi levels. OsMA and Parabolic Sar criteria can also be sel
BoB Trigger AM
Andriy Matviyevs'kyy
The presented indicator is a development of the ideas contained in the Bulls or Bears AM indicator. This indicator displays the difference between the maximum and minimum prices for the current period of time and the values ​​of the channel built using the maximum and minimum prices for a longer period. An increase in indicator values ​​above zero indicates that the maximum price for the current period is greater than the average value of the maximum prices for the period selected as an indicato
FREE
Download the free USDJPY version   here. MACD Indicator The Moving Average Convergence and Divergence (MACD) is a trend following momentum indicator which shows the relationship between two moving averages that we chose and configure them on the indicator. The MACD is calculated by subtracting the 26-period exponential moving average and the 12 period D.A.M. These are the default parameters when you put the MACD indicator on the charts, and the period is usually 9 which means the last 9 candle
FREE
MTF Heiken Ashi MA is a multiple timeframe Heiken Ashi & Moving Average indicator. Fully customizable for advanced & unique Heiken Ashi & Moving Average calculations. Key Features Modified appearance and appeal from the traditional using only H eiken Ashi MA bodies. MTF Higher or lower timeframes available making this it great for trends and scalping. There are many settings that can be non-repaint for signals at a new bar and at bar 0. Inputs Timeframe  = PERIOD_CURRENT - timeframe of Movin
FREE
Introducing the Consecutive Green/Red Candle Alert Indicator for MT4 - Your Trend Spotting Companion! Are you ready to take your trading to the next level? We present the Consecutive Green/Red Candle Alert Indicator, a powerful tool designed to help you spot trends and potential reversals with ease. Whether you're a new trader looking for clarity in the market or an experienced pro seeking additional confirmation, this indicator is your trusted companion. Key Features of the Consecutive Green/Re
FREE
Wise Men Indicator demo
Bohdan Kasyanenko
3.67 (3)
The indicator displays signals according to the strategy of Bill Williams on the chart. Demo version of the indicator has the same features as the paid, except that it can work only on a demo account . Signal "First Wise Man" is formed when there is a divergent bar with angulation.  Bullish divergent bar - with lower minimum and closing price in the upper half. Bearish divergent bar - higher maximum and the closing price at the bottom half. Angulation is formed when all three lines of Alligat
FREE
RSI With Alert Relative strength index (RSI) indicator is a popular technical indicator in the family of oscillators. RSI oscillates between 0 and 100 and traders use it to spot overbought and oversold states in the market. Typically, a value above 70 means that the instrument is overbought and due to a retracement. A value below 30 means that the trading instrument is oversold. RSI indicator strategies This indicator allows you to get notifications when some conditions trigger. You c
FREE
DeM Signal AM
Andriy Matviyevs'kyy
This indicator displays the moment when the DeMarker oscillator crosses its smoothed value. If the DeMarker oscillator crosses its smoothed value, it is a signal of a trend change. The signal is given after the end of the formation of the candle. The signal is confirmed when the price crosses the high/low of the bar on which the signal was given. The indicator does not redraw. Custom Parameters: DeM_Period (>1) - DeMarker indicator period; MA_Period - period for smoothing DeMarker indicator va
FREE
Discover the power of precision and efficiency in your trading with the " Super Auto Fibonacci " MT4 indicator. This cutting-edge tool is meticulously designed to enhance your technical analysis, providing you with invaluable insights to make informed trading decisions. Key Features: Automated Fibonacci Analysis: Say goodbye to the hassle of manual Fibonacci retracement and extension drawing. "Super Auto Fibonacci" instantly identifies and plots Fibonacci levels on your MT4 chart, saving you tim
FREE
MegaTrends
Sivakumar Subbaiya
1 (1)
Megatrends  Indicator   Time Frame: Suitable for any time frame.  Purpose: Trend Prediction. Blue and red color indicate the buy and sell call respectively. Buy: When the blue line is originating it is opened buy call. Sell: When the Red line is origination it is opened sell call Happy trade!! this indicator is suitable for all time frame, but our recommended time frame to use 1hour and 4 hours, suitable for any chart.
FREE
RelicusRoad MACD v2
Relicus LLC
4.67 (6)
A estratégia de negociação Moving Average Convergence Divergence (MACD) é uma ferramenta popular de análise técnica usada para identificar mudanças no impulso e direção da tendência. O MACD é calculado subtraindo a média móvel exponencial (EMA) de 26 períodos da EMA de 12 períodos. Uma EMA de 9 períodos, chamada "linha de sinal", é então plotada em cima do MACD para atuar como um gatilho para sinais de compra e venda. O MACD é considerado em território de alta quando a linha MACD está acima da l
FREE
Os compradores deste produto também adquirem
Gann Made Easy
Oleg Rodin
4.88 (100)
Gann Made Easy é um sistema de negociação Forex profissional e fácil de usar, baseado nos melhores princípios de negociação usando a teoria do sr. W. D. Gann. O indicador fornece sinais precisos de COMPRA e VENDA, incluindo níveis de Stop Loss e Take Profit. Você pode negociar mesmo em movimento usando notificações PUSH. Entre em contato comigo após a compra! Vou compartilhar minhas dicas de negociação com você e ótimos indicadores de bônus de graça! Provavelmente você já ouviu muitas vezes sobr
Trend Punch
Mohamed Hassan
4.91 (23)
This indicator is unstoppable when combined with our other indicator called  Support & Resistance . After purchase, send us a message and you will get it   for  FREE as a BONUS! Introducing Trend Punch , the revolutionary forex trend indicator that will transform the way you trade! Trend Punch is uniquely designed to provide precise buy and sell arrows during strong market trends, making your trading decisions clearer and more confident. Whether you're trading major currency pairs or exotic sym
Gold Stuff
Vasiliy Strukov
4.9 (270)
Gold Stuff-um indicador de tendência projetado especificamente para o ouro, também pode ser usado em qualquer instrumento financeiro. O indicador não é redesenhado ou atrasado. O timeframe recomendado é H1. O EA Gold Stuff Expert Advisor está escrito neste indicador, você pode encontrá-lo no meu perfil. Importante! Entre em contato comigo imediatamente após a compra para obter instruções e bônus!  Você pode obter uma cópia gratuita do nosso indicador Strong Support e Trend Scanner, envie um
FX Power MT4 NG
Daniel Stein
5 (13)
Receba a sua atualização diária do mercado com detalhes e screenshots através do nosso Morning Briefing aqui no mql5 e no Telegram ! O FX Power MT4 NG é a próxima geração do nosso medidor de força de moeda muito popular de longa data, o FX Power. E o que é que este medidor de força da próxima geração oferece? Tudo o que adorou no FX Power original MAIS Análise de força GOLD/XAU Resultados de cálculo ainda mais precisos Períodos de análise configuráveis individualmente Limite de cálculo personal
LEIA AS INFORMAÇÕES ABAIXO ANTES DE COMPRAR O PRODUTO! Apollo Pips PLUS SP é um produto único! É PARA QUEM QUER ADQUIRIR MEU NOVO INDICADOR "APOLLO PIPS" MAIS BÔNUS "SUPER PACK" COM ACESSO A TODOS OS MEUS INDICADORES DE NEGOCIAÇÃO! Ao adquirir o produto Apollo Pips PLUS SP você está na verdade adquirindo uma versão absolutamente nova do meu indicador Apollo Pips. Esta versão do indicador possui um algoritmo aprimorado e um parâmetro fácil de usar que lhe dá a oportunidade de usar o indicador em
TPSproTREND PrO
Roman Podpora
4.79 (19)
TPSpro TREND PRO   é um indicador de tendência que analisa automaticamente o mercado e fornece informações sobre a tendência e cada uma de suas mudanças, além de dar sinais para entrar em negociações sem redesenhar! O indicador utiliza cada vela, analisando-as separadamente. referindo-se a diferentes impulsos - impulso para cima ou para baixo. Pontos de entrada exatos em transações de moedas, criptomoedas, metais, ações, índices! Versão MT5                   DESCRIÇÃO COMPLETA DO INDICADOR    
Trend Pulse
Mohamed Hassan
5 (5)
Please contact me after purchase to immediately get your PDF strategy + documentation for Trend Pulse !  Official release price of $89  (2 /50 copies left). Next price is $199 . Introducing Trend Pulse , a unique and robust indicator capable of detecting bullish, bearish, and even ranging trends! Trend Pulse uses a special algorithm to filter out market noise with real precision. If the current symbol is moving sideways, Trend Pulse will send you a ranging signal, letting you know that it'
Scalper Inside PRO
Alexey Minkov
4.75 (60)
An exclusive indicator that utilizes an innovative algorithm to swiftly and accurately determine the market trend. The indicator automatically calculates opening, closing, and profit levels, providing detailed trading statistics. With these features, you can choose the most appropriate trading instrument for the current market conditions. Additionally, you can easily integrate your own arrow indicators into Scalper Inside Pro to quickly evaluate their statistics and profitability. Scalper Inside
Atomic Analyst
Issam Kassas
5 (3)
Primeiramente, vale ressaltar que este Indicador de Negociação não repinta, não redesenha e não apresenta atrasos, tornando-o ideal tanto para negociação manual quanto automatizada. Manual do utilizador: configurações, entradas e estratégia. O Analista Atômico é um Indicador de Ação de Preço PA que utiliza a força e o momentum do preço para encontrar uma vantagem melhor no mercado. Equipado com filtros avançados que ajudam a remover ruídos e sinais falsos, e aumentam o potencial de negociação.
Trend Screener
STE S.S.COMPANY
4.82 (92)
Indicador de tendência, solução única inovadora para negociação e filtragem de tendências com todos os recursos de tendências importantes construídos dentro de uma ferramenta! É um indicador multi-timeframe e multi-moedas 100% sem repintura que pode ser usado em todos os símbolos/instrumentos: forex, commodities, criptomoedas, índices e ações. O Trend Screener é um indicador eficiente que segue a tendência do indicador que fornece sinais de tendência de seta com pontos no gráfico. Os recursos qu
Currency Strength Wizard é um indicador muito poderoso que fornece uma solução completa para uma negociação bem-sucedida. O indicador calcula o poder deste ou daquele par forex usando os dados de todas as moedas em vários intervalos de tempo. Esses dados são representados em uma forma de índice de moeda fácil de usar e linhas de energia de moeda que você pode usar para ver o poder desta ou daquela moeda. Tudo o que você precisa é anexar o indicador ao gráfico que deseja negociar e o indicador mo
- Real price is 80$ - 40% Discount ( It is 49$ now ) Contact me for instruction, any questions! Introduction The breakout and retest strategy is traded support and resistance levels. it involves price breaking through a previous level.  The break and retest strategy is designed to help traders do two main things, the first is to avoid false breakouts. Many false breakouts start with a candlestick that breaks out of a level but ends with an immediate candlestick that brings the price back into t
Actualmente 20% OFF ! A melhor solução para qualquer novato ou comerciante especializado! Este software de painel de instrumentos está a funcionar em 28 pares de moedas. É baseado em 2 dos nossos principais indicadores (Advanced Currency Strength 28 e Advanced Currency Impulse). Dá uma grande visão geral de todo o mercado Forex. Mostra valores avançados de força da moeda, velocidade de movimento da moeda e sinais para 28 pares de divisas em todos os (9) períodos de tempo. Imagine como a sua
Clear Breakout
Martin Alejandro Bamonte
5 (1)
O indicador "Breakout Buy-Sell" foi desenvolvido para identificar e destacar potenciais oportunidades de compra e venda com base em rompimentos de preços durante diferentes sessões de mercado (Tóquio, Londres e Nova York). Este indicador ajuda os traders a visualizar claramente as zonas de compra e venda, bem como os níveis de take-profit (TP) e stop-loss (SL). Estratégia de Uso O indicador pode ser usado da seguinte maneira: Configuração Inicial : Selecione a sessão do mercado e ajuste o offset
ACTUALMENTE COM 26% DE DESCONTO A melhor solução para qualquer novato ou comerciante especializado! Este Indicador é uma ferramenta comercial única, de alta qualidade e acessível, porque incorporámos uma série de características proprietárias e uma nova fórmula. Com apenas UM gráfico, pode ler a força da moeda para 28 pares de Forex! Imagine como a sua negociação irá melhorar porque é capaz de apontar o ponto exacto do gatilho de uma nova tendência ou oportunidade de escalada? Manual do u
O sistema PRO Renko é um sistema de negociação altamente preciso especialmente concebido para a negociação de gráficos RENKO. Trata-se de um sistema universal que pode ser aplicado a vários instrumentos de negociação. O sistema neutraliza eficazmente o chamado ruído de mercado, dando-lhe acesso a sinais de inversão precisos. O indicador é muito fácil de usar e tem apenas um parâmetro responsável pela geração de sinal. Você pode facilmente adaptar a ferramenta a qualquer instrumento de negoc
Gold Channel   é um indicador baseado na volatilidade, desenvolvido com um algoritmo de tempo especifico para o par XAUUSD que consiste em encontrar possíveis correções no mercado. Este indicador mostra duas linhas exteriores, uma interior (linha de retração) e um sinal de seta, onde a teoria do canal consiste em ajudar a identificar condições de sobrecompra e sobrevenda no mercado. O preço do mercado cairá geralmente entre os limites do canal. Se os preços tocarem ou se moverem para fora do can
Antes de tudo, vale ressaltar que esta Ferramenta de Negociação é um Indicador Não Repintante, Não Redesenhante e Não Atrasado, o que a torna ideal para negociação profissional. Curso online, manual do utilizador e demonstração. O Indicador de Conceitos de Ação de Preço Inteligente é uma ferramenta muito poderosa tanto para traders novos quanto experientes. Ele combina mais de 20 indicadores úteis em um único, combinando ideias avançadas de negociação como Análise do Trader do Círculo Interno e
ACTUALMENTE 31% DE DESCONTO!! A melhor solução para qualquer novato ou comerciante especializado! Este indicador é uma ferramenta comercial única, de alta qualidade e acessível, porque incorporámos uma série de características proprietárias e uma fórmula secreta. Com apenas UM gráfico, dá alertas para todos os 28 pares de moedas. Imagine como a sua negociação irá melhorar porque é capaz de identificar o ponto exacto de desencadeamento de uma nova tendência ou oportunidade de escalada! Con
NAM Order Blocks
NAM TECH GROUP, CORP.
5 (1)
Indicador de detecção de blocos de pedidos de multi-timeframe MT4. Características - Totalmente personalizável no painel de controle do gráfico, fornece interação completa. - Oculte e mostre o painel de controle onde quiser. - Detectar OBs em vários períodos de tempo. - Selecione a quantidade de OBs para exibir. - Interface de usuário de OBs diferente. - Filtros diferentes em OBs. - Alerta de proximidade OB. - Linhas ADR de alta e baixa. - Serviço de notificação (alertas de
RelicusRoad Pro
Relicus LLC
4.73 (141)
Agora US $ 147 (aumentando para US $ 499 após algumas atualizações) - Contas ilimitadas (PCs ou Macs) Manual do usuário do RelicusRoad + vídeos de treinamento + acesso ao grupo de discórdia privado + status VIP UMA NOVA FORMA DE OLHAR PARA O MERCADO O RelicusRoad é o indicador de negociação mais poderoso do mundo para forex, futuros, criptomoedas, ações e índices, oferecendo aos traders todas as informações e ferramentas necessárias para se manterem rentáveis. Fornecemos análises técnica
PZ Trend Trading
PZ TRADING SLU
4.8 (5)
O Trend Trading é um indicador projetado para lucrar o máximo possível com as tendências que ocorrem no mercado, cronometrando retrocessos e rupturas. Ele encontra oportunidades de negociação analisando o que o preço está fazendo durante as tendências estabelecidas. [ Guia de instalação | Guia de atualização | Solução de problemas | FAQ | Todos os produtos ] Negocie mercados financeiros com confiança e eficiência Lucre com as tendências estabelecidas sem ser chicoteado Reconhecer retrocesso
TPSpro RFI Levels
Roman Podpora
4.83 (24)
Reversal First Impulse levels (RFI)    INSTRUCTIONS        RUS       -       ENG              R ecommended to use with an indicator   -   TPSpro  TREND PRO -  Version MT5 A key element in trading is zones or levels from which decisions to buy or sell a trading instrument are made. Despite attempts by major players to conceal their presence in the market, they inevitably leave traces. Our task was to learn how to identify these traces and interpret them correctly. Main functions: Displaying activ
Break and Retest
Mohamed Hassan
4.17 (18)
This Indicator only places quality trades when the market is really in your favor with a clear break and retest. Patience is key with this price action strategy! If you want more alert signals per day, you increase the number next to the parameter called: Support & Resistance Sensitivity.  After many months of hard work and dedication, we are extremely proud to present you our  Break and Retest price action indicator created from scratch. One of the most complex indicators that we made with ove
Order Block Hunter
Noha Mohamed Fathy Younes Badr
5 (2)
Order block hunter indicator is the best indicator for  hunt the order blocks that area where there has been a large concentration of limit orders waiting to be executed Order blocks are identified on a chart by observing previous price action and looking for areas where the price experienced significant movement or sudden changes in direction .This indicator does that for you by using very complicated codes and helps you to take the best areas To buy and sell because it make marks at the best a
Scalper Vault
Oleg Rodin
5 (29)
Scalper Vault é um sistema profissional de escalpelamento que fornece tudo o que você precisa para um escalpelamento bem-sucedido. Este indicador é um sistema de negociação completo que pode ser usado por comerciantes de forex e opções binárias. O período de tempo recomendado é M5. O sistema fornece sinais de seta precisos na direção da tendência. Ele também fornece sinais superiores e inferiores e níveis de mercado Gann. Os indicadores fornecem todos os tipos de alertas, incluindo notificações
IX Power MT4
Daniel Stein
5 (6)
O IX Power traz finalmente a precisão imbatível do FX Power para símbolos não-Forex. Determina com exatidão a intensidade das tendências a curto, médio e longo prazo nos seus índices, acções, mercadorias, ETFs e até criptomoedas favoritos. Pode analisar tudo o que o seu terminal tem para oferecer. Experimente e veja como o seu timing melhora significativamente quando negoceia. Características principais do IX Power Resultados de cálculo 100% precisos e sem repintura - para todos os símb
Desenhe automaticamente os níveis de apoio e resistência MAIS espaços de velas de propulsão no seu gráfico, para que possa ver para onde é provável que o preço se dirija a seguir e/ou potencialmente inverta. Este indicador foi concebido para ser utilizado como parte da metodologia de negociação de posições ensinada no meu website (The Market Structure Trader) e exibe informação chave para a segmentação e potenciais entradas. Existem 2 características CORE no indicador e 4 características ad
M1 Arrow
Oleg Rodin
4.73 (15)
Uma estratégia intradiária baseada em dois princípios fundamentais do mercado. O algoritmo é baseado na análise de volumes e ondas de preços usando filtros adicionais. O algoritmo inteligente do indicador dá um sinal apenas quando dois fatores de mercado se combinam em um. O indicador calcula ondas de um determinado intervalo no gráfico M1 usando os dados do período de tempo mais alto. E para confirmar a onda, o indicador utiliza a análise por volume. Este indicador é um sistema de negociação pr
Torne-se um Negociador Breaker e lucre com as mudanças na estrutura do mercado à medida que o preço reverte. O indicador de quebra de bloco de pedidos identifica quando uma tendência ou movimento de preço está chegando à exaustão e pronto para reverter. Ele o alerta sobre mudanças na estrutura do mercado, que normalmente ocorrem quando uma reversão ou uma grande retração está prestes a ocorrer. O indicador usa um cálculo proprietário que identifica rupturas e momento do preço. Toda vez que
Mais do autor
HMA grid EA
Dorian Baranes
3.69 (13)
HMA Grid EA is a grid system which analyzes trend based on the Hull Moving Average (HMA) indicator. Unlike the Simple Moving Average (SMA) the curve of HMA attempts to give an accurate signal by minimizing lags and improving the smoothness. This EA proposes two trading strategies which combine a slow period HMA to identify the main trend and a short period HMA to identify short trend reversal movement. This combination make usually sell and buy signals accurate and in case if the trend reverse w
FREE
Double Top Tracker
Dorian Baranes
4.47 (17)
This indicator analyzes in parallel price charts for multiple currency pairs on all timeframes and notifies you as soon as a double tops or double bottoms pattern has been identified. Definition Double Top / Double Bottom pattern Double Top is a trend reversal pattern which are made up of two consecutive peaks that are more and less equal with a trough in-between. This pattern is a clear illustration of a battle between buyers and sellers. The buyers are attempting to push the security but are
This indicator is a free version of Double Top Tracker . Unlike the full version, some functions are disabled and the parameters cannot be changed. This indicator analyzes in parallel price charts for multiple currency pairs on all timeframes and notifies you as soon as a double tops or double bottoms pattern has been identified. The alert occurs when the the second peak has been reached. Double Top is a trend reversal pattern which are made up of two consecutive peaks that are more and less eq
FREE
Vino Free EA
Dorian Baranes
4.17 (18)
This EA is a free version of Vino EA . Unlike the full version, the parameters cannot be changed and the lot size is set to 0.01. Description Vino EA is a grid Expert Advisor using mainly customized oscillators to analyze the market prices and volatility in order to identify trend reversals. It uses a grid of orders which increases the lot size only after the stop loss is reached. It includes an automatic stop loss, which computes the stop loss value based on the volatility of prices. Requi
FREE
This EA is a free version of Tiger Grid which is available here:  https://www.mql5.com/en/market/product/33835 Tiger Grid EA is an expert advisor using trading strategy  which has been developed by using machine learning concepts. It has passed 14 years of backtest of real tick data and real variable spread (with commission) from 2004 to 2018. The entries are usually accurate and in case if the trend signal has a delay the positions will be managed by a smart grid system.  This system uses a g
FREE
Liongrid Free
Dorian Baranes
3.5 (2)
Note: This is a Limited Edition of   Lion Grid . It works only on Mondays. The trading strategy has been been created by using machine learning algorithms to build a model directly from the historical data. Machine learning is an application of artificial intelligence (AI) that provides the ability to automatically learn and improve from experience without being explicitly programmed.  The strategic focus of this robot is to identify trend reversals by analyzing multiple technical indicators
FREE
Vino EA
Dorian Baranes
3.67 (3)
Vino EA is a grid expert advisor using mainly customized oscillators to analyze the market prices and volatility in order to identify trend reversals. It uses a grid of orders which increases the lot size only after the stop loss is reached. Grid size can be limited for more safety. Requirements Default parameters has been optimized for EURUSD with timeframe M15 Minimum recommended deposit is $1000 for initial lot set to 0.1 ECN broker with low spread is recommended to get better results. Comp
This indicator analyzes in parallel the moving average for multiple currencies and timeframes. It sends a notification when the trends are in alignment for all timeframes. To get better assessment of the trend strength, it shows as well a ratio between the number of pips reached from the current trend and the average of pips reached from the previous trends. Features Loads automatically historical price data from broker server; Tracks all currency pairs for all timeframes in parallel; Configur
Tigergrid EA
Dorian Baranes
3.33 (3)
Tiger Grid EA is an expert advisor using trading strategy  which has been developed by using machine learning concepts. It has passed 14 years of backtest of real tick data and real variable spread (with commission) from 2004 to 2018. The entries are usually accurate and in case if the trend signal has a delay the positions will be managed by a smart grid system.  This system uses a grid of orders which increases lot size. A new order is added into the grid only if the EA notice a potential reve
Filtro:
zofesu
350
zofesu 2023.03.23 15:47 
 

Easy to use

Cristian Mantovani
2907
Cristian Mantovani 2022.11.04 08:10 
 

Very intuitive

John Winsome Munar
3471
John Winsome Munar 2022.06.14 14:17 
 

Good indicator. MACD is visualized clearly.

Charlie Zboncak
75
Charlie Zboncak 2022.05.20 15:46 
 

Nice indicator

08033337080
24
08033337080 2021.11.24 09:24 
 

MACD is a great tool but I am having a challenge loading it on my chart. occassionally it loads but gets removed. what should I do? (ahmedobiora@gmail.com)

Keith Hodges
54
Keith Hodges 2021.09.09 02:39 
 

Great

Mohammadsaeid Khezripour Gharaei
134
Mohammadsaeid Khezripour Gharaei 2021.08.26 01:41 
 

This is really Great and... Thanks a lot, specially for your high nature and generosity by sharing your efforts outcome to everyone freely...!

akberetamare
110
akberetamare 2021.07.15 18:51 
 

Hello. This is great! I would like to ask if you happen to have EA for this indicator or alerts. Thanks.

moonpie 84
1291
moonpie 84 2020.12.04 04:07 
 

A+ Great adaptation of MACD

Valentin Butorin
4124
Valentin Butorin 2020.11.04 12:46 
 

Nice!

MAKARIOS YACOUBIAN
2911
MAKARIOS YACOUBIAN 2020.10.23 08:43 
 

GOOD IDEA TO IMPLEMENT MACD ON CANDLE TO REDUCE THE GRAPHIC , GOOD JOB

Responder ao comentário