Dinapoli Package MT4
- Indicadores
- Samil Bozuyuk
- Versão: 1.0
- Ativações: 15
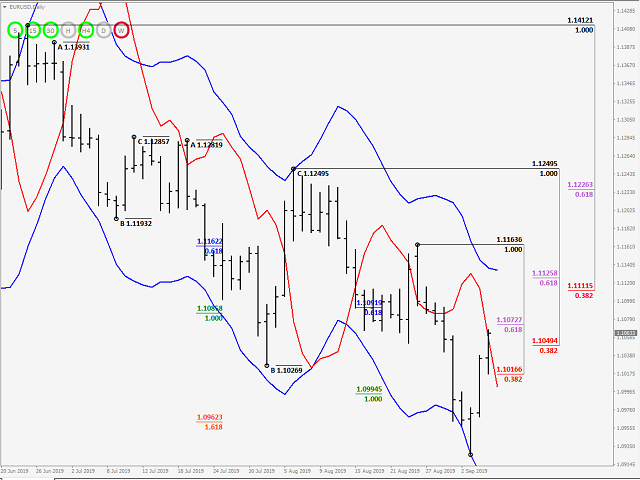
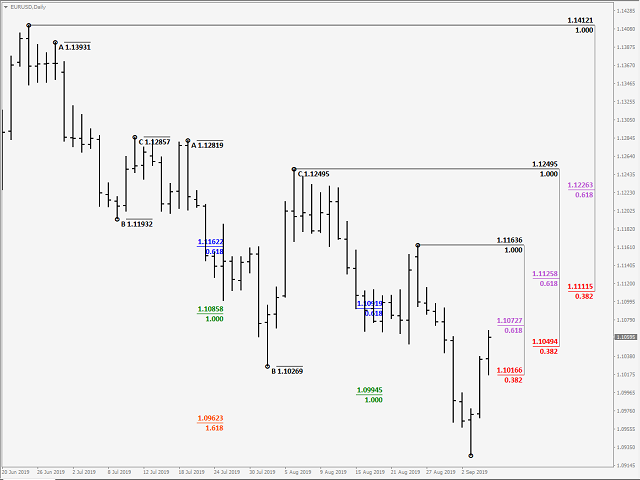
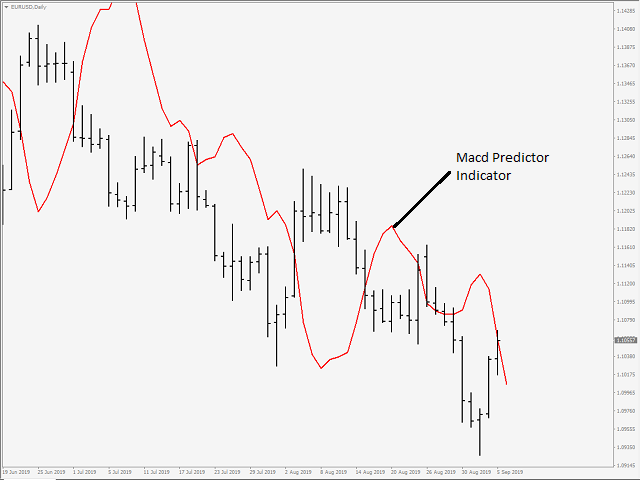
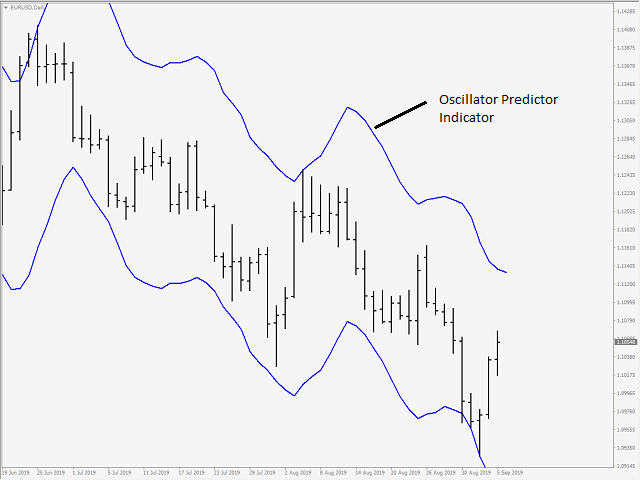
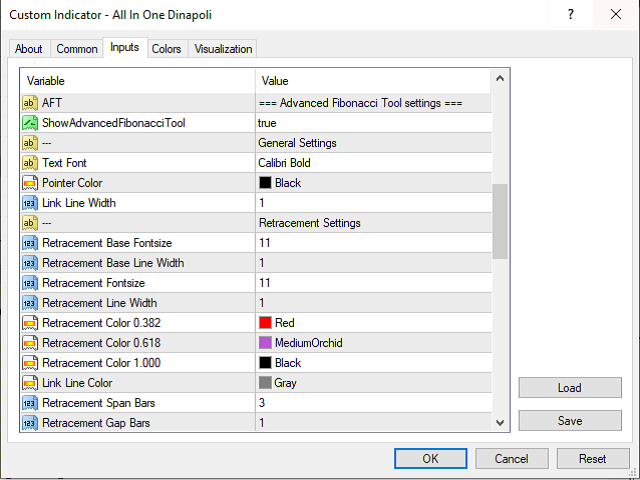
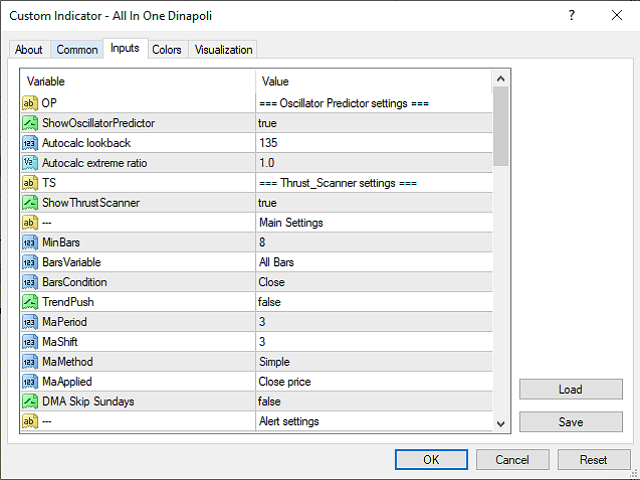
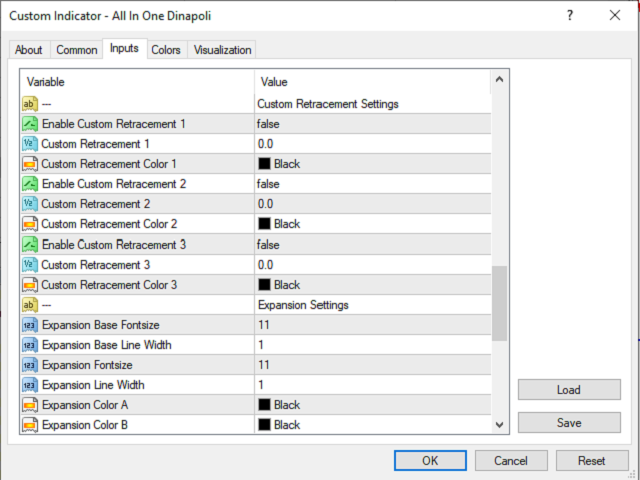
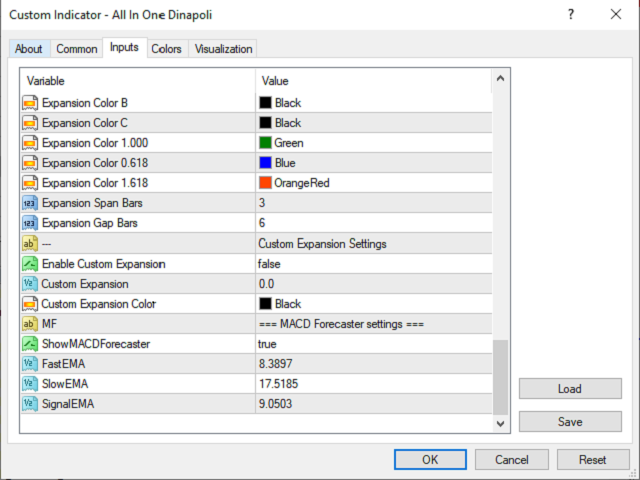
All in One package includes the Oscillator Predictor, MACD Predictor, Thrust Scanner and Advanced Fibonacci indicators which are mandatory for applying Dinapoli trade plans.
Please visit below links for detailed explanations of indicators.
Advanced Fibonacci Indicator => https://www.mql5.com/en/market/product/52834
Thrust Scanner Indicator => https://www.mql5.com/en/market/product/52830
Overbought /Oversold Predictor indicator => https://www.mql5.com/en/market/product/52621
Macd Predictor => https://www.mql5.com/en/market/product/52621
For MT5 Version; please visit ► https://www.mql5.com/en/market/product/52631
For My Other Products; please visit ► https://www.mql5.com/en/users/samil34

The accuracy of these indicators are superb. This is my primary set of indicators I use intraday and nothing else compares.