AutoSignals Trend Panel
- Indicadores
- Danilo Maia Siqueira
- Versão: 1.0
- Ativações: 9
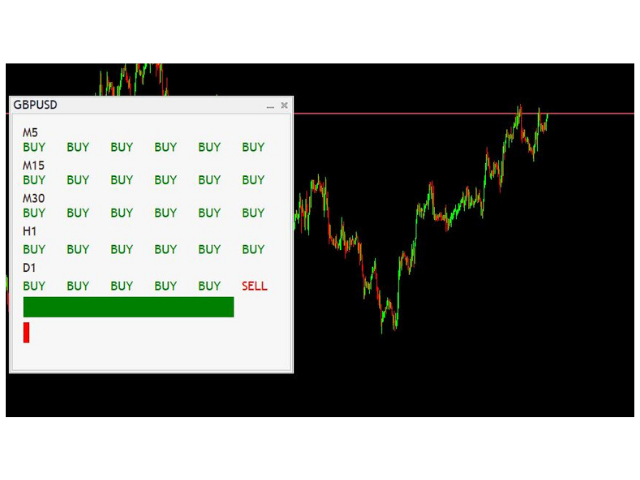
O indicador rastreia a tendência em 5 tempos gráficos diferentes do mesmo ativo, tendo como base 6 sinais par cada tempo gráfico.
O indicador tem como principal objetivo, nos mostrar a tendência majoritária do ativo financeiro em que ele foi colocado. O sistema passa as informações das tendências em diversos tempos gráficos, dessa forma o usuário consegue ter uma visão ampla do movimento do ativo, este tipo de ferramenta faz com que o usuário tenha uma maior taxa de acerto pelo fato de auxiliar o operador a executar ordens a favor da tendência.