• Visão global
  • Comentários (3)
  • Discussão (2)

Channel Cluster

5
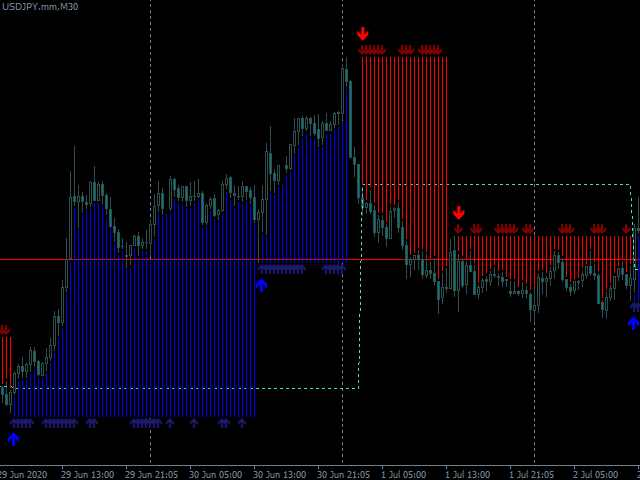
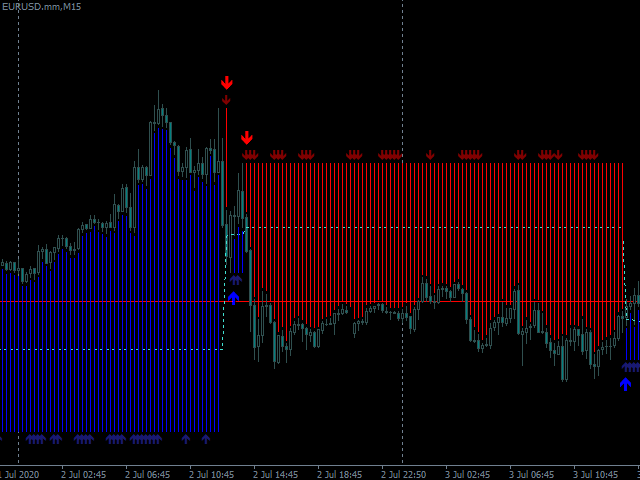
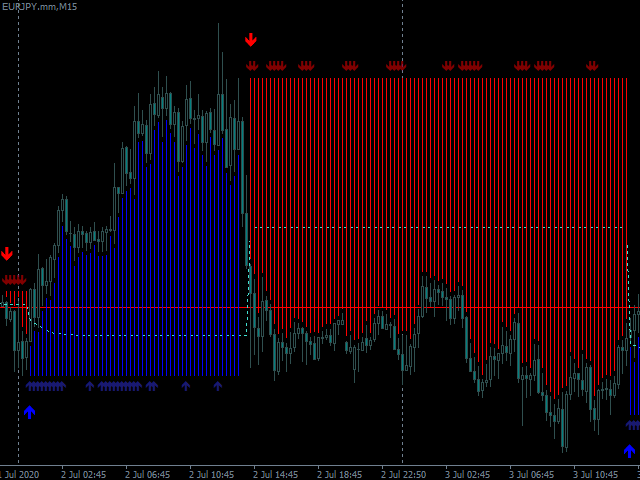
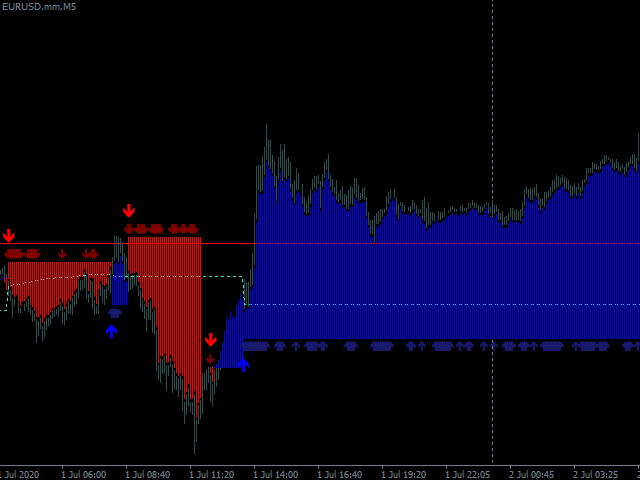
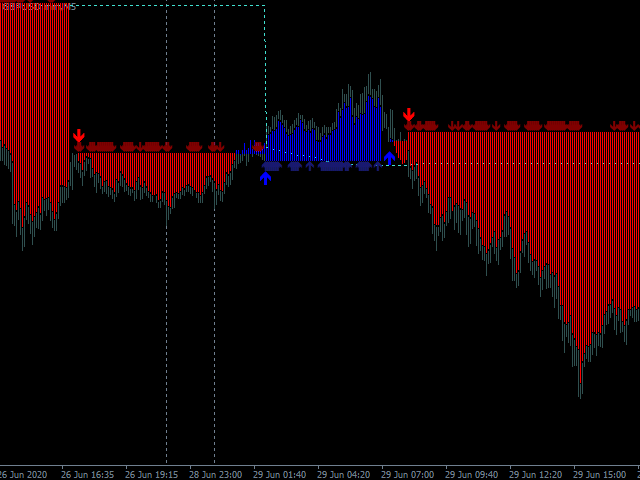
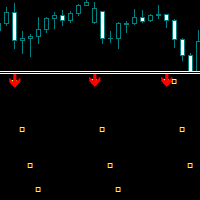
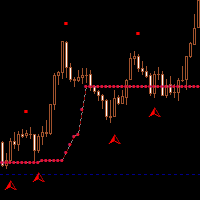
Cluster indicator working in the price channel. For operation, the indicator builds a channel line - (dashed line).
Inside the channel, cluster sections are determined that determine the direction of the price movement - (histograms in two directions),
start with large arrows. Small arrows are plotted above / below each histogram - indicator increase volatility.
  1. The indicator does not redraw the values.
  2. Works on any tools and timeframes.
  3. Entrances are made when large arrows appear, inside small arrows you can make scalper entrances, when small arrows disappear - make exits.

Input parameters

  • Channel Period - Period of the price channel (from 20)
  • Cluster Length
  • Histogram Thickness
  • Alerts for signals
  • Play sound
  • Display pop-up message
  • Send push notification
  • Send email
  • Sound file
  • Number Bars - The number of indicator bars on the chart


Comentários 3
vladimirsavitsky
49
vladimirsavitsky 2020.07.29 12:08 
 

Спасибо огромное хороший индикатор))))

Produtos recomendados
Momentum Close
Akaashi Videsh Reedoy
Momentum Close is a useful tool to identify volume based on the strength of a candle close. A strong candle close is when there is a small wick in comparison to the candle body and is a sign that the market will continue in that direction. *This is a NON-repainting indicator* How this can help you? Identify trend strength  Trend confirmation Seeing potential reversals (strong rejection candle) Developing entry and exit strategies Strong confluence to add to your strategy Volume analysis Feat
Average Daily Weekly Monthly Range Alerts. The most complete multi-period dynamic range indicator with full alert options. Visually displays the Average Range lines on chart + real time distances to the Range Highs and Lows. Notifications are sent when the average ranges are hit. An essential tool for any serious trader! Average period ranges, especially the ADR (Average Daily Range) for day traders, are one of the most useful and consistently reliable indicators available to traders. Always a
New, more accurate version of the Xmaster indicator. More than 200 traders from around the world have conducted more than 15,000 tests of different combinations of this indicator on their PCs in order to get the most effective and accurate formula. And here we present to you the "Xmaster formula indicator forex no repaint" indicator, which shows accurate signals and does not repaint. This indicator also sends signals to the trader by email and push. With the arrival of each new tick, it constan
Gioteen Volatility Index (GVI)   - your ultimate solution to overcoming market unpredictability and maximizing trading opportunities. This revolutionary indicator helps you in lowering your losing trades due to choppy market movements. The GVI is designed to measure market volatility, providing you with valuable insights to identify the most favorable trading prospects. Its intuitive interface consists of a dynamic red line representing the volatility index, accompanied by blue line that indicat
Our new indicator is an important part of the Smart Money Concepts (SMC) system It uses a modern market vision and fast calculation methods. As a result, the trader has a complete picture of the trade at every moment in time, which makes the process of obtaining results easier and faster. Our new indicator displays the following important patterns:   Order Blocks. Imbalance – Fair Value Gap (FVG). Break Of Structures (BoS). Change of character (CHoCH). Equal highs & lows. Premium , Equili
CHART OBJECTS: Blue box : Bullish Order Blocks (OB) Red box : Bearish OB Orange box : Mitigated OB. Price bounce from this area the made a new high/low Light gray box : Price bounced from this area but did not made a new high/low Dark gray box : Broken OB.  Filled boxes : TimeFrame 1 Order Blocks Unfilled boxes : TimeFrame 2 Order Blocks INDICATOR SETTINGS: Order Block Required Length:  Required number of subsequent candles in the same direction to identify Order Block.   Default value: 5 Im
O Apollo Price Action System é um indicador totalmente baseado no princípio Price Action. O indicador dá um sinal para comprar ou vender assim que as condições para entrar no mercado forem formadas de acordo com a estratégia do indicador. O indicador pode ser usado como um sistema de negociação básico ou como um complemento ao seu próprio sistema de negociação. Este indicador é muito fácil de usar. Solo tienes que seguir las señales. O indicador mostra linhas de tendência no gráfico, como pontos
Trend Scanner looks at the Market watchlist and Checks to see if there are trending cases between three (3) timeframes selected by the user. The analysis can assist in finding pairs to focus on for a particular session where a trader may need to have a bias in terms of direction to place trades for a particular system which requires multiple timeframe filtration of bar momentum. 3 Main indicators are involved: Moving Average, MACD and Heiken Ashi. User is able to select timeframes available on
MonsterDash Harmonic Indicator is a harmonic pattern dashboard. It recognizes all major patterns. MonsterDash is a dashboard that displays all detected patterns for all symbols and (almost) all timeframes in sortable and scrollable format. Users can add their own user defined patterns . MonsterDash can open and update charts with the pattern found. Settings MonsterDash's default settings are good enough most of the time. Feel free to fine tune them to your needs. The color settings are for tho
MarketProfile EForex
Veridiana Adorno Kendrick
O Perfil de Mercado Mostra onde o preço passou mais tempo, destacando níveis importantes que podem ser usados na negociação. É uma ferramenta poderosa que se destina a reunir os componentes fundamentais que compõem cada mercado; preço / volume / tempo, e exibir visualmente sua relação em tempo real à medida que o mercado se desenvolve por um período de tempo pré-determinado. Ferramenta muito poderosa!
Trading Indicator Lab’s Candle Volume Heatmap for MT4 merges volume with price by applying gradient-colored dots on the bars. It can also detect bars that have the most volume and the least volume. Gradient Coloring When applied to a chart, the Candle Volume Heatmap indicator applies colored dots to each bar which may vary according to its volume. The chart becomes a heatmap where you can easily spot which parts of the bar history are “hottest” or the bars that had the greatest number of volume
ATR Line MT4
Evgeny Levchenko
The indicator - "ATR Line" determines the current trend and gives signals to buy (green arrow to the top) or sell (red arrow to the bottom). The indicator calculation is based on the deviation of the average price of the instrument from its average true range - ATR. The moving average of prices is used to reduce "market noise". If the main line of the indicator - "ATR Line" is lower the instrument price chart, then the market is in a "bullish" trend. If the main line of the indicator is higher t
Liquidity Buy Sell Signal Indicator is a no-nonsense, no delay, no repaint indicator ! Liquidity pools together with a trend filter is the most powerful and reliable signal according to me (with the correct parameters depending on the timeframe used) It selects buy/sell entry signals based on liquidity in the market. The time range to scan for liquidity can be set in the parameters. Liquidity is an important aspect in the market, especially for institutional investors, as they need lots of liqu
ADX Color
Dmitriy Moshnin
This indicator is different from the conventional indicator by an additional set of parameters. The ADX line changes color depending on the location of the +DI and -DI lines relative to each other. Indicator Inputs Period — indicator calculation period; Method — select the averaging method: simple, exponential, smoothed, linear-weighted; Apply to — select the applied price: Close, Open; High; Low; Median; Typical; Average Weighted; By default, the directional lines are colored in the following
We present you the indicator "Candle closing counter", which will become your indispensable assistant in the world of trading. That’s why knowing when the candle will close can help: If you like to trade using candle patterns, you will know when the candle will be closed. This indicator will allow you to check if a known pattern has formed and if there is a possibility of trading. The indicator will help you to prepare for market opening and market closure. You can set a timer to create a p
Shows the direction of the bars on all major timeframes. My #1 Utility : 65+ features, including this indicator     |     Version for MT5 The meaning of the visual signals ( squares): Red : Close price is  lower  than the Open price: Close < Open;  Green : Close price is  higher  than the Open price: Close > Open; Blue : Close price is  equal  to the Open price: Close = Open; You can set the Shift of the calculated bar, relative to the current bar: Shift = 0: the direction of the currenttly
ZigZag Professional
Dmitriy Kashevich
5 (1)
the zigzag indicator draws lines on the chart from the highest point to the lowest There are built-in fibonacci levels built-in sound alert the indicator highlights trends on small timeframes with a thin line and trends highlights with a coarse line Fibonacci levels can be turned on and off in the settings settings are very simple and clear the same sound alert can be turned on and off, you can change the colors of the lines.
Indicator of fractals with adjustable indents. Designed according to an original simplified algorithm for use in EA. The main ones in the indicator are lines showing the levels of the current fractals, which allows you to read the values ​ ​ of the last fractal in one operation. It works on a closed bar, so it does not redraw and does not load the terminal with calculations. It should be understood that the indicator is late with the detection of the fractal by the number of bars on the r
Presenting the uGenesys Break of Structure and Change of Character Indicator The uGenesys Market Structure Indicator is the advanced solution designed specifically for forex traders seeking a competitive edge. This innovative tool goes beyond merely identifying Break of Structure (BoS) and Change of Character (CHoC); it also illuminates optimal entry and exit points on your forex charts, transforming your trading experience.  While the uGenesys Market Structure Indicator can reveal pivotal pa
The indicator detects and displays Shark harmonic pattern (see the screenshot). The pattern is plotted by the extreme values of the ZigZag indicator (included in the resources, no need to install). After detecting the pattern, the indicator notifies of that by a pop-up window, a mobile notification and an email. The indicator highlights the process of the pattern formation and not just the complete pattern. In the former case, it is displayed in the contour triangles. After the pattern is comple
Enhance your price action strategy: inside bar breakouts at your fingertips This indicator detects inside bars of several ranges, making it very easy for price action traders to spot and act on inside bar breakouts. [ Installation Guide | Update Guide | Troubleshooting | FAQ | All Products ] Easy to use and understand Customizable color selections The indicator implements visual/mail/push/sound alerts The indicator does not repaint or backpaint An inside bar is a bar or series of bars which is/
Bermaui RSI Candles
Muhammad Elbermawi
5 (4)
A ideia desse indicador é desenhar o RSI na forma de velas que podem ser comparadas com gráficos de preços para gerar sinais de compra e venda. O indicador não é invenção minha. Eu o fundei na internet há vários anos. Atualizei o código, adicionei funções de alerta, adicionei o grupo de ferramentas Bermaui Utilities. O indicador calcula o RSI de todos os preços usados para desenhar velas (RSI de abertura, alta, baixa e fechamento). Ele usa o mais alto deles para desenhar o pavio alto das velas
Market Trend Catcher indicator analyzes the duration of trend movements and, with a certain development of the current trend, offers market entry points in the form of arrows with recommended profit targets. The indicator is very easy to use and does not require a lot of information to understand how it works. It has a minimum of settings and is transparent in understanding the principle of its operation, fully displaying the information on the basis of which it makes decisions on recommending e
Dollar mint indicator is a special workmanship with years of experience in forex.   Dollar mint ea is a fully non repaint indicator optimised with price action data such that once it gives you a signal t . The indicator   can be used to trade anything on the mt4 with much ease. Benefits ; Fully non repaint Use in any timeframe Use in all the available tradable assets on mt4 Best to use on h4. It generates fully analysed buy and sell signals based on trend and also filters out retracement
Elite Renko
Jermaine Wedderburn
5 (2)
Renko Charts with Heiken Ashi Filter now have the alerts and the    Win-rate . Now you can know which signal will give you that edge your trading needs. Risk to Reward Settings  Wins versus Losses Count There are four alert types to choose from for notification on screen, email or phone notification. The alert types also have buffers for use with automation. This indicator can be incorporated with any system that requires renko charts. The four (4) alert types are: Three-bar Formation ;  Pinbar
In the world of trading, one of the main concerns is finding a reliable trading system. Meet the TrendEdge Channel indicator - your reliable companion in this search. Developed based on complex mathematical calculations, this indicator predicts the most likely short-term price movements. TrendEdge Channel is designed specifically to identify trends in price movements. Thanks to it, you can quickly determine not only the direction of the trend, but also the levels of interaction between buyers
Introduction It is common practice for professional trades to hide their stop loss / take profit from their brokers. Either from keeping their strategy to the themselves or from the fear that their broker works against them. Using this indicator, the stop loss / take profit points will be drawn on the product chart using the bid price. So, you can see exactly when the price is hit and close it manually.  Usage Once attached to the chart, the indicator scans the open orders to attach lines fo
A formidable ally for historical testing with Fixed Perspective through ZigZag and Dow Theory, while also supporting ReviewCandleChart. A recommended tool for those troubled by 'lost perspectives. Overview The 'RCCZigZagDow' indicator is a tool that assists in making judgments based on Dow Theory in relation to ZigZag waves. By using ZigZag waves as a basis to derive continuation points according to Dow Theory, it offers the advantage of ensuring that anyone can interpret trends in the same
This indicator is another variant of the famous powerful indicator Fibonacci-SS https://www.mql5.com/en/market/product/10136 but has different behaviour in placing Pending Order and TP Line. Automatically places Fibonacci retracement lines from the last highest and lowest visible bars on the chart with: An auto Pending Order (Buy/Sell). Taking Profit 1, Taking Profit 2 is pivot point and Taking Profit 3 for extended reward opportunity. The best risk and reward ratio. Simple and powerful indica
Key level wedge pro
Presley Annais Tatenda Meck
5 (1)
We have combined all of our beloved indicators the likes of: Key level order block , Key level supply and demand , Key level liquidity grab and Key level wedge into one single indicator and dashboard. Whats new Dashboard : There is an easy access dashboard for all your needs. Multi-timeframe button : There is now a multi-timeframe option for Order Blocks and Supply and demand zones, making it easy to see higher timeframe zones easily on the current timeframe by just clicking the desired timefr
Os compradores deste produto também adquirem
TPSproTREND PrO
Roman Podpora
4.79 (19)
TPSpro TREND PRO   é um indicador de tendência que analisa automaticamente o mercado e fornece informações sobre a tendência e cada uma de suas mudanças, além de dar sinais para entrar em negociações sem redesenhar! O indicador utiliza cada vela, analisando-as separadamente. referindo-se a diferentes impulsos - impulso para cima ou para baixo. Pontos de entrada exatos em transações de moedas, criptomoedas, metais, ações, índices! Versão MT5                   DESCRIÇÃO COMPLETA DO INDICADOR    
TPSpro RFI Levels
Roman Podpora
4.82 (22)
INSTRUÇÕES         Russo   -        ENG       R   ecomendado para uso com um indicador       -       TPSpro   TREND PRO -   Versão MT4         Um elemento-chave na negociação são as zonas ou níveis a partir dos quais as decisões de comprar ou vender um instrumento de negociação são tomadas. Apesar das tentativas dos principais participantes de esconder sua presença no mercado, eles inevitavelmente deixam rastros. Nossa tarefa era aprender como identificar esses rastros e interpretá-los corretame
LEIA AS INFORMAÇÕES ABAIXO ANTES DE COMPRAR O PRODUTO! Apollo Pips PLUS SP é um produto único! É PARA QUEM QUER ADQUIRIR MEU NOVO INDICADOR "APOLLO PIPS" MAIS BÔNUS "SUPER PACK" COM ACESSO A TODOS OS MEUS INDICADORES DE NEGOCIAÇÃO! Ao adquirir o produto Apollo Pips PLUS SP você está na verdade adquirindo uma versão absolutamente nova do meu indicador Apollo Pips. Esta versão do indicador possui um algoritmo aprimorado e um parâmetro fácil de usar que lhe dá a oportunidade de usar o indicador em
FX Volume
Daniel Stein
4.58 (33)
Receba a sua atualização diária do mercado com detalhes e screenshots através do nosso Morning Briefing aqui no mql5 e no Telegram ! O Volume FX é o PRIMEIRO e ÚNICO indicador de volume que fornece uma visão REAL do sentimento do mercado do ponto de vista de um corretor. Ele fornece uma visão incrível de como os participantes do mercado institucional, como corretores, estão posicionados no mercado Forex, muito mais rápido do que os relatórios COT. Ver essas informações diretamente no seu gráfi
TrendMaestro
Stefano Frisetti
5 (3)
note: this indicator is for METATRADER4, if you want the version for METATRADER5 this is the link:  https://www.mql5.com/it/market/product/108106 TRENDMAESTRO ver 2.4 TRENDMAESTRO recognizes a new TREND in the bud, he never makes mistakes. The certainty of identifying a new TREND is priceless. DESCRIPTION TRENDMAESTRO identifies a new TREND in the bud, this indicator examines the volatility, volumes and momentum to identify the moment in which there is an explosion of one or more of these data a
FX Power MT4 NG
Daniel Stein
5 (13)
Receba a sua atualização diária do mercado com detalhes e screenshots através do nosso Morning Briefing aqui no mql5 e no Telegram ! O FX Power MT4 NG é a próxima geração do nosso medidor de força de moeda muito popular de longa data, o FX Power. E o que é que este medidor de força da próxima geração oferece? Tudo o que adorou no FX Power original MAIS Análise de força GOLD/XAU Resultados de cálculo ainda mais precisos Períodos de análise configuráveis individualmente Limite de cálculo personal
Atomic Analyst
Issam Kassas
5 (2)
Primeiramente, vale ressaltar que este Indicador de Negociação não repinta, não redesenha e não apresenta atrasos, tornando-o ideal tanto para negociação manual quanto automatizada. Manual do utilizador: configurações, entradas e estratégia. O Analista Atômico é um Indicador de Ação de Preço PA que utiliza a força e o momentum do preço para encontrar uma vantagem melhor no mercado. Equipado com filtros avançados que ajudam a remover ruídos e sinais falsos, e aumentam o potencial de negociação.
Este painel mostra os últimos padrões harmónicos disponíveis para os símbolos seleccionados, pelo que poupará tempo e será mais eficiente / versão MT5 . Indicador gratuito: Basic Harmonic Pattern Colunas do indicador Symbol : aparecem os símbolos seleccionados Trend : de alta ou de baixa Pattern : tipo de padrão (gartley, borboleta, morcego, caranguejo, tubarão, cifra ou ABCD) Entry : preço de entrada SL: preço de paragem de perda TP1: preço do 1º take profit TP2: preço do 2º take profit TP
Dynamic Forex28 Navigator
Bernhard Schweigert
5 (2)
Dynamic Forex28 Navigator - A ferramenta de negociação Forex de última geração. ATUALMENTE 49% DE DESCONTO. Dynamic Forex28 Navigator é a evolução dos nossos indicadores populares de longa data, combinando o poder de três em um: Indicador Advanced Currency Strength28 (695 avaliações) + Advanced Currency IMPULSE com ALERTA (520 avaliações) + Sinais CS28 Combo (Bônus). Detalhes sobre o indicador https://www.mql5.com/en/blogs/post/758844 O que o Next-Generation Strength Indicator oferece?  T
Enigmera
Ivan Stefanov
5 (3)
ENIGMERA: O núcleo do mercado https://www.enigmera.com Introdução Este indicador e sistema de negociação é uma abordagem notável aos mercados financeiros. ENIGMERA utiliza os ciclos fractais para calcular com precisão os níveis de suporte e resistência. Mostra a autêntica fase de acumulação e dá direcções e objectivos.  Um sistema que funciona quer estejamos numa tendência ou numa correção.  Como é que funciona? O ENIGMERA é composto por três linhas: a linha de suporte/resistência, a linha
How to use Pair Trading Station Pair Trading Station is recommended for H1 time frame and you can use it for any currency pairs. To generate buy and sell signal, follow few steps below to apply Pair Trading Station to your MetaTrader terminal. When you load Pair Trading Station on your chart, Pair Trading station will assess available historical data in your MetaTrader platforms for each currency pair. On your chart, the amount of historical data available will be displayed for each currency pai
Este indicador é um indicador para análise automática de ondas que é perfeito para negociações práticas! Caso... Nota:   Não estou acostumado a usar nomes ocidentais para classificação de ondas. Devido à influência da convenção de nomenclatura de Tang Lun (Tang Zhong Shuo Zen), nomeei a onda básica como   uma caneta   e a banda de onda secundária como   um segmento   . ao mesmo tempo, o segmento tem a direção da tendência.   O segmento de tendência principal   é nomeado (esse método de nomenc
Apresentando       Quantum Trend Sniper Indicator   , o inovador Indicador MQL5 que está transformando a maneira como você identifica e negocia as reversões de tendência! Desenvolvido por uma equipe de traders experientes com experiência comercial de mais de 13 anos,       Indicador de Atirador de Tendência Quântica       foi projetado para impulsionar sua jornada de negociação a novos patamares com sua forma inovadora de identificar reversões de tendência com precisão extremamente alta. ***C
PZ Day Trading
PZ TRADING SLU
3.67 (3)
Este indicador detecta reversões de preços em zigue-zague, usando apenas análise de ação de preços e um canal donchiano. Ele foi projetado especificamente para negociações de curto prazo, sem repintar ou retroceder. É uma ferramenta fantástica para traders astutos, com o objetivo de aumentar o tempo de suas operações. [ Guia de instalação | Guia de atualização | Solução de problemas | FAQ | Todos os produtos ] Surpreendentemente fácil de negociar Fornece valor em cada período de tempo Imple
Oscilador de Tendência: Identificação Suave e Confiável de Tendências de Mercado Oscilador de Tendência é um indicador avançado para MT4, projetado para ajudar os traders a identificar com precisão a direção da tendência e possíveis pontos de reversão. Com uma representação visual intuitiva, este indicador mostra claramente quando o mercado está em tendência de alta ou de baixa, simplificando a análise e melhorando a leitura do gráfico. É adequado para uma ampla variedade de mercados e períodos
O FX Levels é um indicador de suporte e resistência excecionalmente preciso que funde o método tradicional do Lighthouse com uma abordagem dinâmica inovadora, funcionando sem falhas em todos os símbolos de negociação. Isto inclui pares de moedas, índices, acções ou mercadorias. O FX Levels identifica pontos de inversão e apresenta-os no gráfico, que podem ser utilizados de forma ideal como objectivos de lucro nas suas actividades de negociação. Ao desenvolver o FX Levels, usámos a nossa vasta e
(Currently 30% OFF) Before reading the description of this indicator, I just want to introduce to you following concept Moving Average Line - Typical moving average which is based on one chart alone.  Currency Strength Line - The moving average of a certain pair in which the strength is based on 28 pairs. Can be said as the real moving average line. Moving Average indeed is one of the most popular indicator which almost every trader use. Currency Strength Meter is also a trend indicator whic
Actualmente 20% OFF ! A melhor solução para qualquer novato ou comerciante especializado! Este software de painel de instrumentos está a funcionar em 28 pares de moedas. É baseado em 2 dos nossos principais indicadores (Advanced Currency Strength 28 e Advanced Currency Impulse). Dá uma grande visão geral de todo o mercado Forex. Mostra valores avançados de força da moeda, velocidade de movimento da moeda e sinais para 28 pares de divisas em todos os (9) períodos de tempo. Imagine como a sua
Entry Points Pro
Yury Orlov
4.62 (175)
Este é um indicador para MT4 que fornece sinais precisos para entrar em uma negociação sem redesenhar. Ele pode ser aplicado a qualquer ativo financeiro: forex, criptomoedas, metais, ações, índices. Ele fornecerá estimativas bastante precisas e informará quando é melhor abrir e fechar um negócio. Assista o vídeo (6:22) com um exemplo de processamento de apenas um sinal que compensou o indicador! A maioria dos traders melhora seus resultados de negociação durante a primeira semana de negociação c
System Trend Pro
Aleksandr Makarov
5 (2)
System Trend Pro - This is the best trend trading indicator!!! The indicator no repaint!!!   The indicator has   MTF   mode, which adds confidence to trading on the trend (   no repaint   ). How to trade? Everything is very simple, we wait for the first signal (big arrow), then wait for the second signal (small arrow) and enter the market in the direction of the arrow. (See screens 1 and 2.) Exit on the opposite signal or take 20-30 pips, close half of it, and keep the rest until the oppo
Currency Strength Exotics
Bernhard Schweigert
4.87 (31)
ACTUALMENTE 20% DE DESCONTO ! A melhor solução para qualquer novato ou comerciante especializado! Este Indicador é especializado para mostrar a força da moeda para quaisquer símbolos como Pares Exóticos de Commodities, Índices ou Futuros. É o primeiro do seu género, qualquer símbolo pode ser adicionado à 9ª linha para mostrar a verdadeira força da moeda de Ouro, Prata, Petróleo, DAX, US30, MXN, TRY, CNH etc. Esta é uma ferramenta de negociação única, de alta qualidade e acessível, porque in
Indicador único que implementa uma abordagem profissional e quantitativa para significar negociação de reversão. Ele capitaliza o fato de que o preço desvia e retorna à média de maneira previsível e mensurável, o que permite regras claras de entrada e saída que superam amplamente as estratégias de negociação não quantitativas. [ Installation Guide | Update Guide | Troubleshooting | FAQ | All Products ] Sinais de negociação claros Incrivelmente fácil de negociar Cores e tamanhos personalizáveis
Apresentamos o ON Trade Waves Patterns Harmonic Elliot Wolfe, um indicador avançado projetado para detectar diversos tipos de padrões no mercado, usando métodos manuais e automáticos. Aqui está como ele funciona: Padrões Harmônicos: Este indicador pode identificar padrões harmônicos que aparecem em seu gráfico. Esses padrões são essenciais para traders que praticam a teoria de negociação harmônica, conforme popularizada no livro de Scott Carney "Harmonic Trading vol 1 e 2". Seja desenhando-os m
Alright. This indicator works on MT4 and is very easy to use. When you receive a signal from it, you wait for that candle with the signal to close and you enter your trade at the beginning of the next new candle. A red arrow means sell and a green arrow means buy. All arrows comes with Popup Alert like for easy identification of trade signal. Are you okay with that?   100% non repaint Work All Major currency  Pair,  1 minute time frame 1 minute expire
A VELOCIDADE DE TRANSAÇÃO é o indicador da mais alta qualidade que mostra onde e quando grandes ordens se acumulam no mercado e os benefícios disso. Detecta mudanças de tendência numa fase muito precoce. É simultaneamente um indicador e um sistema de negociação. O conceito é único e incrivelmente lucrativo. No Forex, o volume de ticks é erroneamente chamado de volume. Na verdade, é a variação de preço por unidade de tempo, que de facto é a VELOCIDADE DE TRANSAÇÃO. Este indicador revê completa
Up down v6T
Guner Koca
5 (2)
Thise indicator is up down v6  comes with tradingwiev pinescript. purchased people, after installed on terminal ,contact me on mql5  to get BONUS  TradingView pinescript. up-down indicator is no repaint and works all pairs and lower than weekly time frames charts. it is suitable also 1 m charts for all pairs. and hold long way to signal. dont gives too many signals. when red histogram cross trigger line that is up signal.and price probably will down when blue histogram cross trigger line that
Gold Channel   é um indicador baseado na volatilidade, desenvolvido com um algoritmo de tempo especifico para o par XAUUSD que consiste em encontrar possíveis correções no mercado. Este indicador mostra duas linhas exteriores, uma interior (linha de retração) e um sinal de seta, onde a teoria do canal consiste em ajudar a identificar condições de sobrecompra e sobrevenda no mercado. O preço do mercado cairá geralmente entre os limites do canal. Se os preços tocarem ou se moverem para fora do can
Gann Swing Structure
Kirill Borovskii
5 (1)
This indicator is based on the mathematics of the great trader W.D. Ganna. With its help, you can easily find strong levels by analyzing swings to find the optimal entry point. The indicator works on all instruments and all timeframes. The indicator is fully manual and has control buttons. All you need to do is press the NEW button, a segment will appear, which you can place on any movement, swing or even 1 candle that you want to analyze. By placing the segment, press the OK button. A grid (th
Indicador cíclico para negociação e previsão da direção do mercado. Mostra o comportamento cíclico do preço sob a forma de um oscilador. Emite sinais para a abertura de negociações quando se verifica uma recuperação dos limites superior e inferior do oscilador. Sob a forma de histograma, mostra a força suavizada da tendência.  Complementará qualquer estratégia de trading, desde o scalping ao intradiário.  O indicador não é redesenhado.  Adequado para utilização em todos os símbolos/instrumen
TPA True Price Action indicator reveals the true price action of the market makers through 100% non-repainting signals (except early signals mode) strictly at the close of a candle! TPA shows entries and re-entries, every time the bulls are definitely stronger than the bears and vice versa. Not to confuse with red/green candles. The shift of power gets confirmed at the earliest stage and is ONE exit strategy of several. There are available now two free parts of the TPA User Guide for our custo
Mais do autor
Indicador cíclico para negociação e previsão da direção do mercado. Mostra o comportamento cíclico do preço sob a forma de um oscilador. Emite sinais para a abertura de negociações quando se verifica uma recuperação dos limites superior e inferior do oscilador. Sob a forma de histograma, mostra a força suavizada da tendência.  Complementará qualquer estratégia de trading, desde o scalping ao intradiário.  O indicador não é redesenhado.  Adequado para utilização em todos os símbolos/instrumen
Volatility Trend System - é um sistema de negociação que fornece sinais para entradas. O sistema de volatilidade fornece sinais lineares e pontuais na direção da tendência, bem como sinais para sair dela, sem redesenhar ou atrasos. O indicador de tendência monitora a direção da tendência de médio prazo, mostra a direção e sua mudança. O indicador de sinal é baseado em mudanças na volatilidade e mostra as entradas no mercado. O indicador está equipado com diversos tipos de alertas. Pode se
Indicador para negociação manual e análise técnica para Forex. Consiste em um indicador de tendência com o nível de abertura do dia de negociação e um indicador de seta para determinar os pontos de entrada. O indicador não muda de cor; funciona quando a vela fecha. Contém vários tipos de alertas para setas de sinalização. Pode ser configurado para funcionar em qualquer gráfico, instrumento de negociação ou período de tempo. A estratégia de trabalho baseia-se na busca de movimentos de pr
A technical indicator that calculates its readings based on trading volumes. It has an oscillatory line that follows the change in volumes. Large arrows on the line indicate reversal values. A channel is built around the line with small arrows showing the strengthening of price movement in the direction of increasing volumes. The indicator does not redraw values. Works on any instrument and timeframe. It can complement any trading strategy by finding a trend or make entries in the direction of
Volatility Trend System - um sistema de negociação que dá sinais para entradas. O sistema de volatilidade fornece sinais lineares e pontuais na direção da tendência, bem como sinais para sair dela, sem redesenho e atrasos. O indicador de tendência monitora a direção da tendência de médio prazo, mostra a direção e sua mudança. O indicador de sinal é baseado em mudanças na volatilidade e mostra entradas no mercado. O indicador está equipado com vários tipos de alertas. Pode ser aplicado a vários i
Candle Binary Scalper é um produto de análise técnica para forex e opções binárias. Inclui vários indicadores técnicos combinados em um sistema de negociação. Adequado para negociação manual dentro de uma tendência, para escalpelamento e opções binárias. Funciona em todos os prazos e instrumentos de negociação. Prazos recomendados para negociação M15, M30, H1 e H4, M5 e M1 devem ser usados ​​em caso de alta volatilidade. Existem vários tipos de alertas. Como usar o produto As configuraçõ
O indicador " ZigZag on Trend " é um assistente na determinação da direção do movimento dos preços, bem como uma calculadora de barras e pips. É composto por um indicador de tendência que monitora a direção do preço com uma linha de tendência apresentada em forma de zigue-zague e um contador que calcula o número de barras passadas na direção da tendência e o número de pontos na escala vertical. (Os cálculos são realizados abrindo a barra) O indicador não é redesenhado. Para maior comodidade, é d
Scalping and Binary Signal Detector - Indicador de scalping que fornece sinais direcionais para abertura de posições ao longo da tendência. O indicador é um sistema de negociação completo que pode ser usado para Forex e opções binárias. O sistema de algoritmos permite reconhecer movimentos intensos de preços em diversas barras consecutivas. O indicador fornece vários tipos de alertas para setas. Funciona em quaisquer instrumentos de negociação e prazos (recomendado M5 ou superior). Como u
Zig-Zag indicator with additional signals for inputs. Visually easy to use: The red zig-zag line is an uptrend. The blue zig-zag line is a downward trend. Arrows in the form of additional signals. Works on any trading pairs. On any timeframe. Not redrawn. Input parameters Zig-Zag Period - Zig-zag period (from 5) Signal Period - period of signal arrows (from 3) Alerts for signals Play sound - Sound alert Display pop-up message - Notification by message on the screen Send push not
FREE
Scalping Entry Points - é um sistema de negociação manual que pode se ajustar aos movimentos de preços e dar sinais para abrir negociações sem redesenhar. O indicador determina a direção da tendência pelo nível central de suporte e resistência. O indicador de ponto fornece sinais para entradas e saídas. Adequado para negociação intradiária manual, escalpelamento e opções binárias. Funciona em todos os prazos e instrumentos de negociação. O indicador dá vários tipos de alertas. Como usar o pr
Um conjunto de indicadores que reconhecem pontos de viragem. Deteta topos e fundos de combinações de velas após subtraí-los a dois MAs. Aplicável para sistemas de negociação ao utilizar entradas antecipadas. Pode ser utilizado ao longo da tendência para scalping e negociação intradiária e para detetar reversões de tendência nas fases iniciais. Possibilidades Os parâmetros fornecem definições flexíveis para quaisquer prazos e instrumentos de negociação. Existem vários tipos de alertas para
Indicator Waiting Volatility - um indicador para determinar zonas de volatilidade e condições planas. Com o tempo, o preço no gráfico segue tendências diferentes, cai, sobe ou permanece o mesmo. O indicador ajuda o trader a determinar em qual tendência o preço está. Em seu trabalho, utiliza diversas ferramentas de análise técnica, primeiro determina-se a direção da tendência, depois, nessa direção, o indicador monitora as mudanças na volatilidade. Se o preço flutuar dentro do ruído, está em m
Um conjunto de indicadores que reconhecem pontos de viragem. Deteta topos e fundos de combinações de velas após subtraí-los a dois MAs. Aplicável para sistemas de negociação ao utilizar entradas antecipadas. Pode ser utilizado ao longo da tendência para scalping e negociação intradiária e para detetar reversões de tendência nas fases iniciais. Possibilidades Os parâmetros fornecem definições flexíveis para quaisquer prazos e instrumentos de negociação. Existem vários tipos de alertas para
Indicador para negociação manual e análise técnica para Forex. Consiste em um indicador de tendência com o nível de abertura do dia de negociação e um indicador de seta para determinar os pontos de entrada. O indicador não muda de cor; funciona quando a vela fecha. Contém vários tipos de alertas para setas de sinalização. Pode ser configurado para funcionar em qualquer gráfico, instrumento de negociação ou período de tempo. A estratégia de trabalho baseia-se na busca de movimentos de pr
Level Breakout Indicator é um produto de análise técnica que funciona a partir dos limites superior e inferior, que pode determinar a direção da tendência. Funciona na vela 0 sem redesenhar ou atrasos. Em seu trabalho utiliza um sistema de diversos indicadores, cujos parâmetros já foram configurados e combinados em um único parâmetro - “ Scale ”, que realiza a gradação dos períodos. O indicador é fácil de usar, não requer nenhum cálculo, usando um único parâmetro você precisa selecionar a grad
Binary Lines é um indicador de análise técnica para moedas, commodities, criptomoedas, ações, índices e quaisquer instrumentos financeiros. Pode ser usado para opções binárias ou escalpelamento Forex. Mostra os pontos de entrada e saída em intervalos fixos e fornece comerciantes as informações necessárias sobre os resultados de possíveis transações. Os pontos de entrada são formados no início da vela, na direção da linha MA, duração as negociações em barras podem ser ajustadas manualmente e aj
Um indicador técnico concebido especificamente para o scalping que pode identificar impulsos de volatilidade e mostrar a sua duração. Possui parâmetros flexíveis para configurações manuais, permitindo aplicar a funcionalidade do indicador a qualquer instrumento de negociação. Os prazos recomendados para utilização são M5, M15, M30, H1 e H4. Existem vários tipos de alertas. Todos os sinais nunca mudam ou mudam de cor no fecho da vela. O indicador é configurado por parâmetros de cima para b
Max Min Reversal Arrows MT5 - an arrow reversal indicator for predicting price movement. The indicator is built on the support and resistance levels at the local lows and highs of the price. Product features Arrows appear on the current candle. The indicator does not redraw. Can be used on all time frames and trading instruments. Recommended timeframes to use M30, H1, H4. The dotted lines are the support and resistance levels within the signal. Price movement from these levels means a reve
An indicator that determines the point levels of price resistance. The arrows indicate price bounces in the indicated directions. Arrows are not redrawn formed on the current candle, shown on the previous candle for convenience.      It has one setting - the formation intensity: If the parameter is smaller, most of the signals are formed in a wide trend. If the parameter is larger, signals are formed in a narrower trend. Input parameters Formation Intensity - Arrow Formation Intensity Num
Um indicador de tendência que mostra a força dos touros e ursos em uma faixa de negociação. Composto por duas linhas: A linha verde é uma condição equilibrada de sobrecompra/sobrevenda. A linha vermelha é a direção da atividade de negociação. Não redesenha cálculos. Pode ser usado em todos os símbolos/instrumentos/quadros de tempo. Fácil de usar e configurar. Como usar o indicador e o que ele determina. A regra básica é seguir a direção da linha vermelha: se cruzar a linha verde d
FREE
Lines Channel Pro
Vitalyi Belyh
5 (1)
The "Lines Channel Pro" indicator determines price reversals from the High/Low channel. Contains a built-in trend finder, signal lines, entry and exit points. The recommended timeframe for M15 to work is D1. For each timeframe and trading instrument, depending on the volatility, it is necessary to select individual settings. Does not redraw calculations. Input parameters Use Channel trend filter - Turn on/off the trend filter Channel trend period - Trend filter period (from 8 and abov
Arrow indicator with trend filter. Generates trend input without delays or delays - on the emerging candle. Suitable for use on any trading tools and timeframes. Easy to use, contains the direction of the trend in the form of a histogram lines and signal generator. Input parameters Period Trend Line - Period of the Histogram Line Signal Generator Period - If the period is longer, then the arrows are less Play sound Display pop-up message Send push notification Send email Sound file signal -
Desenvolvi metodos para negociacao coletados em um indicador. Na forma de setas, define entradas na direcao da tendencia. Possui 2 tipos de setas - guias de tendencia e de sinal, informando sobre o movimento potencial na direcao da tendencia. Funciona sem redesenho, pronto para uso em todos os simbolos/ferramentas. Os prazos mais adequados para usar sao M15, M30, H1, H4. Como usar O indicador encontra a direcao da tendencia na forma de uma seta de sinal, um retangulo grafico se estende
Wave Reversal Indicator - determina a direção e as reversões de preço em torno da linha de equilíbrio. O indicador mostra os movimentos das ondas e os picos de tendência. Dá recomendações sobre onde seguir o trader, ajuda a seguir a estratégia de trading. É um complemento a uma estratégia intradiária ou de médio prazo. Quase todos os parâmetros são selecionados para cada intervalo de tempo e mudam automaticamente; Prazos ideais para utilizar M5, M15, M30, H1, H4. Funciona em vários instrum
Max Min Reversal Arrows - an arrow reversal indicator for predicting price movement. The indicator is built on the support and resistance levels at the local lows and highs of the price. Product features Arrows appear on the current candle. The indicator does not redraw. Can be used on all time frames and trading instruments. Recommended timeframes to use M30, H1, H4. The dotted lines are the support and resistance levels within the signal. Price movement from these levels means a reversal.
Scalping Entry Points - é um sistema de negociação manual que pode se ajustar aos movimentos de preços e dar sinais para abrir negociações sem redesenhar. O indicador determina a direção da tendência pelo nível central de suporte e resistência. O indicador de ponto fornece sinais para entradas e saídas. Adequado para negociação intradiária manual, escalpelamento e opções binárias. Funciona em todos os prazos e instrumentos de negociação. O indicador dá vários tipos de alertas. Como usar o pr
Indicador do canal de preço e gerador de breakpoint dentro dele. Dá uma ideia da posição do preço em relação ao período de uso. Ele contém linhas de salto de tendência suavizadas construídas ao longo das bordas do canal e pontos de salto que determinam os momentos de entrada e saída. Funciona em vários instrumentos de negociação e prazos. Como trabalhar com o indicador Siga a linha de quebra de canal, a linha azul é entrada para cima, a linha rosa é entrada para baixo. Os pontos de entra
Um indicador técnico que calcula suas leituras nos volumes de negociação. Na forma de histograma, mostra o acúmulo da força do movimento do instrumento de negociação. Possui sistemas de cálculo independentes para direções de alta e baixa. Funciona em quaisquer instrumentos de negociação e prazos. Pode complementar qualquer sistema de negociação. O indicador não redesenha seus valores, os sinais aparecem na vela atual. É fácil de usar e não carrega o gráfico, não requer cálculos de parâmetros a
Line Breakouts - Sistema para negociação de tendências. Contém um identificador de tendência que pode ser adaptado a qualquer gráfico e instrumento de negociação usando o período e a função de suavização. E um determinante dos níveis de suporte e resistência. Quando o preço estiver abaixo da linha de resistência, abra negociações de venda e, quando o preço estiver acima da linha de suporte, abra negociações de compra. O Stop Loss deve ser colocado a alguns pontos das linhas, o Take Profit deve
Fractal Arrows é um indicador de sinal universal. Encontra os pontos superiores e inferiores do fractal em um gráfico. Funciona em conjunto com a linha de tendência da direção do movimento. O indicador é fácil de usar e não requer configuração de parâmetros complexos. Parâmetros básicos para alteração manual: Comprimento da direção do sinal (para alterar a duração da linha de tendência central). Nível de geração de setas fractais (para alterar o período de iteração), que podem funcionar auto
Filtro:
hkarram
288
hkarram 2021.02.04 09:00 
 

O usuário não deixou nenhum comentário para sua avaliação

vladimirsavitsky
49
vladimirsavitsky 2020.07.29 12:08 
 

Спасибо огромное хороший индикатор))))

[Excluído] 2020.07.09 16:52 
 

O usuário não deixou nenhum comentário para sua avaliação

Responder ao comentário