• Visão global
  • Comentários
  • Discussão (5)
  • O que há de novo

TMoney Interquartile Range II

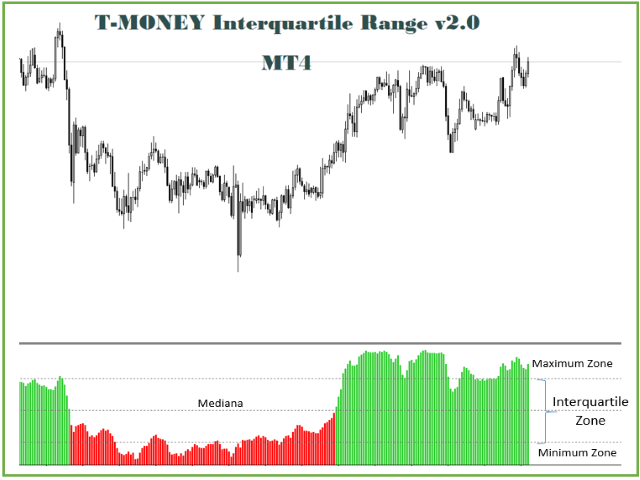
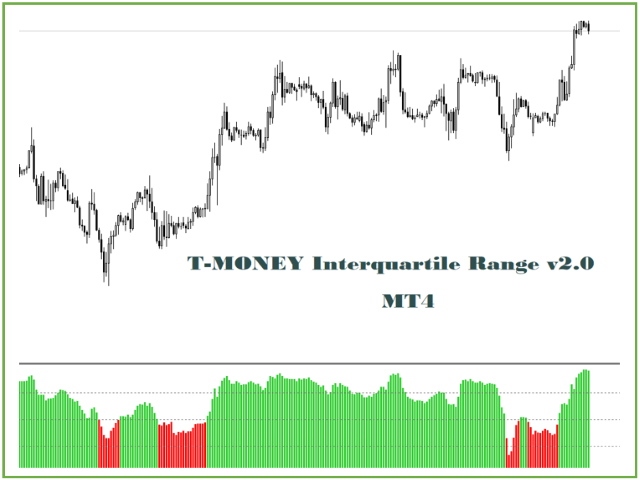
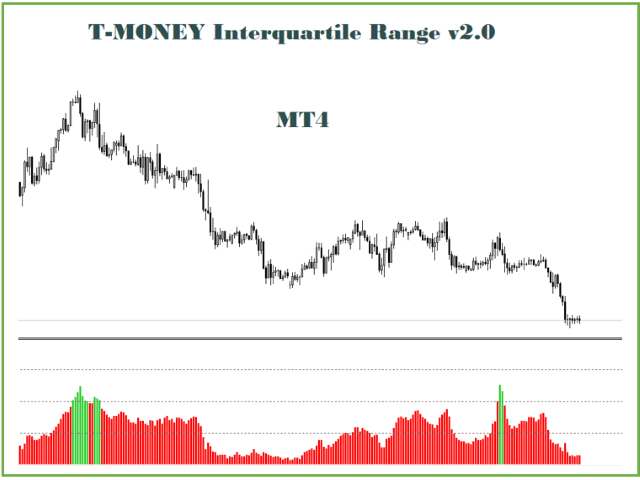
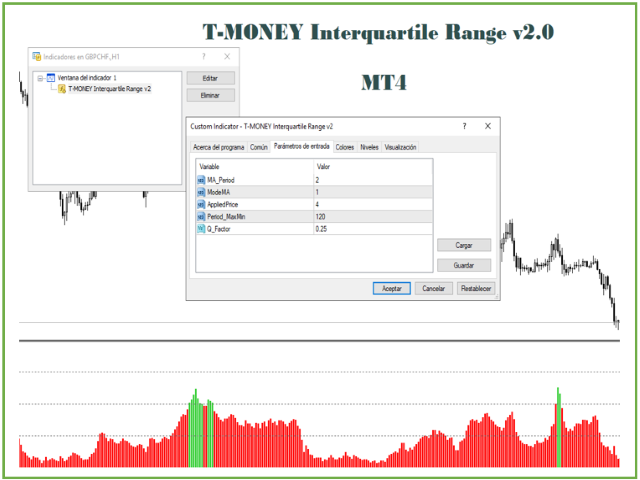
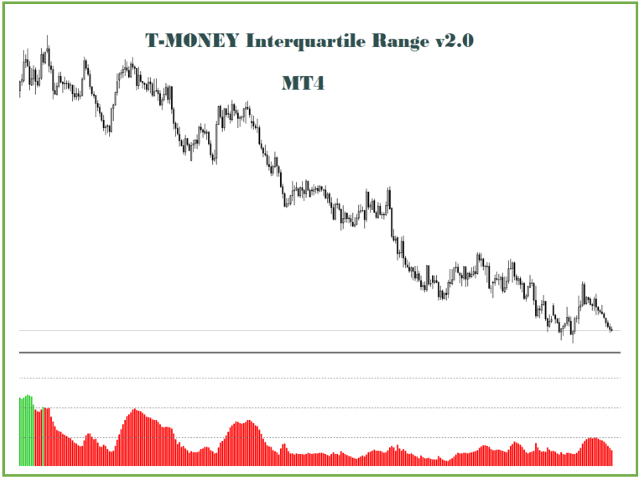
This indicator is similar to "T-MONEY Interquartile I" but it is normalized (on a scale of 0 to 100) and is plotted in a separate window. The normalized interquartile range, the median, and the maximum and minimum zones can be observed. As a visual aid, the green color has been considered in the histogram when the asset is trading above the configured median of "n" periods, and red when the asset is trading below it.

Like its similar, this indicator should be used as a support tool for making operational decisions.
Produtos recomendados
We present you the indicator "Candle closing counter", which will become your indispensable assistant in the world of trading. That’s why knowing when the candle will close can help: If you like to trade using candle patterns, you will know when the candle will be closed. This indicator will allow you to check if a known pattern has formed and if there is a possibility of trading. The indicator will help you to prepare for market opening and market closure. You can set a timer to create a p
Noize Absorption Index MT4
Ekaterina Saltykova
5 (1)
Noize Absorption Index - is the manual trading system that measures the difference of pressure between bears forces and bulls forces. Green line - is a noize free index that showing curent situation. Zero value of index shows totally choppy/flat market.Values above zero level shows how powerfull bullish wave is and values below zero measures bearish forces.Up arrow appears on bearish market when it's ready to reverse, dn arrow appears on weak bullish market, as a result of reverse expectation. S
The Th3Eng PipFinite indicator is based on a very excellent analysis of the right trend direction with perfect custom algorithms. It show the true direction and the best point to start trading. With StopLoss point and Three Take Profit points. Also it show the right pivot of the price and small points to order to replace the dynamic support and resistance channel, Which surrounds the price. And Finally it draws a very helpful Box on the left side on the chart includes (take profits and Stop loss
Volume by Price MT4
Brian Collard
4.71 (14)
The Volumebyprice.com Indicator for MetaTrader 4 features Volume Profile and Market Profile TPO (Time Price Opportunity). Volume and TPO histogram bar and line charts. Volume Footprint charts. TPO letter and block marker collapsed and split structure charts. Static, dynamic and flexible range segmentation and compositing methods with relative and absolute visualizations. Session hours filtering and segment concatenation with Market Watch and custom user specifications. Graphical layering, posit
Nosso indicador Basic Support and Resistance é a solução necessária para aumentar sua análise técnica.Este indicador permite que você forneça níveis de suporte e resistência no gráfico/ MT5 grátis Recursos Integração dos níveis de Fibonacci: Com a opção de exibir níveis de Fibonacci, juntamente com os níveis de suporte e resistência, nosso indicador fornece uma visão ainda mais profunda do comportamento do mercado e possíveis áreas de reversão. Otimização de desempenho: Com a opção de atua
Antes de tudo, vale ressaltar que esta Ferramenta de Negociação é um Indicador Não Repintante, Não Redesenhante e Não Atrasado, o que a torna ideal para negociação profissional. Curso online, manual do utilizador e demonstração. O Indicador de Conceitos de Ação de Preço Inteligente é uma ferramenta muito poderosa tanto para traders novos quanto experientes. Ele combina mais de 20 indicadores úteis em um único, combinando ideias avançadas de negociação como Análise do Trader do Círculo Interno e
KT Horizontal Lines MT4
KEENBASE SOFTWARE SOLUTIONS
In MetaTrader, plotting multiple   horizontal lines   and then tracking their respective price levels can be a hassle. This indicator automatically plots multiple horizontal lines at equal intervals for setting price alerts, plotting support and resistance levels, and other manual purposes. This indicator is suitable for Forex traders who are new and looking for chances to make quick profits from buying and selling. Horizontal lines can help traders find possible areas to start trading when the
Classic Fractals indicator for MT4, with additional Trendlines connecting the latest couples of fractals ( fractals are showing highest high, and lowest low on each period) Rules for trendlines: -if new top fractal is below the last one = new resistance line -if new bot fractal is above the last one = new support line -Trendlines can be hidden -Fractals can be hidden Fractal Period = can be both even or uneven number, as it is setting for half (one side) of the bars sequence
To download MT5 version please click  here . This is the exact conversion from TradingView: "WaveTrend [LazyBear]" By "zeusuk3". One of the coolest indicators out there to detect overbought and oversold zones. It can be used as a part of more complicated strategy and for confirming a potential trade setup. There are buffers to use in EAs also. The indicator is loaded light and non-repaint. - You can message in private chat for further changes you need. Thanks for downloading 
Title : Market Bias Indicator - Oscillator-Based Trading Tool Introduction : Discover the potential of the "Market Bias Indicator," a revolutionary oscillator-based trading tool designed for precise market analysis. If you're in search of a robust alternative to traditional bias indicators, your quest ends here. Market Bias Indicator offers unparalleled accuracy in identifying market sentiment and is your gateway to confident trading decisions. Recommended Trading Pairs : Market Bias Indicator i
Support and Resistance Barry Indicator - Your Path to Precision Trading Explore the world of precision trading with the "Support and Resistance Barry Indicator" for MetaTrader 4. This robust tool is designed to help you identify key support and resistance levels with exceptional accuracy, enhancing your ability to make well-informed trading decisions. Basic Details : Indicator Type : Support and Resistance Barry Indicator Key Metrics : Real-time identification of crucial support and resistance l
TWO PAIRS SQUARE HEDGE METER INDICATOR Try this brilliant 2 pairs square indicator It draws a square wave of the relation between your two inputs symbols when square wave indicates -1 then it is very great opportunity to SELL pair1 and BUY Pair2 when square wave indicates +1 then it is very great opportunity to BUY pair1 and SELL Pair2 the inputs are : 2 pairs of symbols         then index value : i use 20 for M30 charts ( you can try other values : 40/50 for M15 , : 30 for M30 , : 10 for H1 ,
Heiken Ashi candle chart is an improved version of The Japanese candle chart, which can effectively filter the market "noise" of the Japanese candle chart. It is favored by many traders for its simplicity and intuition. For trend traders, the HA candle chart is a magic tool. Unlike the traditional Japanese candle chart, Heikenashi does not reflect the opening price, high price, low price and closing price of the market. Instead, Heikenashi calculates the value of a single K line in the dominant
Indicator for binary options arrow is easy to use and does not require configuration works on all currency pairs, cryptocurrencies buy signal blue up arrow sell signal red down arrow tips do not trade during news and 15-30 minutes before their release, as the market is too volatile and there is a lot of noise it is worth entering trades one or two candles from the current period (recommended for 1 candle) timeframe up to m 15 recommended money management fixed lot or fixed percentage of the depo
SuperTrend MT4
KEENBASE SOFTWARE SOLUTIONS
KT SuperTrend is a modified version of the classic SuperTrend indicator with new useful features. Whether its Equities, Futures, and Forex, the beginners' traders widely use the Supertrend indicator.  Buy Signal: When price close above the supertrend line. Sell Signal: When price close below the supertrend line. Features A multi-featured SuperTrend coded from scratch. Equipped with a multi-timeframe scanner. The last signal direction and entry price showed on the chart. All kinds of MetaTra
Intraday Levels shows intraday levels grid for intraday trading Shows a grid for the day levels, gives you a guide to know the trend and to measure intraday trades (stop-loss and take-profit). Parameters are: Levels Mode: Basic mode: Shows highest, lowest and middle levels. Advanced mode: Shows highest, lowest, middle and intermediate levels. Fibonacci mode: Shows session Fibonacci retracements levels. Momentum mode: Shows delayed Advanced levels to identify momentum. Smooth Period (Momentum
Gold Bricks FX USES THE TREND WAVE INDICATOR AND IT CAN IDENTIFY THE BEGINNING AND THE END OF A NEW WAVE TREND MOVEMENT. AS AN OSCILLATOR, THE INDICATOR IDENTIFIES THE OVERBOUGHT AND OVERSOLD ZONES. IT WORKS GREAT TO CATCH THE SHORT TERM PRICE REVERSALS AND USES A MARTINGALE STRATEGY TO CLOSE ALL TRADES IN PROFIT. USE DEFAULT SETTINGS ON H1 OR HIGHER TIME FRAME ON ANY PAIR FOR MORE ACCURATE TRADES WHY THIS EA : Smart entries calculated by 4 great strategies The EA can be run on even a
Shark Deal Book
Philip Pankaj Suthagar
4 (3)
Term  "shark"  in the business world denotes a high volume investor who just made a good investment in a highly Potential business deal.So, sharks are the ones who make the market move. In our case, if an American shark bought a Japanese company, he/she has to convert American dollars into Japanese yen to make the deal. So, the demand for the Japanese yen will increase sharply. Thus USD/JPY will go short rapidly if the deal was from the shark. Another example, In the case of forex, if fed increa
Murrey Math Multi Timeframe Indicator Support/Resistance  Murrey Math Lines are strong tools to plot the support and resistance levels. Murrey Math Multi Timeframe Indicator draws multi timeframe MM lines on a smaller tf chart. General Information: According to Gann, prices move in 1/8's, these 1/8's act as points of price support and resistance as an entity's price changes in time. Given this 1/8 characteristic of price action, Murrey assigns properties to each of the MML's in an a given
The Penta-O is a 6-point retracement harmonacci pattern which usually precedes big market movements. Penta-O patterns can expand and repaint quite a bit. To make things easier this indicator implements a twist: it waits for a donchian breakout in the right direction before signaling the trade. The end result is an otherwise repainting indicator with a very reliable trading signal. The donchian breakout period is entered as an input. [ Installation Guide | Update Guide | Troubleshooting | FAQ | A
YK-Fibo Pivot Indicator: Trade Smarter with Fibonacci Pivot Points The YK-Fibo Pivot Indicator is a powerful technical analysis tool that combines the precision of Fibonacci retracements with the insights of Pivot Points. Whether you're a novice or seasoned trader, this indicator empowers you to spot profitable opportunities in the market with ease. Why Choose YK-Fibo Pivot? Pinpoint Support & Resistance: By calculating Fibonacci levels based on the previous day's high, low, and close prices, y
In the stock market technical analysis, support and resistance is a concept that the movement of the price of a security will tend to stop and reverse at certain predetermined price levels. Support and resistance levels can be identified on any timeframe. However, the most significant ones are found on the higher time frames, such as daily, weekly, and monthly. This indicator using the weekly OHLC data to identify the relevant levels. This is a support and resistance indicator and providing majo
This is a new strategy for SUPPLY DEMAND areas It is based on a calculation using the tick volume to detect the big price action in market for both bear /bull actions this smart volume action candles are used to determine the supply and demand areas prices in between main supply and demand lines indicate sideway market  up arrows will be shown when prices moves above the main supply and the secondary supply lines Down arrows will be shown when prices moves below the main demand and the secondary
Automatic fibonacci with alerts is an indicator that automatically plots a fibonacci retracement based on the number of bars you select on the BarsToScan setting in the indicator. The fibonacci is automatically updated in real time as new highest and lowest values appear amongst the selected bars. You can select which level values to be displayed in the indicator settings. You can also select the color of the levels thus enabling the trader to be able to attach the indicator several times with d
Akendicator X is a Non-repainting Indicator for trading at 5-15 minutes Timeframe.  Akendicator X extimates with clear arrows, in which direction the next candlestick will move. Pratically, when the length of the last candle reaches and exceeds a particular value (called Candle Power) immediately, after its closing, an arrow appears indicating whether the next candle could be Bullish or Bearish. I created a manual in pdf where you should learn exactly how to use AKENDICATOR X correctly; I will s
Delta Pairs
Anatolii Zainchkovskii
1 (1)
Delta Pairs is an indicator for pair trading, it displays the divergence of two currency pairs. Does not redraw. A useful tool for the analysis of the behavior of two currency pairs relative to each other. Purpose The Delta Pairs indicator is designed for determining the divergences in the movements of two currency pairs. This indicator is displayed as two line charts and the difference (delta) between these charts in the form of a histogram. The Delta Pairs indicator will be useful for those
Trend PRO Expert Advisor
Nguyen Tran Ha
1 (1)
Trend PRO Expert Advisor  is developed base on the PipFinite Trend PRO Indicator, the best indicators on the market so far. PipFinite  Trend Pro's smart algorithm detects the trend, filters out market noise and gives entry signals with exit levels.  This EA open order when the indicator has buy/sell signals and set SL/TP follow the indicator rules. You can read more information about PipFinite Trend PRO indicator  here . Important Information   This EA will only work if you purchased  PipFin
This indicator depends on High and Low price of Currency in last Month and then i made some secret equations to draw 10 lines. Features You will know what exactly price you should enter the market . You will know when to be out of market. You will know you what should you do in market: Buy Sell Take profit and there are 3 levels to take your profit Support Resistance Risk to buy Risk to Sell Signal Types and Timeframe Used You can use this indicator just on H4 timeframe and you have to downl
Trend Ray
Andriy Sydoruk
The indicator shows the potential trend direction by cyclical-wave dependence. Thus, all the rays of the intersection will be optimal rays, in the direction of which the price is expected to move, taking into account the indicator period. Rays can be used as a direction for potential market movement. But we must not forget that the approach must be comprehensive, the indicator signals require additional information to enter the market.
An indicator of pattern #31 ("Long Island") from Encyclopedia of Chart Patterns by Thomas N. Bulkowski. The second gap is in the opposite direction. Parameters: Alerts - show alert when an arrow appears   Push - send a push notification when an arrow appears (requires configuration in the terminal) GapSize - minimum gap size in points ArrowType - a symbol from 1 to 17 ArrowVShift - vertical shift of arrows in points   ShowLevels - show levels ColUp - color of an upward line ColDn - color of
Os compradores deste produto também adquirem
Gann Made Easy
Oleg Rodin
4.88 (96)
Gann Made Easy é um sistema de negociação Forex profissional e fácil de usar, baseado nos melhores princípios de negociação usando a teoria do sr. W. D. Gann. O indicador fornece sinais precisos de COMPRA e VENDA, incluindo níveis de Stop Loss e Take Profit. Você pode negociar mesmo em movimento usando notificações PUSH. Entre em contato comigo após a compra! Vou compartilhar minhas dicas de negociação com você e ótimos indicadores de bônus de graça! Provavelmente você já ouviu muitas vezes sobr
Trend Pulse
Mohamed Hassan
5 (4)
Please contact me after purchase to immediately get your PDF strategy + documentation for Trend Pulse !  Official release price of $89  ( 3 /50 copies left). Next price is $199 . Introducing Trend Pulse , a unique and robust indicator capable of detecting bullish, bearish, and even ranging trends! Trend Pulse uses a special algorithm to filter out market noise with real precision. If the current symbol is moving sideways, Trend Pulse will send you a ranging signal, letting you know that it
Scalper Inside PRO
Alexey Minkov
4.75 (60)
An exclusive indicator that utilizes an innovative algorithm to swiftly and accurately determine the market trend. The indicator automatically calculates opening, closing, and profit levels, providing detailed trading statistics. With these features, you can choose the most appropriate trading instrument for the current market conditions. Additionally, you can easily integrate your own arrow indicators into Scalper Inside Pro to quickly evaluate their statistics and profitability. Scalper Inside
Atomic Analyst
Issam Kassas
5 (3)
Primeiramente, vale ressaltar que este Indicador de Negociação não repinta, não redesenha e não apresenta atrasos, tornando-o ideal tanto para negociação manual quanto automatizada. Manual do utilizador: configurações, entradas e estratégia. O Analista Atômico é um Indicador de Ação de Preço PA que utiliza a força e o momentum do preço para encontrar uma vantagem melhor no mercado. Equipado com filtros avançados que ajudam a remover ruídos e sinais falsos, e aumentam o potencial de negociação.
Gold Stuff
Vasiliy Strukov
4.9 (269)
Gold Stuff-um indicador de tendência projetado especificamente para o ouro, também pode ser usado em qualquer instrumento financeiro. O indicador não é redesenhado ou atrasado. O timeframe recomendado é H1. O EA Gold Stuff Expert Advisor está escrito neste indicador, você pode encontrá-lo no meu perfil. Importante! Entre em contato comigo imediatamente após a compra para obter instruções e bônus!  Você pode obter uma cópia gratuita do nosso indicador Strong Support e Trend Scanner, envie um
Trend Punch
Mohamed Hassan
4.91 (22)
This indicator is unstoppable when combined with our other indicator called  Support & Resistance . After purchase, send us a message and you will get it   for  FREE as a BONUS! Introducing Trend Punch , the revolutionary forex trend indicator that will transform the way you trade! Trend Punch is uniquely designed to provide precise buy and sell arrows during strong market trends, making your trading decisions clearer and more confident. Whether you're trading major currency pairs or exotic sym
ACTUALMENTE COM 26% DE DESCONTO A melhor solução para qualquer novato ou comerciante especializado! Este Indicador é uma ferramenta comercial única, de alta qualidade e acessível, porque incorporámos uma série de características proprietárias e uma nova fórmula. Com apenas UM gráfico, pode ler a força da moeda para 28 pares de Forex! Imagine como a sua negociação irá melhorar porque é capaz de apontar o ponto exacto do gatilho de uma nova tendência ou oportunidade de escalada? Manual do u
FX Power MT4 NG
Daniel Stein
5 (12)
Receba a sua atualização diária do mercado com detalhes e screenshots através do nosso Morning Briefing aqui no mql5 e no Telegram ! O FX Power MT4 NG é a próxima geração do nosso medidor de força de moeda muito popular de longa data, o FX Power. E o que é que este medidor de força da próxima geração oferece? Tudo o que adorou no FX Power original MAIS Análise de força GOLD/XAU Resultados de cálculo ainda mais precisos Períodos de análise configuráveis individualmente Limite de cálculo personal
Currency Strength Wizard é um indicador muito poderoso que fornece uma solução completa para uma negociação bem-sucedida. O indicador calcula o poder deste ou daquele par forex usando os dados de todas as moedas em vários intervalos de tempo. Esses dados são representados em uma forma de índice de moeda fácil de usar e linhas de energia de moeda que você pode usar para ver o poder desta ou daquela moeda. Tudo o que você precisa é anexar o indicador ao gráfico que deseja negociar e o indicador mo
ACTUALMENTE 31% DE DESCONTO!! A melhor solução para qualquer novato ou comerciante especializado! Este indicador é uma ferramenta comercial única, de alta qualidade e acessível, porque incorporámos uma série de características proprietárias e uma fórmula secreta. Com apenas UM gráfico, dá alertas para todos os 28 pares de moedas. Imagine como a sua negociação irá melhorar porque é capaz de identificar o ponto exacto de desencadeamento de uma nova tendência ou oportunidade de escalada! Con
Actualmente 20% OFF ! A melhor solução para qualquer novato ou comerciante especializado! Este software de painel de instrumentos está a funcionar em 28 pares de moedas. É baseado em 2 dos nossos principais indicadores (Advanced Currency Strength 28 e Advanced Currency Impulse). Dá uma grande visão geral de todo o mercado Forex. Mostra valores avançados de força da moeda, velocidade de movimento da moeda e sinais para 28 pares de divisas em todos os (9) períodos de tempo. Imagine como a sua
Scalper Vault
Oleg Rodin
5 (29)
Scalper Vault é um sistema profissional de escalpelamento que fornece tudo o que você precisa para um escalpelamento bem-sucedido. Este indicador é um sistema de negociação completo que pode ser usado por comerciantes de forex e opções binárias. O período de tempo recomendado é M5. O sistema fornece sinais de seta precisos na direção da tendência. Ele também fornece sinais superiores e inferiores e níveis de mercado Gann. Os indicadores fornecem todos os tipos de alertas, incluindo notificações
Order Block Hunter
Noha Mohamed Fathy Younes Badr
5 (1)
Order block hunter indicator is the best indicator for  hunt the order blocks that area where there has been a large concentration of limit orders waiting to be executed Order blocks are identified on a chart by observing previous price action and looking for areas where the price experienced significant movement or sudden changes in direction .This indicator does that for you by using very complicated codes and helps you to take the best areas To buy and sell because it make marks at the best a
Enigmera
Ivan Stefanov
5 (4)
ENIGMERA: O núcleo do mercado https://www.enigmera.com Introdução Este indicador e sistema de negociação é uma abordagem notável aos mercados financeiros. ENIGMERA utiliza os ciclos fractais para calcular com precisão os níveis de suporte e resistência. Mostra a autêntica fase de acumulação e dá direcções e objectivos.  Um sistema que funciona quer estejamos numa tendência ou numa correção.  Como é que funciona? O ENIGMERA é composto por três linhas: a linha de suporte/resistência, a linha
- Real price is 80$ - 50% Discount ( It is 39$ now ) Contact me for instruction, any questions! Introduction The breakout and retest strategy is traded support and resistance levels. it involves price breaking through a previous level.  The break and retest strategy is designed to help traders do two main things, the first is to avoid false breakouts. Many false breakouts start with a candlestick that breaks out of a level but ends with an immediate candlestick that brings the price back into t
Trend Screener
STE S.S.COMPANY
4.82 (93)
Indicador de tendência, solução única inovadora para negociação e filtragem de tendências com todos os recursos de tendências importantes construídos dentro de uma ferramenta! É um indicador multi-timeframe e multi-moedas 100% sem repintura que pode ser usado em todos os símbolos/instrumentos: forex, commodities, criptomoedas, índices e ações. O Trend Screener é um indicador eficiente que segue a tendência do indicador que fornece sinais de tendência de seta com pontos no gráfico. Os recursos qu
Gold Channel   é um indicador baseado na volatilidade, desenvolvido com um algoritmo de tempo especifico para o par XAUUSD que consiste em encontrar possíveis correções no mercado. Este indicador mostra duas linhas exteriores, uma interior (linha de retração) e um sinal de seta, onde a teoria do canal consiste em ajudar a identificar condições de sobrecompra e sobrevenda no mercado. O preço do mercado cairá geralmente entre os limites do canal. Se os preços tocarem ou se moverem para fora do can
Descubra o segredo da negociação forex bem -sucedida com nosso indicador MT4 personalizado! Você já se perguntou como obter sucesso no mercado de Forex, obtendo lucros consistentemente e minimizando o risco? Aqui está a resposta que você está procurando! Permita -nos apresentar nosso indicador proprietário do MT4 que revolucionará sua abordagem à negociação. Versatilidade única Nosso indicador foi projetado especialmente para usuários que preferem as formações de vela Renko e Rangebar. En
Automated Trendlines
Georgios Kalomoiropoulos
5 (17)
As linhas de tendência são a ferramenta mais essencial de análise técnica na negociação forex. Infelizmente, a maioria dos traders não os desenha corretamente. O indicador Automated Trendlines é uma ferramenta profissional para traders sérios que o ajudam a visualizar o movimento de tendências dos mercados. Existem dois tipos de Trendlines Bullish Trendlines e Bearish Trendlines. Na tendência de alta, a linha de tendência Forex é desenhada através dos pontos de oscilação mais baixos do m
Advanced Supply Demand
Bernhard Schweigert
4.9 (314)
Atualmente com 33% de desconto! A melhor solução para qualquer Trader Novato ou especialista! Este indicador é uma ferramenta de negociação exclusiva, de alta qualidade e acessível porque incorporamos uma série de recursos proprietários e uma nova fórmula. Com esta atualização, você poderá mostrar fusos horários duplos. Você não só será capaz de mostrar um TF mais alto, mas também mostrar ambos, o TF do gráfico, MAIS o TF mais alto: MOSTRANDO ZONAS ANINHADAS. Todos os traders de Oferta e Demanda
LEIA AS INFORMAÇÕES ABAIXO ANTES DE COMPRAR O PRODUTO! Apollo Pips PLUS SP é um produto único! É PARA QUEM QUER ADQUIRIR MEU NOVO INDICADOR "APOLLO PIPS" MAIS BÔNUS "SUPER PACK" COM ACESSO A TODOS OS MEUS INDICADORES DE NEGOCIAÇÃO! Ao adquirir o produto Apollo Pips PLUS SP você está na verdade adquirindo uma versão absolutamente nova do meu indicador Apollo Pips. Esta versão do indicador possui um algoritmo aprimorado e um parâmetro fácil de usar que lhe dá a oportunidade de usar o indicador em
PZ Day Trading
PZ TRADING SLU
3.67 (3)
Este indicador detecta reversões de preços em zigue-zague, usando apenas análise de ação de preços e um canal donchiano. Ele foi projetado especificamente para negociações de curto prazo, sem repintar ou retroceder. É uma ferramenta fantástica para traders astutos, com o objetivo de aumentar o tempo de suas operações. [ Guia de instalação | Guia de atualização | Solução de problemas | FAQ | Todos os produtos ] Surpreendentemente fácil de negociar Fornece valor em cada período de tempo Imple
AW Trend Predictor
AW Trading Software Limited
4.74 (39)
A combinação de níveis de tendência e quebra em um sistema. Um algoritmo de indicador avançado filtra o ruído do mercado, determina a tendência, os pontos de entrada e os possíveis níveis de saída. Os sinais indicadores são registrados em um módulo estatístico, que permite selecionar as ferramentas mais adequadas, mostrando a eficácia do histórico do sinal. O indicador calcula as marcas Take Profit e Stop Loss. Manual e instrução ->   Aqui   / versão MT5 ->   Aqui Como negociar com o indicador:
IX Power MT4
Daniel Stein
5 (6)
O IX Power traz finalmente a precisão imbatível do FX Power para símbolos não-Forex. Determina com exatidão a intensidade das tendências a curto, médio e longo prazo nos seus índices, acções, mercadorias, ETFs e até criptomoedas favoritos. Pode analisar tudo o que o seu terminal tem para oferecer. Experimente e veja como o seu timing melhora significativamente quando negoceia. Características principais do IX Power Resultados de cálculo 100% precisos e sem repintura - para todos os símb
M1 Arrow
Oleg Rodin
4.73 (15)
Uma estratégia intradiária baseada em dois princípios fundamentais do mercado. O algoritmo é baseado na análise de volumes e ondas de preços usando filtros adicionais. O algoritmo inteligente do indicador dá um sinal apenas quando dois fatores de mercado se combinam em um. O indicador calcula ondas de um determinado intervalo no gráfico M1 usando os dados do período de tempo mais alto. E para confirmar a onda, o indicador utiliza a análise por volume. Este indicador é um sistema de negociação pr
Break and Retest
Mohamed Hassan
4.12 (17)
This Indicator only places quality trades when the market is really in your favor with a clear break and retest. Patience is key with this price action strategy! If you want more alert signals per day, you increase the number next to the parameter called: Support & Resistance Sensitivity.  After many months of hard work and dedication, we are extremely proud to present you our  Break and Retest price action indicator created from scratch. One of the most complex indicators that we made with ove
TPSpro RFI Levels
Roman Podpora
4.83 (24)
Reversal First Impulse levels (RFI)    INSTRUCTIONS        RUS       -       ENG              R ecommended to use with an indicator   -   TPSpro  TREND PRO -  Version MT5 A key element in trading is zones or levels from which decisions to buy or sell a trading instrument are made. Despite attempts by major players to conceal their presence in the market, they inevitably leave traces. Our task was to learn how to identify these traces and interpret them correctly. Main functions: Displaying activ
PZ Mean Reversion MT4
PZ TRADING SLU
2.33 (3)
Indicador único que implementa uma abordagem profissional e quantitativa para significar negociação de reversão. Ele capitaliza o fato de que o preço desvia e retorna à média de maneira previsível e mensurável, o que permite regras claras de entrada e saída que superam amplamente as estratégias de negociação não quantitativas. [ Installation Guide | Update Guide | Troubleshooting | FAQ | All Products ] Sinais de negociação claros Incrivelmente fácil de negociar Cores e tamanhos personalizáveis
GOLD Impulse with Alert
Bernhard Schweigert
4.56 (9)
Este indicador é uma super combinação dos nossos 2 produtos Advanced Currency IMPULSE with ALERT  +   Currency Strength Exotics . Funciona para todos os períodos de tempo e mostra graficamente impulso de força ou fraqueza para as 8 principais moedas mais um Símbolo! Este Indicador é especializado para mostrar a aceleração da força da moeda para quaisquer símbolos como Ouro, Pares Exóticos, Commodities, Índices ou Futuros. É o primeiro do seu género, qualquer símbolo pode ser adicionado à
O sistema PRO Renko é um sistema de negociação altamente preciso especialmente concebido para a negociação de gráficos RENKO. Trata-se de um sistema universal que pode ser aplicado a vários instrumentos de negociação. O sistema neutraliza eficazmente o chamado ruído de mercado, dando-lhe acesso a sinais de inversão precisos. O indicador é muito fácil de usar e tem apenas um parâmetro responsável pela geração de sinal. Você pode facilmente adaptar a ferramenta a qualquer instrumento de negoc
Mais do autor
TMoney TrendCycle
Moises Orlando Urbina Sojo
The indicator plots the trend from an EMA of "n" periods and the cycle from another EMA of "k" periods from the previous EMA. This allows the crosses to be much more effective and the amplitude of the cycle allows to verify the strength of the trend. This indicator should be used as a complementary tool to confirm market entry signals. It is possible to add three times the indicator applied to maximum price, minimum price and median price in TimeFrame of one hour for example, in order to identif
TMoney TrendCycle MTF
Moises Orlando Urbina Sojo
The present indicator is similar to TrendCycle but it allows to graph in any TimeFrame the cycle-trend of a Superior TimeFrame. For example, you can include in the TimeFrame H1, the cycle-trend corresponding to H4 or D1. This is of particular importance for Swing traders or looking for medium-term trends. It can be used as a support indicator to confirm trends or medium-term trend changes and avoid false breaks.
TMoney AutoTrends
Moises Orlando Urbina Sojo
The indicator identifies and graphs the relevant trends (UpTrend and DownTrend) taking the relevant minimum and / or maximum in the market. Likewise, it projects the corresponding direction of the trend that constitutes levels of support for operational decision-making. A good practice using these trends is to trade on breaks, whether they are confirmed and a counter trend is generated or if the price rejoins the original trend after a false break. You can add more than one trend by modifying
TMoney Median with Stoch
Moises Orlando Urbina Sojo
This indicator plots the Median of "n" periods and confirms the crossings with the Stochastic Oscillator. It is an indicator that combines the Median as a determining level of the price cycle and the Stochastic Oscillator for the confirmation of crosses. It should be used as a complementary or supporting indicator with Price Action or other strategies to validate market entries.
TMoney Interquarile Range I
Moises Orlando Urbina Sojo
This indicator graphs channels formed by the Local Maximum and Local Minimum of "n" periods and from this channel adds the Median and Interquartile Range. It is important to note that when the price enters the range, the interquartile range is reduced considerably with respect to its historical level, which can be visually warned with this indicator and the operator will have the possibility of deciding to stay out of operations in these conditions of market. The Q Factor (by default at 0.25
TMoney OrderBLockWeek
Moises Orlando Urbina Sojo
The indicator is activated at the beginning of each week and detects both bullish and bearish ORDERBLOCK potentials. These levels are of high operational probability, being able to use a minimum ratio of 3 to 1 to maximize profits. It is recommended to use pending orders at the OB levels of the chart and place the SL up to a maximum of 20 pips from the entry price. Submit the indicator to Backtesting to become familiar with its performance and complement it with other trend or oscillation typ
TMoney OrderblockDay
Moises Orlando Urbina Sojo
The indicator is triggered at the start of each trading day and detects both bullish and bearish ORDERBLOCK potentials. These levels are of high operational probability, being able to use a minimum ratio of 3 to 1 to maximize profits. It is recommended to use TimeFrame M5 to M30 for a proper display and consider pending orders at the OB levels of the chart and place the SL up to a maximum of 20 pips from the entry price. Submit the indicator to Backtesting to become familiar with its performa
Filtro:
Sem comentários
Responder ao comentário
Versão 1.10 2020.07.13
Corrección en código de inicialización...