VolumeDelta
- Indicadores
- Stanislav Korotky
- Versão: 1.8
- Atualizado: 18 novembro 2021
- Ativações: 7
This indicator provides the analysis of tick volume deltas. It calculates tick volumes for buys and sells separately, and their delta on every bar, and displays volumes by price clusters (cells) within a specified bar (usually the latest one).
This is a limited substitution of market delta analysis based on real volumes, which are not available on Forex.
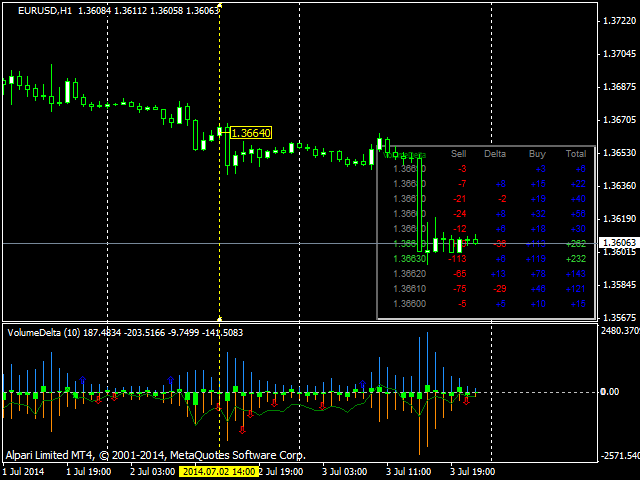
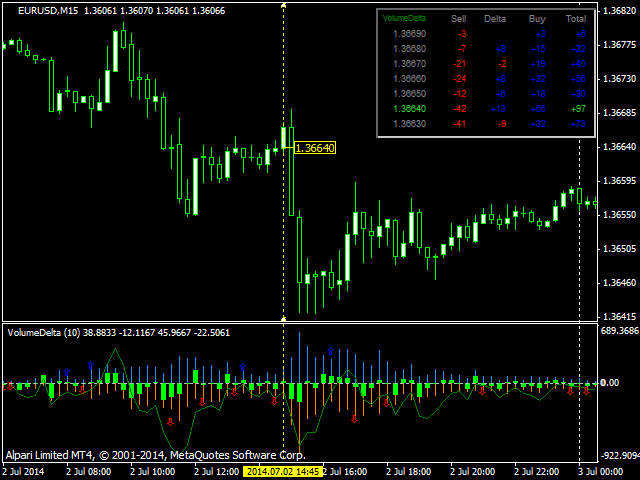
The indicator displays the following data in its sub-window:
- light-blue histogram - buy (long) volumes;
- orange histogram - sell (short) volumes;
- light green histogram - delta between buys and sells;
- green line - cumulative delta, EMA of delta; its values are multiplied by CumulativePeriod for scale adjustment - this makes it approximately the same size as the histograms;
- blue and red arrows - mark those bars where volume direction contradicts price direction;
- optionally - 2 moving averages (fast and slow) based on cumulative volumes.
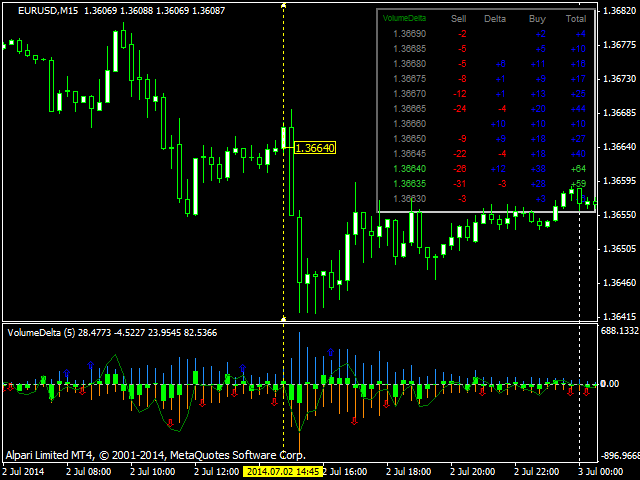
Also, the indicator displays a table of split volumes for the current bar in the main window. The current bar is selected by means of yellow dotted vertical line (drag it to the required position). The table rows correspond to price clusters. The table contains the following columns:
- price (a range of prices from specified value up to the next range);
- sell volume;
- delta of buy and sell volumes (positives are blue, negatives are red);
- buy volume;
- total volume (maximum values are highlighted in green).
Parameters
- PointsPerCell - number of points forming a single price cluster; every cluster is shown as a row in a table with split volumes of current bar;
- LastBars - number of bars for calculation; 0 means all bars;
- CumulativePeriod - period for calculation of cumulative delta by EMA;
- StickToBar0 - enable/disable special mode, when zero bar is always considered to be the current bar; if StickToBar0 is true, the dotted vertical line that marks the current bar is hidden, because automatic tracking of the 0 bar does not require the line;
- Corner - corner to display the table; 1 - top right; 0 - top left; 2 - bottom left; 3 - bottom right;
- CellWidth - width of the table cells;
- CellHeight - height of the table cells;
- ColorBG - table background color;
- FontSize - table font size;
- HideTable - if true, the table is not displayed;
- HideMark - if true, the price label on the maximum volume level is not shown; when both HideTable and HideMark are true, the vertical line for selecting the analyzed bar is not shown as well;
- HideBuySell - hide the columns for Buy and Sell volumes in the table and in the corresponding histograms;
- ColorDefault, ColorPositive, ColorNegative, ColorMaximum - colors of the table cells;
- ColorObjects - color of objects on the chart: the vertical line for selected bar and the price mark at maximal volumes;
- MAFast, MASlow, MAMethod - parameters for moving averages; set the periods to 0 to hide them;
- ShowAlerts - if true, alerts are enabled;
- AlertsOnCompletedBar - if true, alerts are generated only on the newly completed bar, otherwise - dynamically (within the 0 bar); Specific types of alerts can be enabled by the corresponding options:
- Bar Divergence - opposite sign of price and volume changes;
- * Cumulative Divergence - divergence of the price line direction and cumulative volumes, calculated by linear regression channel of period 2*CumulativePeriod;
- Fast and Slow MA Crossover - fast and slow moving average crossover;
- Cumulative Zero Crossing - zero crossing by the cumulative volume line or fast MA, if it is enabled;
Supported timeframes: M5 and higher.






A nice indicator. Well done!