Regression
- Indicadores
- MIKHAIL VINOGRADOV
- Versão: 1.0
- Ativações: 5
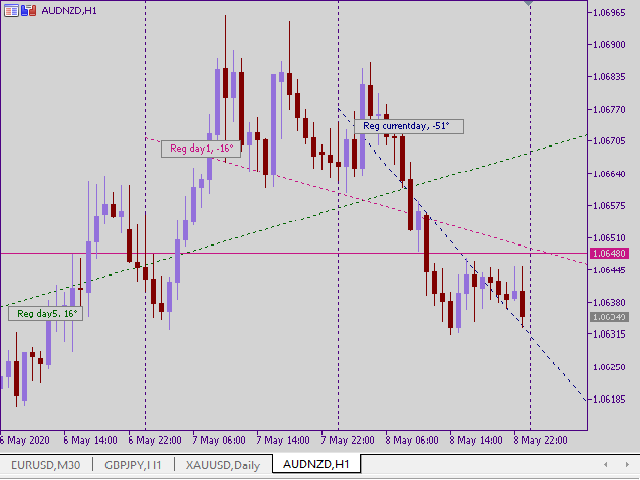
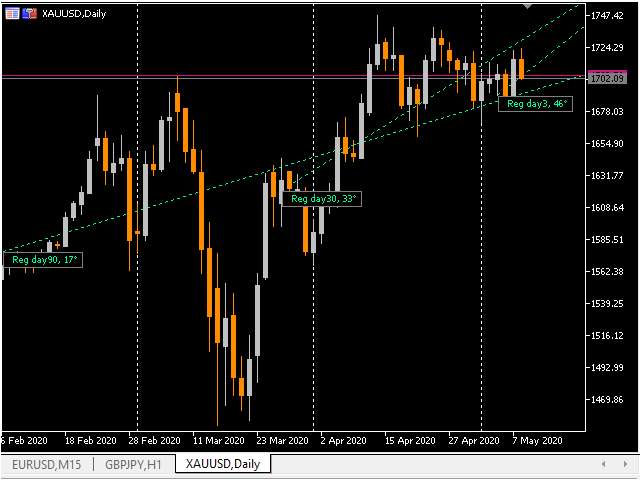
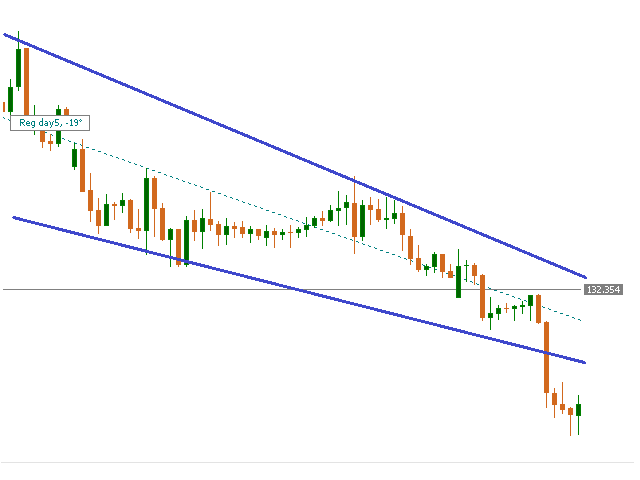
O indicador de regressão mostra a direção da tendência. O gráfico mostra até 3 linhas de regressão com diferentes períodos de tempo. A
linha reta é construída como a média dentro do canal de ondas do movimento de preços (mostrado em um ScreenShot).
Nesse caso, você pode desativar qualquer uma das linhas. Além disso, o indicador permite alterar a cor de cada linha. É interessante calcular o
ângulo relativo em graus. A exibição do ângulo também pode ser desligada.
Graças a esse indicador, você pode ver a dinâmica das mudanças de tendência ao longo do tempo.

O usuário não deixou nenhum comentário para sua avaliação