The Stock Exchange One Sessions Hours
- Indicadores
- Boguslaw Nejmanowski
- Versão: 11.0
- Atualizado: 3 junho 2021
The Stock Exchange One Sessions Hours version 2.00
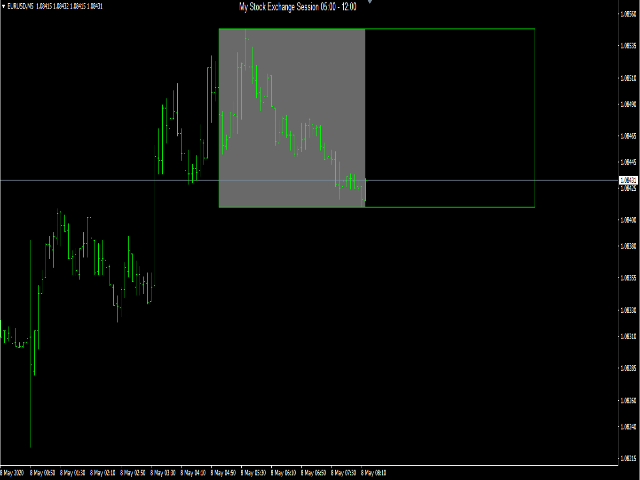
This indicator facilitates observing the currency pair's quotations during subsequent parts of the stock exchange session live. Before
the session starts, a rectangle is drawn on the chart but not filled in with color. It means the extent of the session duration. Before the
first bar enters the rectangle of the session, a sound signal or pop-up window will notify us that the session will just start. When the
price graph crosses the edge of the session rectangle with the elapsing of successive minutes the rectangle fills in steadily with
color. Frequently opening the stock market gives a powerful impetus to the forex market and this graphical interface makes it easier to
locate this moment. Subsequent rectangles of further parts of the session appear over time and the inscription at the top of the chart
window will take up the current session title. After the session, the inscription informs us that the market is closed until the
indicated time of the next day. In the first line of the indicator properties you can enter how many days backwards the indicator is to
show the windows of previous sessions to check its impact on currency pair quotations. All colors and inscriptions can be determined by
yourself. Session hours are recorded in the local time of the place appropriate for a given stock market, however, you must remember to
enter the current time difference in your local time due to summer and winter time changes in different countries of the world. By
default, the time differences to GMT + 1 are entered.