• Visão global
  • Comentários (1)
  • Discussão (1)
  • O que há de novo

RFX Delta Volume

5

Note: This indicator cannot be tested in the strategy tester. Please download the free demo version from https://www.mql5.com/en/market/product/48627

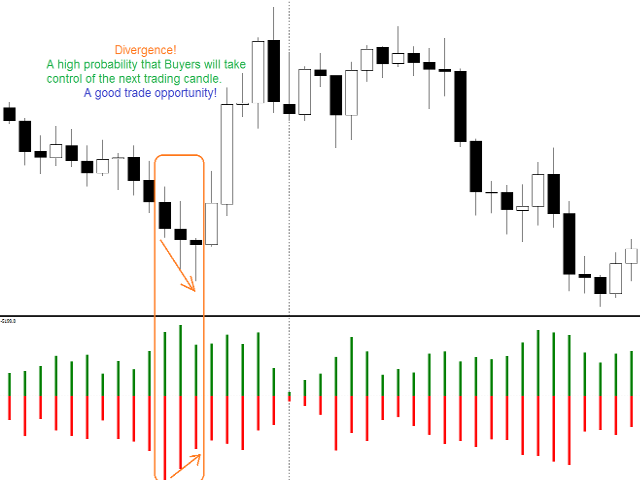
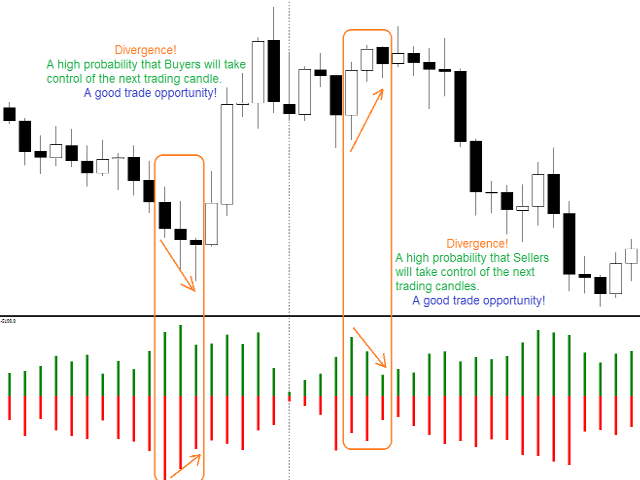
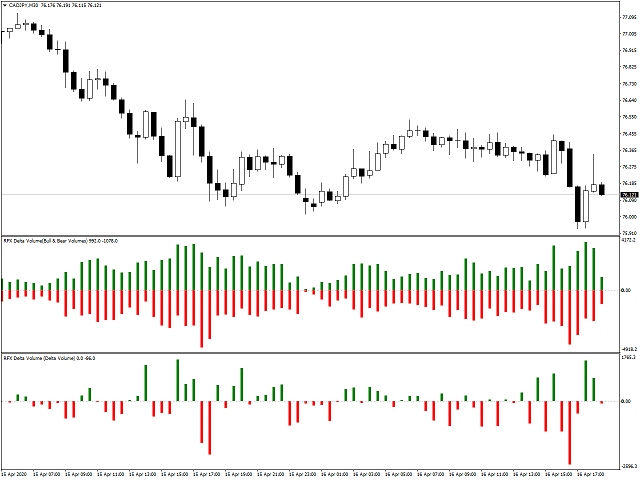
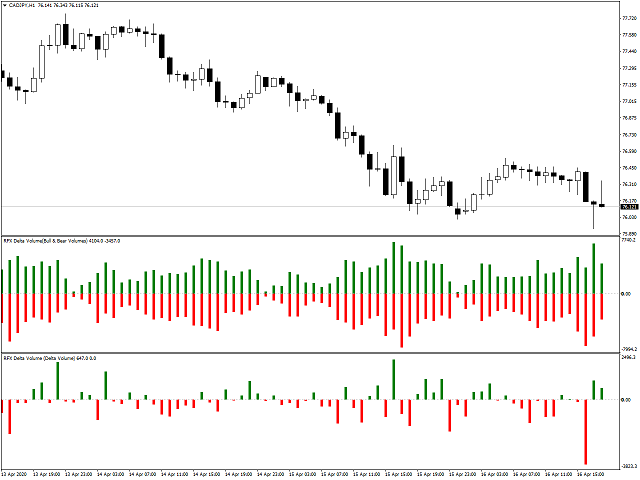
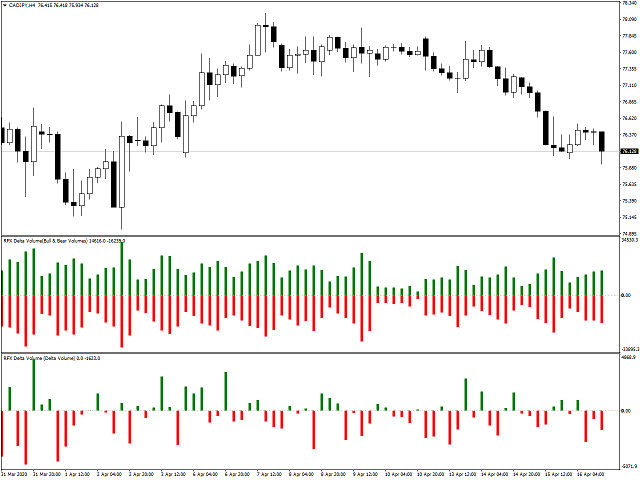
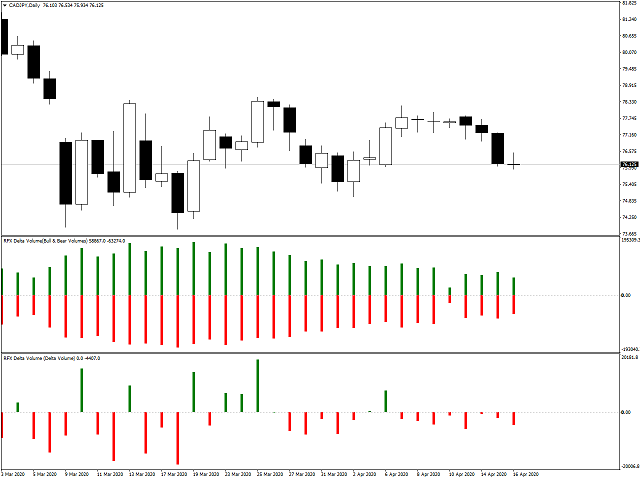
RFX Delta Volume is an indicator to show bullish and bearish volumes separately for each trading candle. The indicator uses history data of one minute (M1) to estimate the true bullish and bearish volumes in a sub-window. There are two modes of operations for this indicator. In mode "Delta Volume", the indicator shows the difference in bullish and bearish volumes. In mode "Bull & Bear Volumes", the indicator shows both bullish and bearish volumes at the same time for each trading candle. It is recommended to use both modes at the same time for each chart to better see the trade opportunities. The buffers of the indicator are all available for those who want to use this indicator in their Expert Advisors.

Input Parameters

  • Load M1 History Data?: If set to true, the indicator first loads all available history M1 data from your broker's server.
  • Look back (bars): The number of candles that the indicator will look back to estimate and show delta volumes.
  • Mode: Delta Volume or Bull & Bear Volumes. Please see the description above.
  • Alert at Signal?: if set to true, the indicator pops up the alert window whenever a Buy/Sell pattern is recognized.
  • Mobile Notification?: if set to true, the indicator sends a mobile notification (to MT4 app) whenever a Buy/Sell pattern is recognized.
  • Email Notification?: if set to true, the indicator sends an email to the user's email whenever a Buy/Sell pattern is recognized.


Comentários 1
DFX
2352
DFX 2020.12.10 22:03 
 

I think the best volume indicator in the market. Volume analysis is largely underevaluated in the forex market although it is very important in order to confirm new trends or anticipate the market... very well done!

Produtos recomendados
Implement
Vitalii Zakharuk
5 (1)
Implement analyzes market dynamics for pivot points. If you want to learn how to spot the correct reversals for consistently likely profitable trading, buy this indicator. Shows favorable moments of entering the market in stripes. Ready-made trading system. The principle of operation of the indicator is to automatically determine the current state of the market when placed on a chart, analyze historical data based on historical data and display instructions for further actions on the trader's
RSI with Bands
Amirhossein Ghasemi Moroodi
Após 7 anos, decidi disponibilizar alguns dos meus próprios indicadores e Expert Advisors (EAs) gratuitamente. Se você os achar úteis, por favor  apoie com uma avaliação de 5 estrelas! Seu feedback me motiva a continuar oferecendo ferramentas gratuitas. Explore minhas outras ferramentas gratuitas aqui . _________________________________ Indicador "RSI com Bandas" – Decisões de Negociação Melhores O indicador "RSI com Bandas" combina o RSI clássico com bandas simples para mostrar
FREE
The   Effort and Result indicator   is based on the work of Karthik Marar; a volume spread analysis trader. It compares a price change (Result) to the volume size (Effort) for a certain period.  By comparing the effort and result, we can get more information about the future price movement. Both values are normalized and converted to a scale of 0 - 100 % based on a selectable look-back period. This indicator is also known as the Effort Index. The law of effort and result The law of effort v
Super trend is one of the best trend indicators in metatrader 4 (MT4). Triple SuperTrend indicator is an indicator that consist of three super trend indicator that can be aranged. This indicator is built by mql4 language and doesn't provided by MT4 platform. Highly recommended using EMA SuperTrend Strategy Indicator if you want to get better result in here: https://www.mql5.com/en/market/product/91664 This indicator is easy to use, power full and has many benefits, there are: Using three ind
FREE
StatsBar
Maksim Kalachev
StatBar 1.6 Indicator showing balance, earnings for today, yesterday and the day before yesterday. The indicator also shows: - Server; - GMT; - Server time; - Shoulder; - Spread. Description of variables: extern int Magic = "-1"; // Magic for statistics -1 = all 0 = manual extern string Symboll = "-1"; // Symbol for statistics -1 = all 0 = current EURUSD = for EURUSD
FREE
1.Determine the trend size based on the chart cycle.   An uptrend near the highest price in a period of time.   A trend down near the lowest price in a period of time. 2.   short-term trends.   Oversold and long;   Overbought, short. 3. Unwind positions based on overbought and oversold and profit points. real-time signal: https://www.mql5.com/zh/signals/1538661?source=Site+Signals+My EA Settings: You need to load EA into the currency pair to trade (M15 time range). The best performing symbol : E
Market Profile
Artem Titarenko
5 (1)
The "Market Profile" indicator displays the profiles and volumes of periods – weekly, daily, session (8-hour), 4-hour, hour, summary. The VAH/VAL price area is automatically highlighted by a dotted line for each profile (except for the summary). The indicator includes chroma Delta, which colors the profile areas. The areas of prevailing Buys is colored in green, that of Sells - in red. The intensity histogram features blue/red respectively. In the filter mode, the indicator displays the volume a
Middle Volume
Stefan Stoyanov
3.5 (2)
The indicator measures volumes on different charts and instruments. Its main advantage is the ability to compare separate brokers. The less Middle Volume and Tick / Second , the more reliable is the broker. There is a comment in the upper left corner Comment data: Tick/Second — number of ticks per second for a selected instrument Middle Volume — average volumes in the penultimate bar This indicator allows tracking a relative market activity for different timeframes. If the volumes are lower than
FREE
Mr Beast Cross Distance
Luis Mariano Vazquez Marcos
MR BEAST 3 MA CROSS DISTANCE RECOMENDED EUR USD TIMEFRAME H1 Este robot de trading de Forex ha sido desarrollado por MRBEAST como una herramienta para facilitar el trading intradía. Tenga en cuenta que el uso de este robot implica ciertos riesgos y no garantiza ganancias consistentes en el mercado de divisas. El robot de trading se basa en algoritmos y estrategias que he diseñado, los cuales se han creado utilizando mi conocimiento y experiencia en el campo del trading. Sin embargo, el rendimien
Master Pullback Mr Beast
Luis Mariano Vazquez Marcos
Master Pullback es un poderoso Asesor Experto (EA) diseñado por MR BEAST que implementa una estrategia de trading basada en retrocesos o "pullbacks" en el mercado de divisas. Este EA identifica oportunidades de trading cuando el precio de un activo se retrae temporalmente en la dirección opuesta a la tendencia principal, lo que permite captar movimientos de corrección antes de que el mercado reanude su tendencia original. La estrategia del Master Pullback está optimizada para operar en pares de
PipFinite Cluster Helix
Karlo Wilson Vendiola
5 (2)
A combination of trend, pullback, range breakouts and statistics in one indicator Mainly functions as an Entry indicator. Works in any pair and timeframe. Suggested Combination Cluster Helix with Strength Meter Strategy: Confirm signals with ideal strength levels Watch Video: (Click Here) Features Detects range breakouts on pullback zones in the direction of the trend Analyzes statistics of maximum profits and calculates possible targets for the next signal Flexible tool, can be used in many
Delta AG
Yurij Kozhevnikov
The difference between the arithmetic and geometric means at the specified range. Since the greater is the difference between the values, the greater the resulting figure is, actually the indicator shows volatility fluctuations. The arithmetic mean of a certain number of values ​​is the sum of the values ​​divided by their number. The geometric mean is the root of the power of the number of values ​​extracted from the product of these values. If all values ​​are equal, the arithmetic mean and th
Um scalper automatizado que negocia em um canal de fraca volatilidade. A essência da estratégia é buscar desvios de tendência e picos anormais de volatilidade, analisados no histórico de um par de moedas. Algoritmos adaptativos são usados para rastrear e abrir negociações.   O robô não usa estratégias de alto risco, tais como: sem martingale, negociação com uma grade de ordens, não execução de negociações, sem níveis mínimos de stop. Prazo de trabalho:   M1 Pares de moedas de trabalho:   AUDCAD,
Определения текущей тенденции одна из самых важных задач трейдера не зависимо от стиля торговли. Индикатор  Price Detect   Volume поможет с достаточно высокой вероятностью это сделать. Price Detect Volume  - индикатор распознавания тенденции, использующий авторский алгоритм расчета, использующий объемы. Показания индикатора не изменяются не при каких условиях. Также с помощью индикатора можно наблюдать за коррекцией цены в сторону глобального тренда, определять возможные границы окончания отката
VWAPIndicator
Ahmet Metin Yilmaz
Volume-weighted average price In finance, volume-weighted average price (VWAP) is the ratio of the value traded to total volume traded over a particular time horizon (usually one day). It is a measure of the average price at which a stock is traded over the trading horizon. VWAP is calculated using the following formula: *It is shown second screenshot in the screenshots. trade that takes place over the defined period of time, excluding cross trades and basket cross trades. for more informatio
Qv2 OBOS
Joao Marcilio
Qv² OBOS é um indicador que visa identificar regiões de sobrecompra e sobrevenda considerando desvio padrão de preços e análise de volume. Os sinais de sobrevenda são indicados por setas apontando para cima. Os sinais de sobrecompra são indicados por setas apontando para baixo. Pode ser usado em todos os prazos. Pode ser usado em todos os pares. Eu uso em H1 Nota importante, o histograma é exibido para melhorar a análise do trader. Mas os sinais de sobre compra e sobre venda são as
This indicator is a high quality trading tool that tracks and displays the relative strengths of the 8 major currencies (EUR,GBP,USD,AUD,NZD,CHF,CAD,& JPY). The relative strength values are obtained using the slope of a moving average. All 28 major currency pairs are analyzed and the slopes of the moving averages are recorded. The base currency of each currency pair is credited with the slope of the MA, whether positive or negative, and the quoted currency is credited with the MA slope * -1. Thi
Colored MACD
Billel Hamza
4.5 (4)
The Normale MACD have 2 Corlors ( 1 for MACD Histogram and 1 for the Signal Line ) This version of Macd have 5 Colors  ( 4 for MACD Histogram and 1 for the Signal Line ) : - When the MACD get a Positive higher value  - When the MACD get a Positive Lower value - When the MACD get a Negative  higher value  - When the MACD get a Negative  Lower value This version have the same input like the normal one : * Fast EMA Period * Slow EMA Period * Signal SMA Period * Applied Price
FREE
Forex Gump Dot is a ready-made mechanical trading system for the +10 pips strategy. This strategy has been actively discussed and developed on the Internet for several years. The essence of this strategy is to open trade operations during the day and fix the minimum profit on each trade operation. That is, scalp. Our development team decided to adapt the indicators of the Forex Gump family and release a new product that will best match the scalping trading strategy. This product is Forex Gump Do
The CCI Dashboard is an information panel which allows you to have a global market vision through a Commodity Channel Index. CCI Dashboard analyzes and tracks all the actives you want to invest in. Take advantage of this useful dashboard where you can open in a few seconds the chart and quickly invest on it. Main Features of CCI Dashboard Graphic panel that allows you to know the situation of many assets. 7 Different Commodity Channel Index situations to discover when an asset is overbought or
Esse indicador mede o 1º Canal de referencia e a 1º  Zona Neutra * configurar o canal macro para verificar a frequencia MAIOR H1 H4 1D * configurar o canal micro para verificar a frequencia Menor 1M 5M 15M Como instalar o Indicador fimathe. E uma pré mentoria tem uma estrategia Secreta bonus nesse video . assitao o video para enteder as logicas que podemos iniciar com esse indicador. https://www.youtube.com/playlist?list=PLxg54MWVGlJzzKuaEntFbyI4ospQi3Kw2
FREE
EUR 1 of 8 MT4
Tomas Michalek
Plug & Play portfolio - series of high-quality EURUSD H1 strategies for maximized success. This EA alone can bring you great profits, but for the best results check also rest of the  EUR portfolio . Strategy is using CCI indicator for finding suitable trade and then sets the pending order according to daily extremes. No grid, no martingale, no tuned backtest, no fairytales, but   real results. This EA has passed 9 robustness tests, indicating good strategy quality. Benefits for you Plug & Pla
Indicator is used for: defining price probability distributions. This allows for a detailed representation of the channel and its borders and forecast the probability of a price appearing at each segment of its fluctuations; defining the channel change moment.   Operation principles and features Indicator analyzes a quote history on lower timeframes and calculates a price probability distribution on higher ones. Forecast algorithms allow the indicator to calculate probability distributions and m
BoxInside MT4
Evgeny Shevtsov
4.86 (7)
This indicator calculates the volume profile and places labels that correspond to the VAH, VAL and POC levels, for each candle individually. Indicator operation features The indicator works on the timeframes from M5 to MN, but it uses the history data of smaller periods: M1 - for periods from M5 to H1, M5 - for the H4 period, M30 - for the D1 period, H4 - for the W1 period, D1 - for the MN period. The color and location of the VAL, VAH and POC labels on the current candle are considered to be
FREE
Blahtech VWAP
Blahtech Limited
5 (2)
Was: $69    Now: $34   Blahtech VWAP - Volume Weighted Average Price (VWAP) is the ratio of price to total volume. It provides an average price over a specified time interval.  Links [  Install  |  Update  |  Documentation   ] Feature Highlights Configurable VWAP Line Sessions, intervals, anchored or continuous Previous day settlement line Standard Deviation bands Alerts at bar close or real time Automatic Broker or Tick volumes Significantly reduced CPU usage Input Parameters Expert Advis
Features: 1- Get OB/OS Levels from Golden MA Levels 2- Wait for Buy/Sell Start Level Cross 3- Optional: Should price cross Mid Level in earlier bars 4- Optional: Crossing bar High/Medium Volume 5- Optional: MA Stacked to check up/down trend for current TF 6- Optional: NRTR higher timeframes aligned Check Detailed blog post explained: https://www.mql5.com/en/blogs/post/758457 Levels with Buffers available here: Golden MA Levels Indicator: https://www.mql5.com/en/market/product/119515
FREE
The   Volume Weighted ATR indicator   is a helpful tool for measuring market activity. It is based on the idea of the Volume-Weighted ATR. Combining these two elements helps identify potential turning points or breakout opportunities. The indicator for the classification of the activity of the market uses the moving average and its multiples. Accordingly, where the VWATR bar is located (relative to the moving average), it is labelled as ultra-low, low, average, high, very high or ultra high. Th
FREE
Market Profile 3
Hussien Abdeltwab Hussien Ryad
3 (2)
Market Profile 3 MetaTrader 4 indicator  — is a classic Market Profile implementation that can show the price density over time, outlining the most important price levels, value area, and control value of a given trading session. This indicator can be attached to timeframes between M1 and D1 and will show the Market Profile for daily, weekly, monthly, or even intraday sessions. Lower timeframes offer higher precision. Higher timeframes are recommended for better visibility. It is also possible t
FREE
Multi Timeframe ZigZag Indicator
Salman A A A T Bakhash
5 (2)
Description: This indicator draw ZigZag Line in multiple time frame also search for Harmonic patterns before completion of the pattern. Features: Five instances of ZigZag indicators can be configured to any desired timeframe and inputs. Draw Harmonic pattern before pattern completion. Display Fibonacci retracement ratios. Configurable Fibonacci retracement ratios. Draw AB=CD based on Fibonacci retracement you define. You can define margin of error allowed in Harmonic or Fibonacci calculatio
FREE
Cancer
Vitalii Zakharuk
Cancer indicator is great for trend trading! An intelligent indicator algorithm with high probability shows the points of potential market reversal. If you are trading in a trend, then a trading strategy built on the basis of this indicator is perfect for you. The indicator filters out market noise, almost everything and all the necessary functions for working with a thread are built into one tool. It works on all currency pairs and on all timeframes, indicator setting - according to your desire
Os compradores deste produto também adquirem
Gann Made Easy
Oleg Rodin
4.85 (82)
Gann Made Easy é um sistema de negociação Forex profissional e fácil de usar, baseado nos melhores princípios de negociação usando a teoria do sr. W. D. Gann. O indicador fornece sinais precisos de COMPRA e VENDA, incluindo níveis de Stop Loss e Take Profit. Você pode negociar mesmo em movimento usando notificações PUSH. Entre em contato comigo após a compra! Vou compartilhar minhas dicas de negociação com você e ótimos indicadores de bônus de graça! Provavelmente você já ouviu muitas vezes sobr
- Real price is 80$ - 40% Discount ( It is 49$ now ) Contact me for instruction, add group and any questions! Related Product:  Bitcoin Expert , Gold Expert Introduction The breakout and retest strategy is traded support and resistance levels. it involves price breaking through a previous level.  The break and retest strategy is designed to help traders do two main things, the first is to avoid false breakouts. Many false breakouts start with a candlestick that breaks out of a level but ends wi
Atomic Analyst
Issam Kassas
5 (2)
Primeiramente, vale ressaltar que este Indicador de Negociação não repinta, não redesenha e não apresenta atrasos, tornando-o ideal tanto para negociação manual quanto automatizada. Manual do utilizador: configurações, entradas e estratégia. O Analista Atômico é um Indicador de Ação de Preço PA que utiliza a força e o momentum do preço para encontrar uma vantagem melhor no mercado. Equipado com filtros avançados que ajudam a remover ruídos e sinais falsos, e aumentam o potencial de negociação.
Scalper Inside PRO
Alexey Minkov
4.73 (56)
An exclusive indicator that utilizes an innovative algorithm to swiftly and accurately determine the market trend. The indicator automatically calculates opening, closing, and profit levels, providing detailed trading statistics. With these features, you can choose the most appropriate trading instrument for the current market conditions. Additionally, you can easily integrate your own arrow indicators into Scalper Inside Pro to quickly evaluate their statistics and profitability. Scalper Inside
Gold Stuff
Vasiliy Strukov
4.89 (239)
Gold Stuff-um indicador de tendência projetado especificamente para o ouro, também pode ser usado em qualquer instrumento financeiro. O indicador não é redesenhado ou atrasado. O timeframe recomendado é H1. O EA Gold Stuff Expert Advisor está escrito neste indicador, você pode encontrá-lo no meu perfil. Importante! Entre em contato comigo imediatamente após a compra para obter instruções e bônus!  Você pode obter uma cópia gratuita do nosso indicador Strong Support e Trend Scanner, envie um
Actualmente 20% OFF ! A melhor solução para qualquer novato ou comerciante especializado! Este software de painel de instrumentos está a funcionar em 28 pares de moedas. É baseado em 2 dos nossos principais indicadores (Advanced Currency Strength 28 e Advanced Currency Impulse). Dá uma grande visão geral de todo o mercado Forex. Mostra valores avançados de força da moeda, velocidade de movimento da moeda e sinais para 28 pares de divisas em todos os (9) períodos de tempo. Imagine como a sua
Enigmera
Ivan Stefanov
5 (3)
ENIGMERA: O núcleo do mercado https://www.enigmera.com Introdução Este indicador e sistema de negociação é uma abordagem notável aos mercados financeiros. ENIGMERA utiliza os ciclos fractais para calcular com precisão os níveis de suporte e resistência. Mostra a autêntica fase de acumulação e dá direcções e objectivos.  Um sistema que funciona quer estejamos numa tendência ou numa correção.  Como é que funciona? O ENIGMERA é composto por três linhas: a linha de suporte/resistência, a linha
TPSproTREND PrO
Roman Podpora
4.79 (19)
TPSpro TREND PRO   é um indicador de tendência que analisa automaticamente o mercado e fornece informações sobre a tendência e cada uma de suas mudanças, além de dar sinais para entrar em negociações sem redesenhar! O indicador utiliza cada vela, analisando-as separadamente. referindo-se a diferentes impulsos - impulso para cima ou para baixo. Pontos de entrada exatos em transações de moedas, criptomoedas, metais, ações, índices! Versão MT5                   DESCRIÇÃO COMPLETA DO INDICADOR    
Dynamic Forex28 Navigator - A ferramenta de negociação Forex de última geração. ATUALMENTE 49% DE DESCONTO. Dynamic Forex28 Navigator é a evolução dos nossos indicadores populares de longa data, combinando o poder de três em um: Indicador Advanced Currency Strength28 (695 avaliações) + Advanced Currency IMPULSE com ALERTA (520 avaliações) + Sinais CS28 Combo (Bônus). Detalhes sobre o indicador https://www.mql5.com/en/blogs/post/758844 O que o Next-Generation Strength Indicator oferece?  T
Trend Punch
Mohamed Hassan
4.95 (19)
This indicator is unstoppable when combined with our other indicator called  Support & Resistance . After purchase, send us a message and you will get it   for  FREE as a BONUS! Introducing Trend Punch , the revolutionary forex trend indicator that will transform the way you trade! Trend Punch is uniquely designed to provide precise buy and sell arrows during strong market trends, making your trading decisions clearer and more confident. Whether you're trading major currency pairs or exotic sym
Trend Screener
STE S.S.COMPANY
4.8 (87)
Indicador de tendência, solução única inovadora para negociação e filtragem de tendências com todos os recursos de tendências importantes construídos dentro de uma ferramenta! É um indicador multi-timeframe e multi-moedas 100% sem repintura que pode ser usado em todos os símbolos/instrumentos: forex, commodities, criptomoedas, índices e ações. OFERTA POR TEMPO LIMITADO: O indicador Support and Resistance Screener está disponível por apenas US$ 50e vitalício. (Preço original US$ 250) (oferta este
FX Volume
Daniel Stein
4.58 (33)
Receba a sua atualização diária do mercado com detalhes e screenshots através do nosso Morning Briefing aqui no mql5 e no Telegram ! O Volume FX é o PRIMEIRO e ÚNICO indicador de volume que fornece uma visão REAL do sentimento do mercado do ponto de vista de um corretor. Ele fornece uma visão incrível de como os participantes do mercado institucional, como corretores, estão posicionados no mercado Forex, muito mais rápido do que os relatórios COT. Ver essas informações diretamente no seu gráfi
TPSpro RFI Levels
Roman Podpora
4.82 (22)
INSTRUÇÕES         Russo   -        ENG       R   ecomendado para uso com um indicador       -       TPSpro   TREND PRO -   Versão MT4         Um elemento-chave na negociação são as zonas ou níveis a partir dos quais as decisões de comprar ou vender um instrumento de negociação são tomadas. Apesar das tentativas dos principais participantes de esconder sua presença no mercado, eles inevitavelmente deixam rastros. Nossa tarefa era aprender como identificar esses rastros e interpretá-los corretame
FX Power MT4 NG
Daniel Stein
5 (13)
Receba a sua atualização diária do mercado com detalhes e screenshots através do nosso Morning Briefing aqui no mql5 e no Telegram ! O FX Power MT4 NG é a próxima geração do nosso medidor de força de moeda muito popular de longa data, o FX Power. E o que é que este medidor de força da próxima geração oferece? Tudo o que adorou no FX Power original MAIS Análise de força GOLD/XAU Resultados de cálculo ainda mais precisos Períodos de análise configuráveis individualmente Limite de cálculo personal
Antes de tudo, vale ressaltar que esta Ferramenta de Negociação é um Indicador Não Repintante, Não Redesenhante e Não Atrasado, o que a torna ideal para negociação profissional. Curso online, manual do utilizador e demonstração. O Indicador de Conceitos de Ação de Preço Inteligente é uma ferramenta muito poderosa tanto para traders novos quanto experientes. Ele combina mais de 20 indicadores úteis em um único, combinando ideias avançadas de negociação como Análise do Trader do Círculo Interno e
Ultimate Gold Advisor para MetaTrader 4 O Ultimate Gold Advisor é uma ferramenta tecnológica avançada projetada para otimizar a experiência de negociação no MetaTrader 4. Criado para atender às necessidades de traders experientes, este indicador combina precisão, análise sofisticada e funcionalidade versátil, oferecendo suporte para decisões de negociação informadas. Ideal para negociação de ouro, mas aplicável a uma ampla gama de ativos, o Ultimate Gold Advisor pode ajudá-lo a melhorar suas es
Stratos Pali
Michela Russo
5 (1)
Stratos Pali Indicator   is a revolutionary tool designed to enhance your trading strategy by accurately identifying market trends. This sophisticated indicator uses a unique algorithm to generate a complete histogram, which records when the trend is Long or Short. When a trend reversal occurs, an arrow appears, indicating the new direction of the trend. Important Information Revealed Leave a review and contact me via mql5 message to receive My Top 5 set files for Stratos Pali at no cost! D
Legacy of Gann
Pavel Zamoshnikov
4.83 (12)
The indicator very accurately determines the levels of the possible end of the trend and profit fixing. The method of determining levels is based on the ideas of W.D.Gann, using an algorithm developed by his follower Kirill Borovsky. Extremely high reliability of reaching levels (according to K. Borovsky  - 80-90%) Indispensable for any trading strategy – every trader needs to determine the exit point from the market! Precisely determines targets on any timeframes and any instruments (forex, met
Gold Channel   é um indicador baseado na volatilidade, desenvolvido com um algoritmo de tempo especifico para o par XAUUSD que consiste em encontrar possíveis correções no mercado. Este indicador mostra duas linhas exteriores, uma interior (linha de retração) e um sinal de seta, onde a teoria do canal consiste em ajudar a identificar condições de sobrecompra e sobrevenda no mercado. O preço do mercado cairá geralmente entre os limites do canal. Se os preços tocarem ou se moverem para fora do can
Currency Strength Wizard é um indicador muito poderoso que fornece uma solução completa para uma negociação bem-sucedida. O indicador calcula o poder deste ou daquele par forex usando os dados de todas as moedas em vários intervalos de tempo. Esses dados são representados em uma forma de índice de moeda fácil de usar e linhas de energia de moeda que você pode usar para ver o poder desta ou daquela moeda. Tudo o que você precisa é anexar o indicador ao gráfico que deseja negociar e o indicador mo
GOLD Impulse with Alert
Bernhard Schweigert
4.56 (9)
Este indicador é uma super combinação dos nossos 2 produtos Advanced Currency IMPULSE with ALERT  +   Currency Strength Exotics . Funciona para todos os períodos de tempo e mostra graficamente impulso de força ou fraqueza para as 8 principais moedas mais um Símbolo! Este Indicador é especializado para mostrar a aceleração da força da moeda para quaisquer símbolos como Ouro, Pares Exóticos, Commodities, Índices ou Futuros. É o primeiro do seu género, qualquer símbolo pode ser adicionado à
Scalper Vault
Oleg Rodin
5 (27)
Scalper Vault é um sistema profissional de escalpelamento que fornece tudo o que você precisa para um escalpelamento bem-sucedido. Este indicador é um sistema de negociação completo que pode ser usado por comerciantes de forex e opções binárias. O período de tempo recomendado é M5. O sistema fornece sinais de seta precisos na direção da tendência. Ele também fornece sinais superiores e inferiores e níveis de mercado Gann. Os indicadores fornecem todos os tipos de alertas, incluindo notificações
Market Structure
Reza Aghajanpour
4.85 (26)
** All Symbols x All Timeframes scan just by pressing scanner button ** *** Contact me  to send you instruction and add you in "Market Structure group" for sharing or seeing experiences with other users. Introduction: Market structure is important for both new and professional traders since it can influence the liquidity and price action of a market (Breakout and Retest). It’s also one of the most commonly used techniques to understand trends, identify potential reversal points, and get a feel f
Matrix Arrow Indicator MT4
Juvenille Emperor Limited
5 (3)
O Matrix Arrow Indicator MT4 é uma tendência única 10 em 1 seguindo um indicador multi-timeframe 100% sem repintura que pode ser usado em todos os símbolos/instrumentos: forex, commodities, criptomoedas, índices, ações. O Matrix Arrow Indicator MT4 determinará a tendência atual em seus estágios iniciais, reunindo informações e dados de até 10 indicadores padrão, que são: Índice de movimento direcional médio (ADX) Índice de canal de commodities (CCI) Velas clássicas de Heiken Ashi Média Móvel Di
IX Power MT4
Daniel Stein
5 (5)
O IX Power traz finalmente a precisão imbatível do FX Power para símbolos não-Forex. Determina com exatidão a intensidade das tendências a curto, médio e longo prazo nos seus índices, acções, mercadorias, ETFs e até criptomoedas favoritos. Pode analisar tudo o que o seu terminal tem para oferecer. Experimente e veja como o seu timing melhora significativamente quando negoceia. Características principais do IX Power Resultados de cálculo 100% precisos e sem repintura - para todos os símb
ACTUALMENTE 31% DE DESCONTO!! A melhor solução para qualquer novato ou comerciante especializado! Este indicador é uma ferramenta comercial única, de alta qualidade e acessível, porque incorporámos uma série de características proprietárias e uma fórmula secreta. Com apenas UM gráfico, dá alertas para todos os 28 pares de moedas. Imagine como a sua negociação irá melhorar porque é capaz de identificar o ponto exacto de desencadeamento de uma nova tendência ou oportunidade de escalada! Con
Deixe um comentário após a compra para receber 4 indicadores de alta qualidade como bônus. O indicador Chart Patterns All-in-One ajuda os traders a visualizar vários padrões gráficos comumente usados na análise técnica. Este indicador auxilia na identificação de comportamentos potenciais do mercado, mas não garante rentabilidade. Recomenda-se testar o indicador no modo demo antes de comprar. Oferta atual : Desconto de 50% no indicador "Chart Patterns All in One". Padrões incluídos : Padrão 1-2-3
Torne-se um Negociador Breaker e lucre com as mudanças na estrutura do mercado à medida que o preço reverte. O indicador de quebra de bloco de pedidos identifica quando uma tendência ou movimento de preço está chegando à exaustão e pronto para reverter. Ele o alerta sobre mudanças na estrutura do mercado, que normalmente ocorrem quando uma reversão ou uma grande retração está prestes a ocorrer. O indicador usa um cálculo proprietário que identifica rupturas e momento do preço. Toda vez que
Blahtech Supply Demand
Blahtech Limited
4.61 (33)
Was: $299  Now: $99   Supply Demand uses previous price action to identify potential imbalances between buyers and sellers. The key is to identify the better odds zones, not just the untouched ones. Blahtech Supply Demand indicator delivers functionality previously unavailable on any trading platform. This 4-in-1 indicator not only highlights the higher probability zones using a multi-criteria strength engine, but also combines it with multi-timeframe trend analysis, previously confirmed swings
Mais do autor
Adaptive Stochastic
Rasoul Mojtahedzadeh
5 (2)
Stochastic Oscillator is one of the most popular and accurate oscillators widely used by traders to capture overbought and oversold areas of price action. Although the Stochastic indicator works fine for an interval of the market, it fails to generate profitable signals when the market conditions change, and hence it produces wrong signals resulting in big losses. Have you ever thought about an adaptive Stochastic indicator that adapts its period of calculation based on the market conditions? Th
Adaptive RSI
Rasoul Mojtahedzadeh
5 (2)
Relative Strength Index (RSI) is one of the most popular and accurate oscillators widely used by traders to capture overbought and oversold areas of price action. Although the RSI indicator works fine for a period of market, it fails to generate profitable signals when market condition changes, and hence produces wrong signals which results in big losses. Have you ever thought about an adaptive RSI indicator that adapts its period of calculation based on the market conditions? The presented indi
Trendometer
Rasoul Mojtahedzadeh
5 (2)
Identifying the trend of the market is an essential task of traders. Trendometer implements an advanced algorithm to visualize the trend of the market. The major focus of this indicator is to evaluate the market in the lower time frames (i.e., M1, M5 and M15) for the scalping purposes. If you are a scalper looking for a reliable indicator to improve your trade quality, Trendometer is for you. The indicator runs on a separate window showing a histogram of red and green bars. A two consecutive gre
RFX EasyTrade
Rasoul Mojtahedzadeh
5 (1)
RFX EasyTrade  is a professional panel to make your trades as easy as possible. You can perform scalping by acting fast and efficient. You can draw a box or a trend line and let RFX EasyTrade to catch a breakout and manage the trade automatically. You can set pending orders and set Order-Cancels-Order easily. If you are a fan of Martingale strategy just set a few settings on the panel and let RFX EasyTrade to automatically manage the trades. You can trade based on time without waiting long time
Bull Bear Powers
Rasoul Mojtahedzadeh
Bull Bear Powers indicator shows the absolute power of bulls and bears in the market. Both powers are shown simultaneously with red and green colors for bear and bull powers respectively. When red line goes over the green line it means that bears are controlling the market. When green line goes over the red line it means that bulls are controlling the market. The green/red horizontal symbol line at the bottom of the indicators shows which party has more strength. Time Frame: M30 and H1 are recom
RFX Forex Strength Meter
Rasoul Mojtahedzadeh
5 (1)
RFX Forex Strength Meter is a powerful tool to trade 8 major currencies in the Forex market, U.S. Dollar ( USD ) European Euro ( EUR ) British Pound ( GBP ) Swiss Franc ( CHF ) Japanese Yen ( JPY ) Australian Dollar ( AUD ) Canadian Dollar ( CAD ) New Zealand Dollar ( NZD ) The indicator calculates the strength of each major currency using a unique and accurate formula starting at the beginning of each trading day of your broker. Any trading strategy in the Forex market can be greatly improved
RFX Market Speed
Rasoul Mojtahedzadeh
RFX Market Speed is an indicator designed to measure a new dimension of the market which has been hidden from the most traders. The indicator measures the speed of the market in terms of points per second and shows the measurements graphically on the chart, and saves the maximum bullish and bearish speeds per each bar. This indicator is specially designed to help the scalpers of any market with their decisions about the short bias of the market. Note: The indicator uses real-ticks and CANNOT be
RFX Forecast Bands
Rasoul Mojtahedzadeh
The RFX Forecast Bands indicator calculates the three significant confidence levels, 99%, 95% and 68% of price movement for a configurable number of bars in the future. The essence of calculations is based on statistical analysis of the asset's recent price changes. These levels can be used for many different purposes in trading systems. For example, one can use them for setting the target profit and stop loss levels effectively. The extreme upper and lower bands represent 99% confidence level,
RFX Market Speed MT5
Rasoul Mojtahedzadeh
RFX Market Speed is an indicator designed to measure a new dimension of the market which has been hidden from the most traders. The indicator measures the speed of the market in terms of points per seconds and shows the measurement graphically on the chart, and saves the maximum bullish and bearish speeds per each bar. This indicator is specially designed to help the scalpers of any market with their decisions about the short bias of the market. The indicator uses real-ticks and cannot be fully
RFX5 Forex Strength Meter
Rasoul Mojtahedzadeh
5 (1)
RFX Forex Strength Meter is a powerful tool to trade 8 major currencies in the Forex market, U.S. Dollar ( USD ) European Euro ( EUR ) British Pound ( GBP ) Swiss Franc ( CHF ) Japanese Yen ( JPY ) Australian Dollar ( AUD ) Canadian Dollar ( CAD ) New Zealand Dollar ( NZD ) The indicator calculates the strength of each major currency using a unique and accurate formula starting at the beginning of each trading day of your broker. Any trading strategy in the Forex market can be greatly improved
RFX5 Trendometer
Rasoul Mojtahedzadeh
Identifying the trend of the market is an essential task of traders. Trendometer implements an advanced algorithm to visualize the trend of the market. The major focus of this indicator is to evaluate the market in the lower time frames (i.e., M1, M5 and M15) for the scalping purposes. If you are a scalper looking for a reliable indicator to improve your trade quality, Trendometer is for you. The indicator runs on a separate window showing a histogram of red and green bars. A two consecutive gre
Pairs Trading Expert
Rasoul Mojtahedzadeh
This expert advisor implements the conventional quantitative trading algorithm known as Pairs Trading. It operates by identifying a hedge ratio between two correlated trading symbols, thereby generating a synthetic stationary symbol suitable for trading through a mean-reversion strategy. The expert advisor dynamically computes the optimal hedge ratio for the selected symbols and initiates synthetic BUY/SELL positions when the spread of the synthetic price deviates from the mean level, reaching e
RFX5 Bull Bear Powers   indicator shows the absolute power of bulls and bears controlling the market. Both powers are shown simultaneously with red and green colors for bear and bull powers respectively. When red line goes over the green line it means that bears are controlling the market. When green line goes over the red line it means that bulls are controlling the market. The green/red horizontal symbol line at the bottom of the indicators shows which party has more strength. Time Frame:   M3
Filtro:
DFX
2352
DFX 2020.12.10 22:03 
 

I think the best volume indicator in the market. Volume analysis is largely underevaluated in the forex market although it is very important in order to confirm new trends or anticipate the market... very well done!

Responder ao comentário
Versão 1.4 2020.04.21
- Bug fix: Loading M1 history data from server.
- Improved performance.
Versão 1.3 2020.04.20
- Add Buy/Sell signal pattern recognition
- Add Alert pop-up on signals
- Add sending mobile notifications on signals
- Add sending email notifications on signals