• Visão global
  • Comentários (10)
  • Discussão (171)
  • O que há de novo

Currency Strength Meter Pro for MT4

4.22

Currency Strength Meter is the easiest way to identify strong and weak currencies. This indicator shows the relative strength of 8 major currencies + Gold: AUD, CAD, CHF, EUR, GBP, JPY, NZD, USD, XAU. Gold symbol can be changed to other symbols like XAG, XAU etc.


By default the strength value is normalised to the range from 0 to 100 for RSI algorithm:

  • The value above 60 means strong currency;
  • The value below 40 means weak currency;


This indicator needs the data of all 28 major currency pairs and 9 timeframe.

Use the Expert Adviser Downloadhistory28&9 to download data automatically: https://www.mql5.com/en/blogs/post/728216


This Currency Strength Meter supports many powerful features:

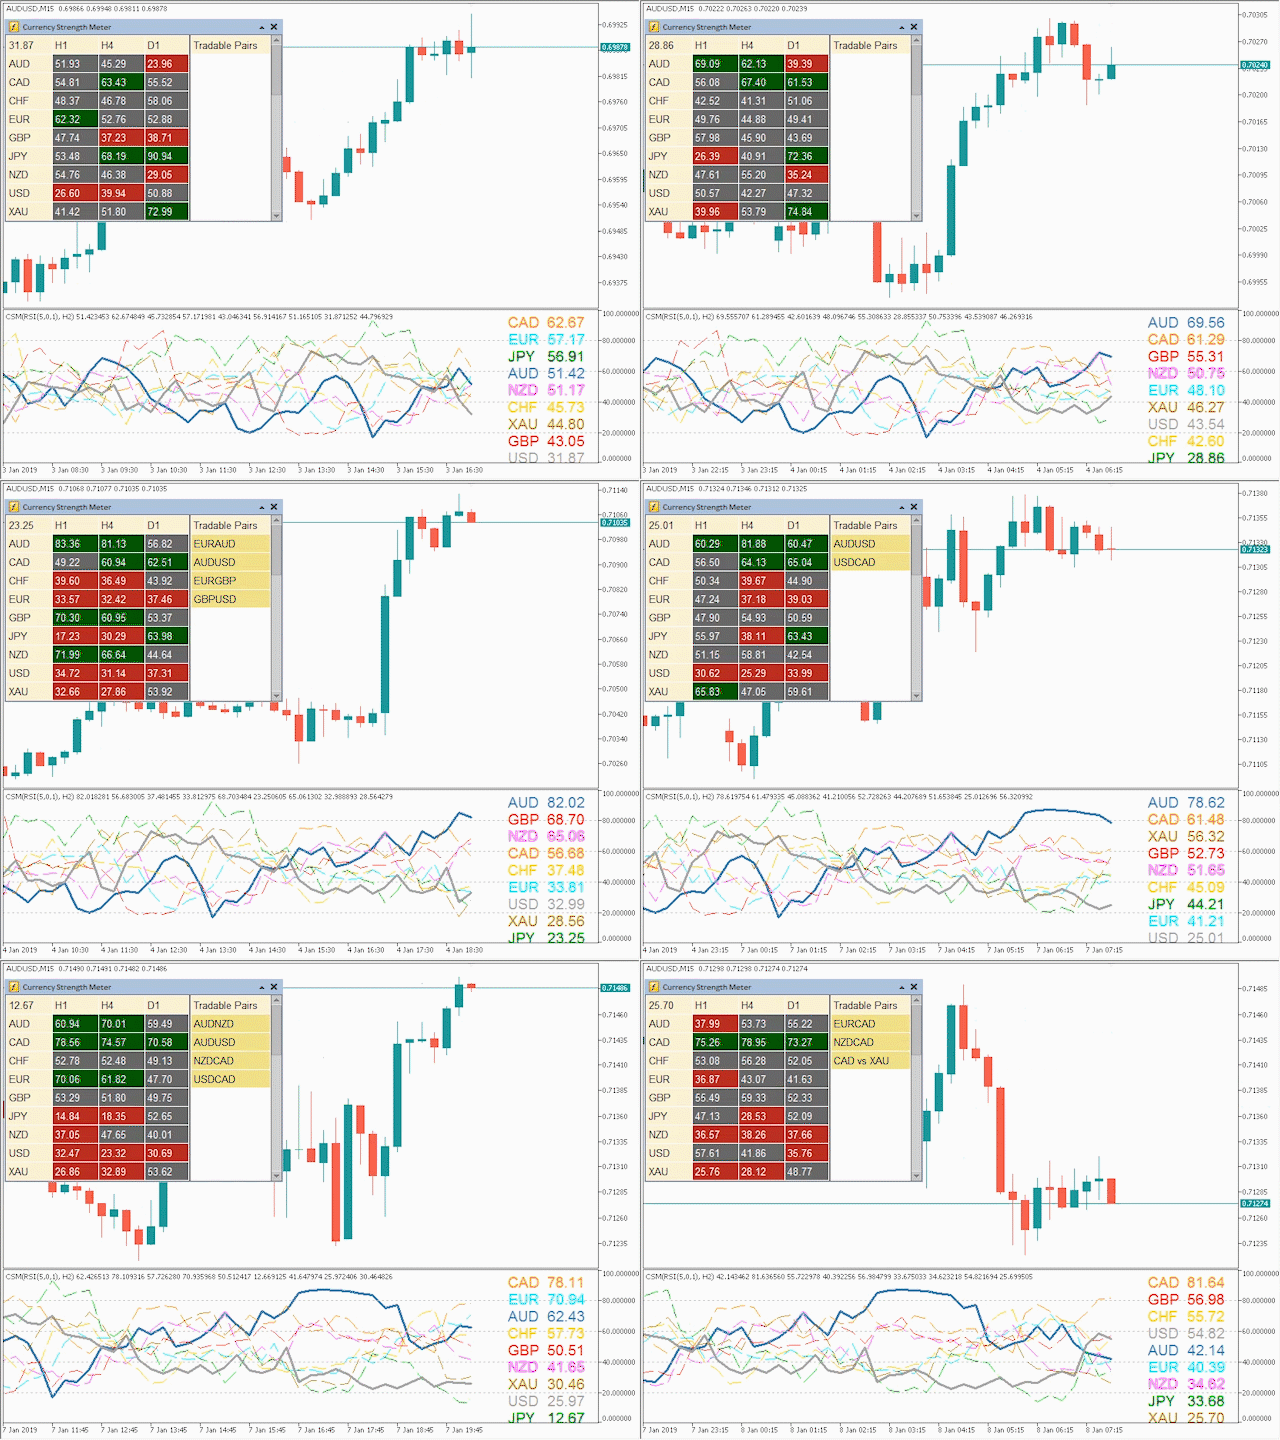
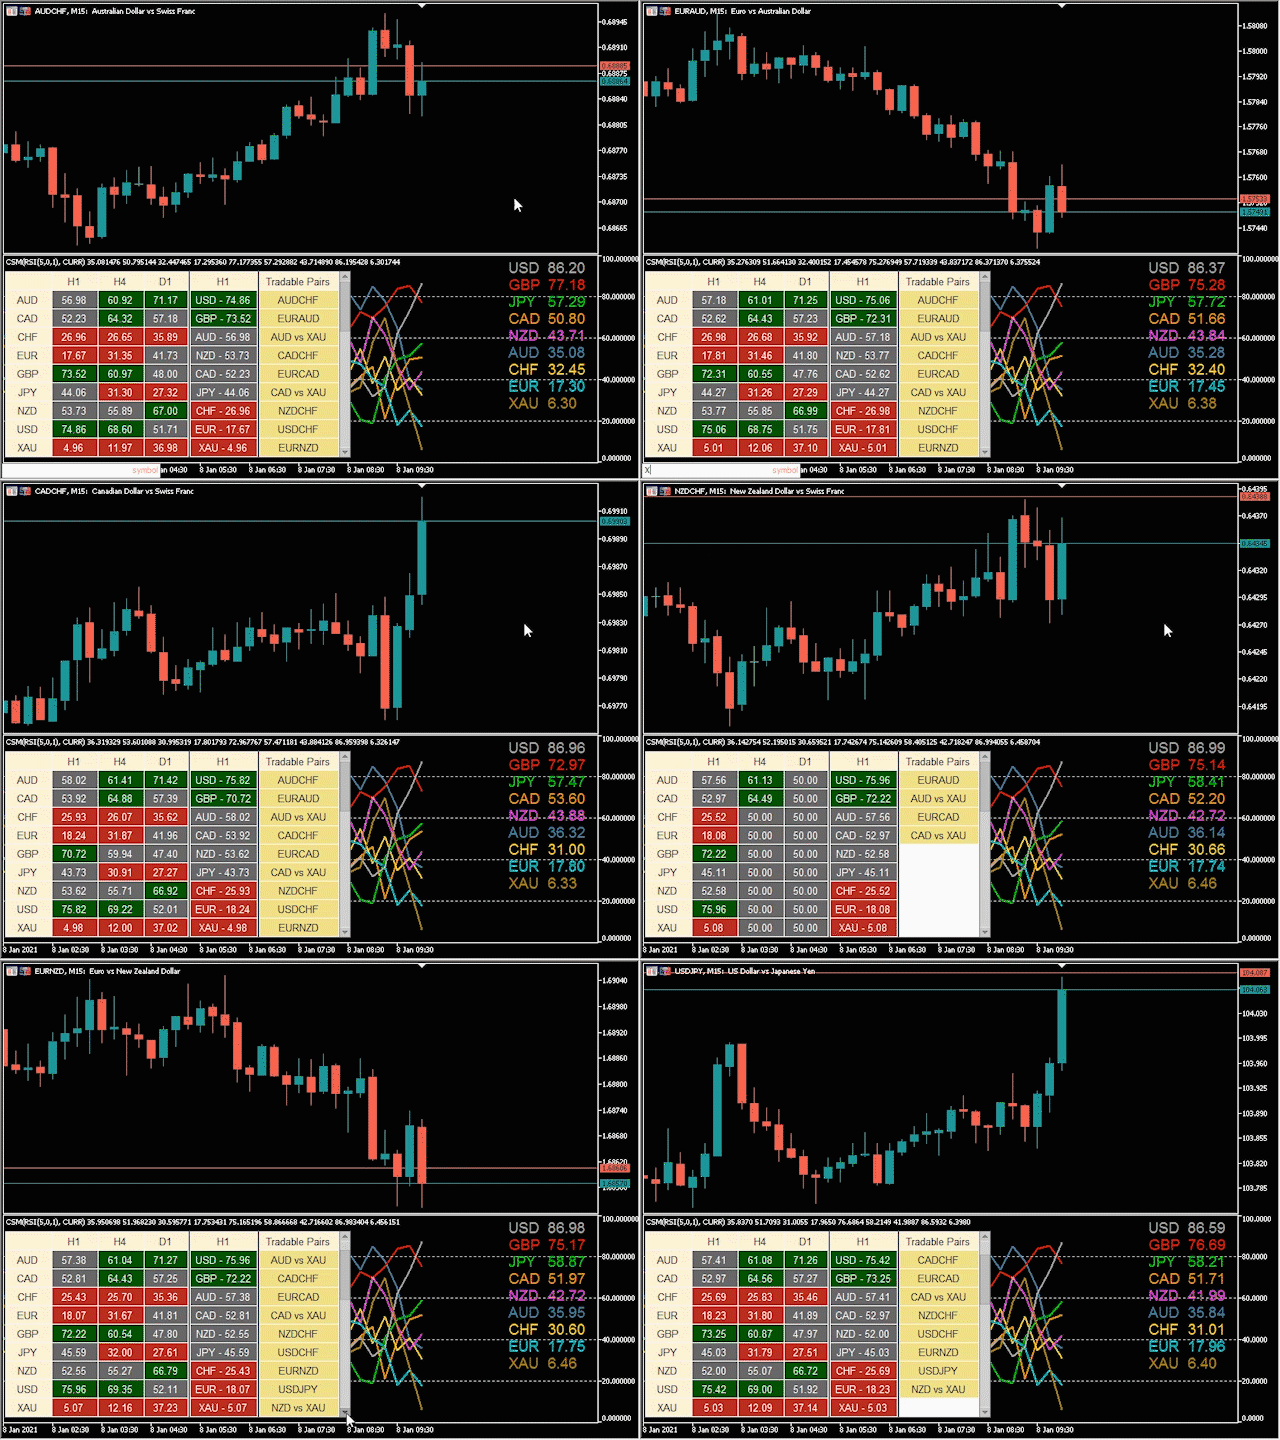
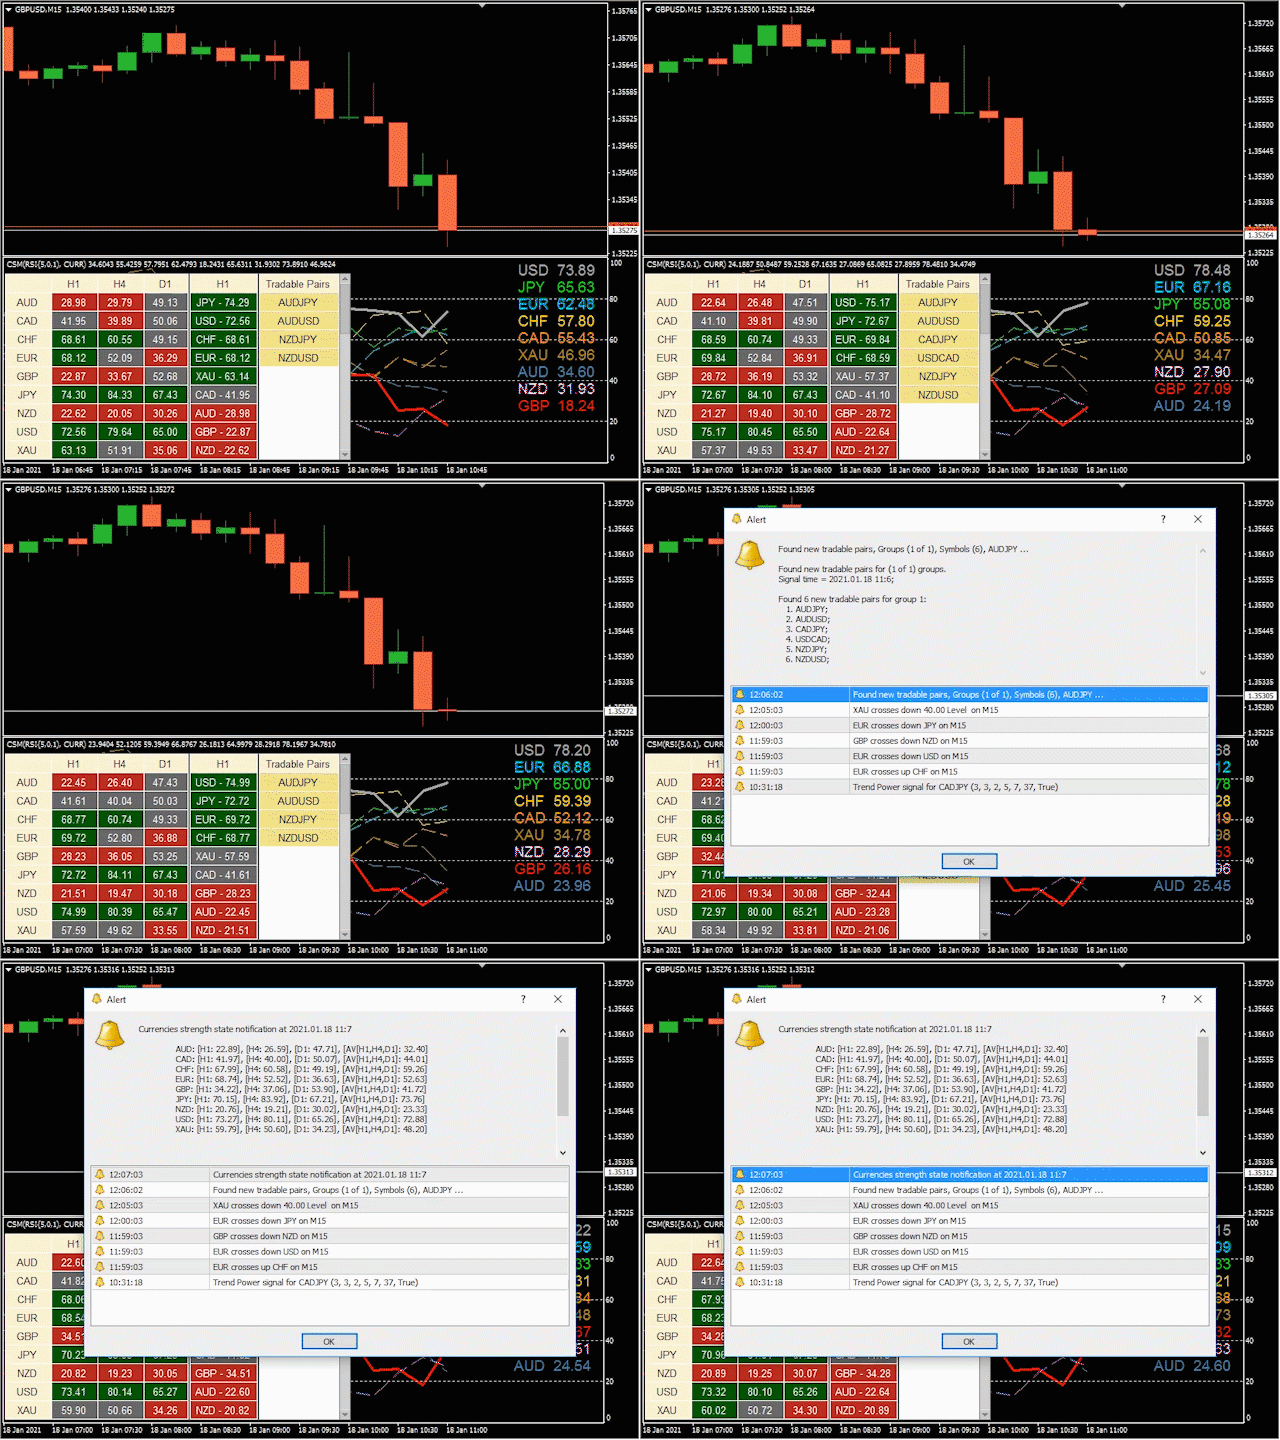
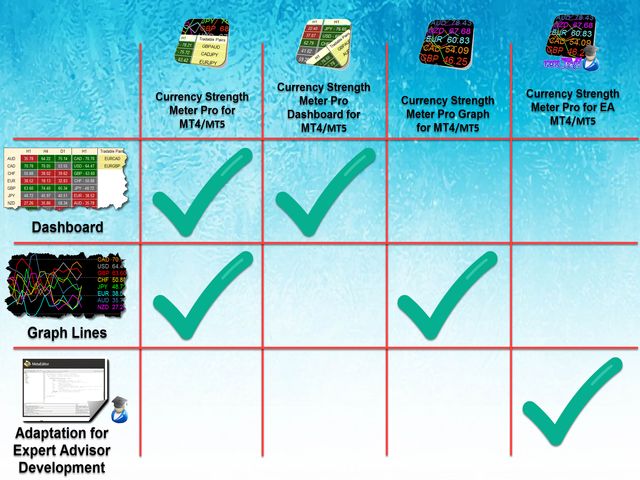
  • Currency Strength Meter Dashboard (shows strength of currencies for any timeframe with sorting by name or value at one user-friendly dashboard);
  • Currency Strength Meter Graph (shows strength of currencies with graphic lines and labels near to lines or at corner of graph);
    • Candle close time graph lines calculation;
    • Time based graph lines calculation;
  • Graph lines styling for chart symbols and other symbols;
  • Allows to calculate average currency strength from specified timeframes;
  • Searching tradable pairs by several algorithms (allows to find strong and weak currencies and show them at table as tradable pairs, you do not waste your time to do this calculation manually);
  • Powerful notification manager:
    • Notifications by crossing level (levels and timeframe is set by formula);
    • Notifications by crossing lines (timeframe is set by formula);
    • Notifications when new tradable pair is found (tradable pairs are found by formula);
    • Notifications about CSM state;
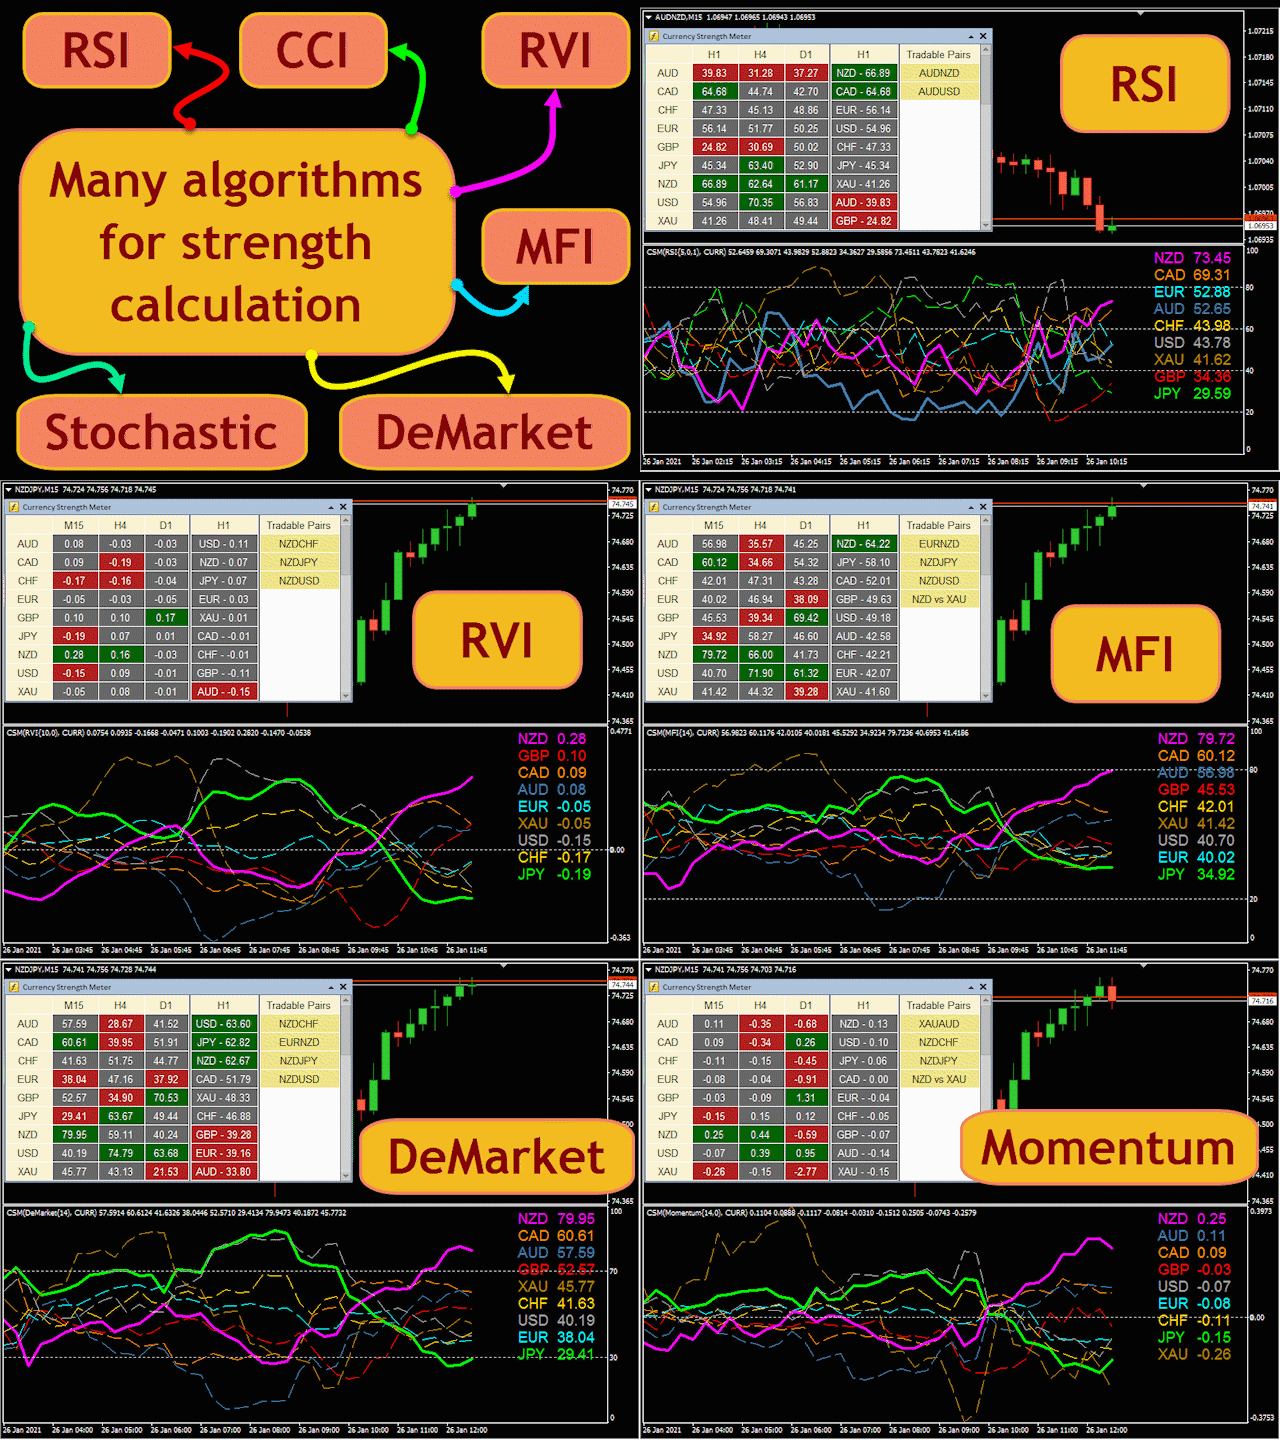
  • Many algorithms for calculation of strength of currencies (MACD, RSI, CCI, RVI, MFI, Stochastic, DeMarker, Momentum);
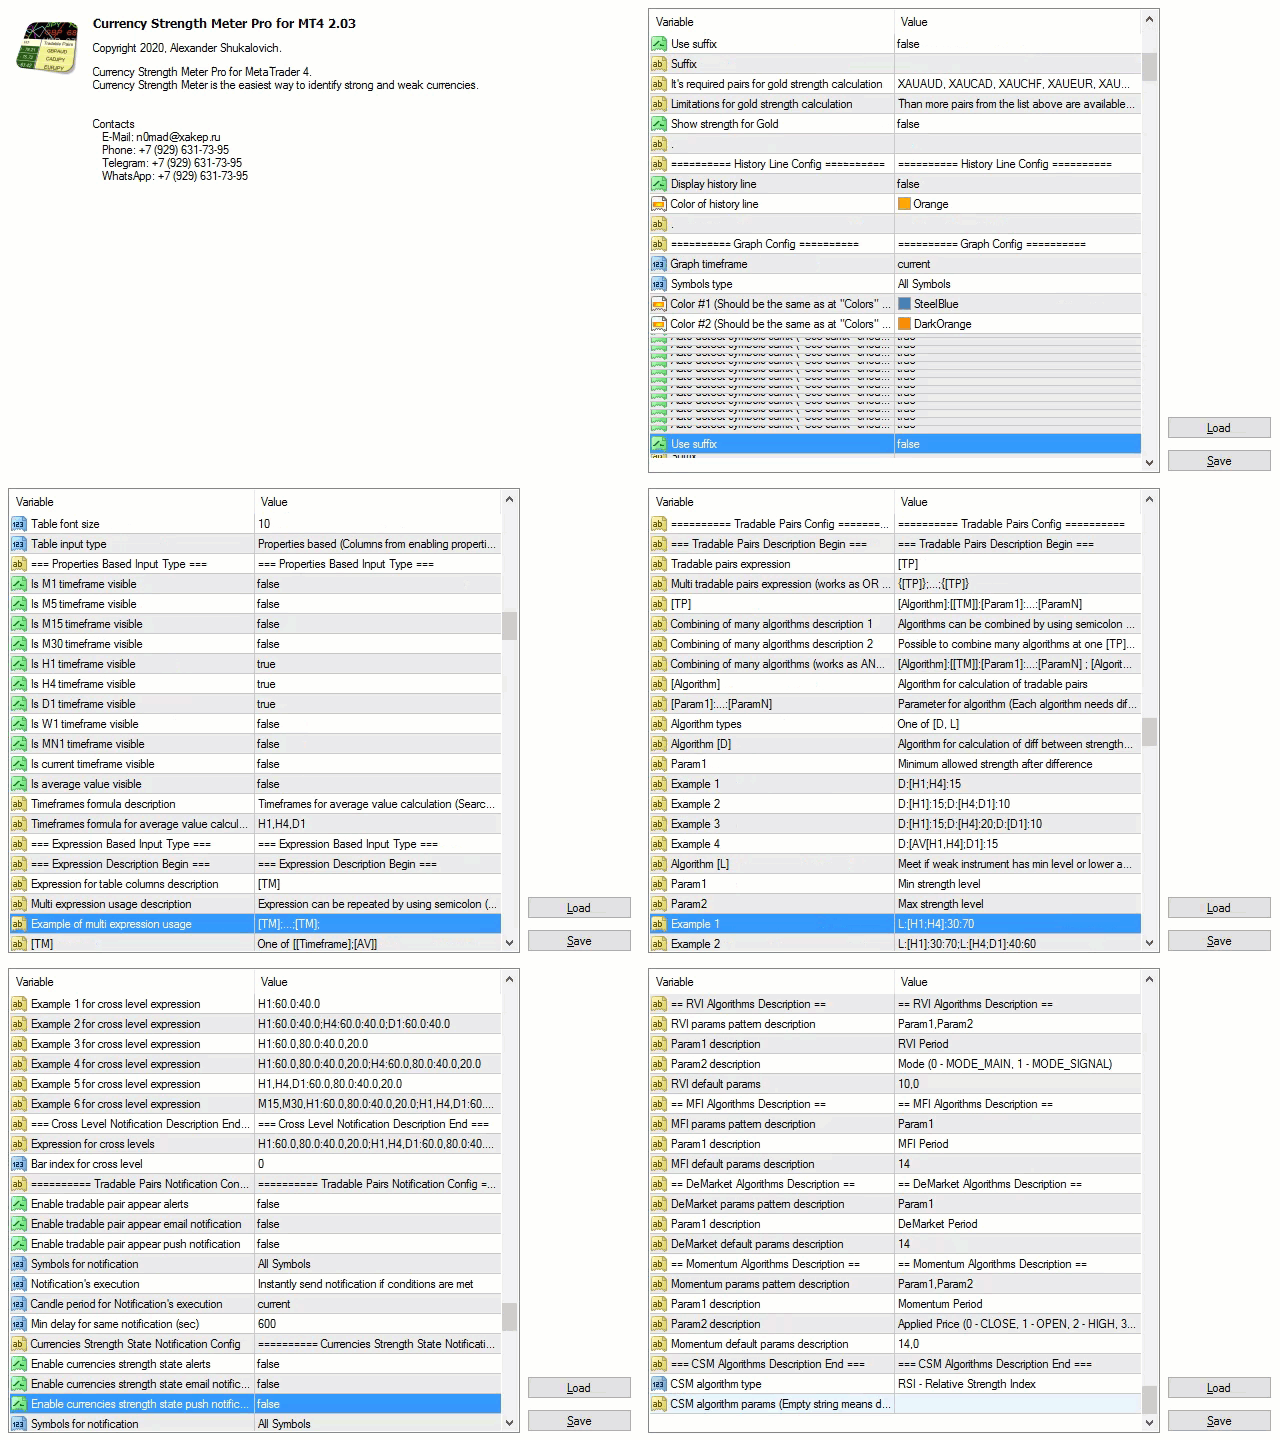
  • Powerful tradable pairs search engine by expression;
    • Min difference between strength of strong and weak currencies;
    • Min strength level for strong currency and weak currency;
    • Max difference between strength of strong and weak currencies;
    • Moving averages alignment;
  • Coloring of any object of Currency Strength Meter;
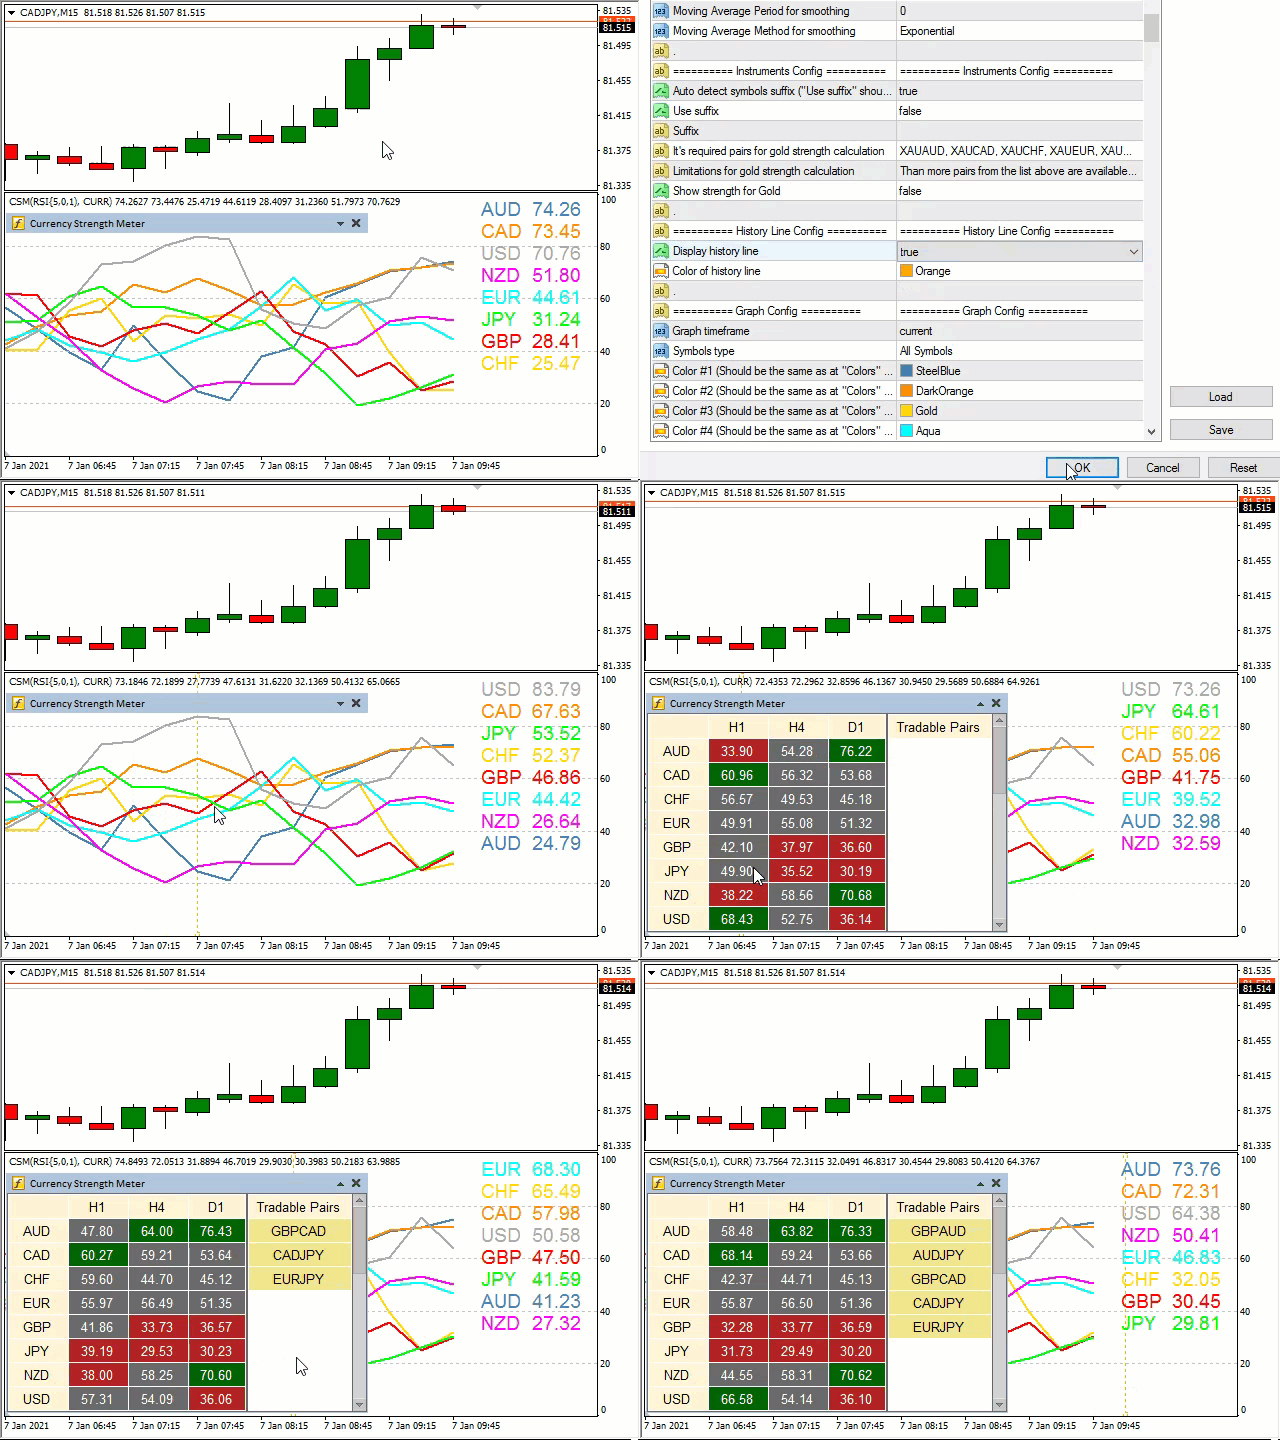
  • History line (allows to get Currency Strength Meter value for particular time in history, it helps to backtest your trading strategy with using Currency Strength Meter);
    • Calculation on candle close time;
    • Calculation on specified time with one minute precision;
  • Moving average smoothing (allowed to smooth result with specific algorithms);
  • Latency (allowed to calculate currency strength with specified interval, thus it takes less time for calculation);
  • Allows to show data only for specified currencies (chart pair, market watch pairs, all currency pairs);
  • User-friendly interface;
  • High resolution screens support (4K);


Relative products:


Communication:

  • Join  Take Profit Channel to get latest news and updates.
  • Join Take Profit Group to discuss products of author.
  • If you want new feature contact me please.


Take profit!

Comentários 10
Ericj1
54
Ericj1 2023.03.08 10:59 
 

Good day, I am renting the indicator and it is a good indicator. I want to use this indicator to trade GOLD and USD. How to remove all the other currecny lines showing the streght and weakness and be left with only GOLD and USD lines that will show strenght and weakness on thi strenght meter

danmar
1810
danmar 2023.03.03 17:53 
 

HI i just discover that my very very recent asking to have 0, 1 or 2 decimals to have more easy to read was already made ! Great Aleksandr because for me it is so much clear ! your curr str is very very interesting, accurate and your reaction so quick Thanks a Lot. i appreciate a lot i use it , i have a lot of "other" currency and this one is very good and so easy to adapt visual and mode of compute well done for a nice price also Warmly ++++

2023 09 25 : this tool is really very accurate and has all the possibility to adapt at all needs (at least mine !) really accurate, quick compute, and Aleksandr answer all my questions quickly even the response is probably evident

i have 2 necessary tools and this one is one of the 2.

thank you a lot, well done, warmly

Bonnysam
34
Bonnysam 2022.08.20 23:42 
 

One of the best indicators i bought. The indicator is amazing and it saves soo much time. but what amazed me mostly is the level of care and help you get along with the indicator. Thank you Aleksander for offering 5 stars customer service. This will def not be the last time I purchase on of his remarkable indicators. I recommend you to get this indicator, YOU WILL NOT REGRET THIS

Produtos recomendados
Currency Strength Meter is the easiest way to identify strong and weak currencies. This indicator shows the relative strength of 8 major currencies + Gold: AUD, CAD, CHF, EUR, GBP, JPY, NZD, USD, XAU. Gold symbol can be changed to other symbols like XAG, XAU etc. By default the strength value is normalised to the range from 0 to 100 for RSI algorithm: The value above 60 means strong currency; The value below 40 means weak currency; This indicator needs the data of all 28 major currency pairs
ProbabilityRiskManagedEA
Pranav Sanghadia
1 (1)
Probability and risk management based trading algorithm EA. This EA works on any timeframe, in fact it does not take the timeframe in account. Please backtest and generate the optimized values for your MT4 broker.  Please use the optimized input parameters only for the given currency pair and don't modify TP or SL once the trade is placed. As per the probability of coin flip the buy and sell orders will be equal in some time, the EA remains profitable because of the optimized parameters. 
FREE
VPO Profile MT4
Kyra Nickaline Watson-gordon
5 (2)
Definition : VPO is a Volume Price Opportunity. Instead of using bars or candles with an Open, High, Low, and Close price, each "bar" in a Market Profile is represented by horizontal bars against the price It is called Market Profile terminology. In other words volume-price-opportunity (VPO) profiles are histograms of how many volumes were traded at each price within the span of the profile. By using a VPO chart, you are able to analyze the amount of trading activity, based on volume, for each
FlySystemEA Pro
Nikolaos Pantzos
3.27 (11)
This Expert Advisor is a pure scalping system. The expert place and manage pending orders. Runs perfect on pairs with tight spread and low commission broker (commission plus spread equal or less than 1.0 pip). Choose a broker with zero stop level and fast execution to use expert. Pairs and Time Frame Pair: eurusd Time frame: M1 Default settings are good for eurusd. Information Please test expert on demo account first, before uses it on real account. Have on your mind, all scalpers are sensiti
FREE
Hello Traders, Introducing a powerful indicator designed to enhance your buy/sell decisions by combining 15 different indicators into one. This unique combination helps minimize false entries, providing you with a more reliable trading strategy. The indicator is easy to use: an upward arrow signals a buy opportunity, while a downward arrow suggests a sell. The indicator is highly versatile and can be applied to any currency pair and any timeframe. However, for optimal performance, I recommend us
VR Grid
Vladimir Pastushak
5 (3)
O indicador VR Grid foi projetado para criar uma grade gráfica com configurações definidas pelo usuário. Ao contrário da grade padrão , a VR Grid é usada para construir níveis circulares . Dependendo da escolha do usuário, o passo entre os níveis de rodada pode ser arbitrário. Além disso, ao contrário de outros indicadores e utilitários, o VR Grid mantém a posição da rede mesmo quando o período de tempo muda ou o terminal é reiniciado. Configurações, arquivos de configuração, versões demo, instr
FREE
Simply The Best Pro
Szymon Palczynski
5 (1)
This indicator displays the histogram and arrows on chart. When Simple The Best Pro are placed on a chart, they identify the trend.  The color of may be blue or red. The blue color stands for upside moves and the red color stands for downside trends. The indicator offers to set Stop Loss (SL) and  Take Profit (TP)  setting. The default value is ATR. Indicator has automatic optimization. The STB is a unique indicator that shows the tendency (button Bars) of a particular signals. The STB tells us
Currency Heat Wave Ultimate
Thushara Dissanayake
5 (1)
O indicador técnico   Currency Heat Wave Ultimate   é uma ferramenta valiosa que fornece aos traders informações em tempo real sobre a força das principais moedas. Com sua análise de 28 pares de moedas, ele oferece uma visão abrangente da força da moeda diretamente no gráfico, tornando-o incrivelmente conveniente de usar. Ao alterar as cores dinamicamente, permite que os comerciantes identifiquem rapidamente as posições das moedas e tomem decisões informadas. Uma das características notáveis do
SX Currency Strength indicator allows users to analyze currency strength through a selected period, with results resetting periodically and accumulating thereafter. It displays the historical relative strength of eight major currencies (USD, EUR, GBP, JPY, AUD, CHF, CAD and NZD) across a selected timeframe. Assessing a currency's relative strength aids in evaluating its performance against a basket of other currencies. Users can select to visualize relative strength of the currencies in the shap
PipFinite Razor Scalper
Karlo Wilson Vendiola
4.4 (47)
Pipfinite creates unique, high quality and affordable trading tools. Our tools may or may not work for you, so we strongly suggest to try the Demo Version for MT4 first. Please test the indicator prior to purchasing to determine if it works for you. We want your good reviews, so hurry up and test it for free...we hope you will find it useful. Combo Razor Scalper with Trend Laser Strategy: Scalp in the direction of the trend Watch Video: (Click Here) Features Scalping indicator using a confirme
O indicador cria cotações atuais, que podem ser comparadas com as históricas e, com base nisso, fazer uma previsão do movimento dos preços. O indicador possui um campo de texto para navegação rápida até a data desejada. Opções: Símbolo - seleção do símbolo que o indicador exibirá; SymbolPeriod - seleção do período do qual o indicador coletará dados; IndicatorColor - cor do indicador; HorisontalShift - deslocamento das cotações desenhadas pelo indicador pelo número especificado de barras; I
Este indicador é projetado para determinar o horário da maior atividade de negociação em um dia. Após esse cálculo, o indicador constrói os níveis de negociação mais significativos. A comparação desses níveis com a ação real do preço pode fornecer informações sobre a força e a direção das tendências do mercado. Características do indicador O prazo deve ser inferior a D1. Prazos recomendados: M15, M30 e H1. Os prazos acima de H1 podem fornecer uma imagem muito aproximada. E o uso de timeframes
Layer Master Toolbox
Peter Andrew Thomas
5 (5)
Layer Master: Professional Grid Trading Tool for MT4 Transform your grid trading with Layer Master - the most intuitive and powerful order management toolkit designed specifically for professional traders. MT5   Version:  https://www.mql5.com/en/market/product/129705 Master Grid Trading with Precision Layer Master revolutionizes how you place and manage grid trades. With our visual interface, you can: Deploy hundreds of orders instantly Manage multiple positions effortlessly Control risk with
The Signal Strength Meter is a Multi-Currency, Dual Timeframe Interactive Indicator, which calculates the strength of buy and sell signals, and displays a score for each symbol on a display board. Get a 7-Day Free Trial Version:  Click  Here  (Full Access to The Indicator for 7 Days) Check Video Below For Complete Demonstration, and User Manual here . Key Features: Allows you to see multiple currency signals from one chart Analyses the signals from more than a dozen classic indicators Identif
RiverScope Lite automatically determines the nearest most important price levels and support and resistance zones in history, it also identifies a large number of price action patterns (the lite version is limited to 10, while the full version has 30+). The support and resistance levels are determined based on an algorithm that calculates and filters the historical values of the price, its movement character, volumes, etc. It displays the current situation, therefore the nearest levels change in
Stratos Pali
Michela Russo
5 (2)
Stratos Pali Indicator   is a revolutionary tool designed to enhance your trading strategy by accurately identifying market trends. This sophisticated indicator uses a unique algorithm to generate a complete histogram, which records when the trend is Long or Short. When a trend reversal occurs, an arrow appears, indicating the new direction of the trend. Important Information Revealed Leave a review and contact me via mql5 message to receive My Top 5 set files for Stratos Pali at no cost! Dow
Tick Speed Pro
John Louis Fernando Diamante
Tick Speed Pro povides a charted record of tick speed to allow you to see the ebb and flow of market activity. Observing patterns in tick speed may allow you to better time entries to reduce slippage and re-quotes. The tick speed plot updates it's entire position to show you only the last N seconds you choose, ideal for scalping and HFT approaches. An alert is provided to signal when the instrument is getting ticks at a higher rate than the alert limit. Multiple loadings are supported to compare
I’m excited to introduce the RSI Indicator, designed for multi-time frame monitoring! This powerful tool allows you to track Overbought and Oversold conditions in real-time, all on a single screen. My hope is that this indicator will assist you in your analysis and help you seize trading opportunities with your own trading system. If you find this indicator valuable, I’d greatly appreciate your support by liking my channel and giving it a 5-star rating! Your feedback motivates me to continue im
FREE
FX Strength Meter Pro é um indicador poderoso projetado para traders que buscam oportunidades ótimas de negociação no mercado forex. Nosso indicador exibe em tempo real a força relativa dos principais pares de moedas (USD, EUR, GBP, CHF, AUD, NZD, JPY, CAD), ajudando você a identificar rapidamente as moedas mais fortes e mais fracas para aprimorar sua estratégia de negociação. Principais características incluem: - Suporte multi-timeframe: De gráficos de minutos a mensais (M1, M5, M15, M30, H1
IceFX VelocityMeter Mini is a very unique indicator on MetaTrader 4 platform which measures the speed of the Forex market . It is not a normal volume or other measurement indicator because IceFX VelocityMeter Mini is capable to understand market speed movements which are hidden in ticks and those valuable information cannot be read in an ordinary way from the candles. The software monitors the received ticks (frequency, magnitude of change) within a specified time range, analyzes these info and
This multicurrency indicator is the Lite version of the Cosmic Diviner Reversal Zone Pro indicator. The indicator is based on original formulas for analyzing the volatility and price movement strength. This allows determining the overbought and oversold states of instruments with great flexibility, as well as setting custom levels for opening buy or sell orders when the overbought or oversold values of the instruments reach a user-defined percentage. A huge advantage of Reversal Zone Lite is the
Currency Strength Meter is the easiest way to identify strong and weak currencies. The indicator shows the relative strength of 8 major currencies: AUD, CAD, CHF, EUR, GBP, JPY, NZD, USD. By default the strength value is normalised to the range from 0 to 100 for RSI algorithm: The value above 60 means strong currency; The value below 40 means weak currency; The indicator is created and optimized for using it externally at an Expert Advisors or as a Custom Indicator inside your programs. For d
This is a multi timeframe version of the  Supply and Demand indicator . It allows you to analyze a chart using the law of supply and demand on three different timeframes at a time. You will see zones of sales and purchases and determine the most profitable points to open positions. The indicator is based on the principle of market fractality. Supply and demand zones show places where a strong buyer or seller has made the price reverse and change its direction. The indicator has several types of
PipFinite Energy Beam
Karlo Wilson Vendiola
3.94 (17)
Pipfinite creates unique, high quality and affordable trading tools. Our tools may or may not work for you, so we strongly suggest to try the Demo Version for MT4 first. Please test the indicator prior to purchasing to determine if it works for you. We want your good reviews, so hurry up and test it for free...we hope you will find it useful. Combo Energy Beam with Swing Control Strategy: Confirm swing pullback signals Watch Video: (Click Here) Energy Beam with Trend Laser Strategy: Confirm Tre
Blahtech Market Profile
Blahtech Limited
4.53 (15)
Was: $249  Now: $149   Market Profile defines a number of day types that can help the trader to determine market behaviour. A key feature is the Value Area, representing the range of price action where 70% of trading took place. Understanding the Value Area can give traders valuable insight into market direction and establish the higher odds trade. It is an excellent addition to any system you may be using. Blahtech Limited presents their Market Profile indicator for the MetaTrader community. In
MarketProfile EForex
Veridiana Adorno Kendrick
O Perfil de Mercado Mostra onde o preço passou mais tempo, destacando níveis importantes que podem ser usados na negociação. É uma ferramenta poderosa que se destina a reunir os componentes fundamentais que compõem cada mercado; preço / volume / tempo, e exibir visualmente sua relação em tempo real à medida que o mercado se desenvolve por um período de tempo pré-determinado. Ferramenta muito poderosa!
MACDAD
Stanislav Korotky
This indicator provides you with MACD formula applied to volume-aware Accumulation/Distribution and OnBalance Volumes indicators. In addition to tick volumes it supports special pseudo-real volumes, synthesized for Forex symbols where real volumes are unknown. More details on the volume surrogates may be found in description of another indicators - TrueVolumeSurrogate and OnBalanceVolumeSurrogate (algorithm of the latter is used internally in MACDAD for AD and OBV calculation before they proceed
The RSI Panel MTF indicator has been created in order to have the ability to monitor the values of the standard RSI indicator from a multitude of timeframes and symbols on a single chart, as well as to receive timely notifications about the trading opportunities using an audio signal or a notification. The indicator can output both the indicator values, and only the indicator signals (confirmed and expected). A user-friendly feature for selecting the required symbol has been implemented - simply
Blahtech Supply Demand
Blahtech Limited
4.58 (36)
Was: $299  Now: $149   Supply Demand uses previous price action to identify potential imbalances between buyers and sellers. The key is to identify the better odds zones, not just the untouched ones. Blahtech Supply Demand indicator delivers functionality previously unavailable on any trading platform. This 4-in-1 indicator not only highlights the higher probability zones using a multi-criteria strength engine, but also combines it with multi-timeframe trend analysis, previously confirmed swings
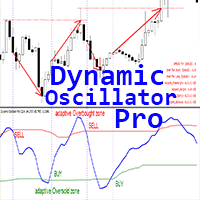
Dynamic Oscillator Pro - é um indicador Crypto_Forex personalizado avançado - ferramenta de negociação eficiente para MT4! - Nova geração de osciladores - veja as fotos para verificar como utilizá-los. - O oscilador dinâmico possui zonas de sobrevenda/sobrecompra adaptáveis. - O oscilador é uma ferramenta auxiliar para encontrar pontos de entrada exatos em áreas de sobrevenda/sobrecompra. - Valores de sobrevenda: abaixo da linha verde, Valores de sobrecompra: acima da linha vermelha. - É muito
Os compradores deste produto também adquirem
Actualmente 20% OFF ! A melhor solução para qualquer novato ou comerciante especializado! Este software de painel de instrumentos está a funcionar em 28 pares de moedas. É baseado em 2 dos nossos principais indicadores (Advanced Currency Strength 28 e Advanced Currency Impulse). Dá uma grande visão geral de todo o mercado Forex. Mostra valores avançados de força da moeda, velocidade de movimento da moeda e sinais para 28 pares de divisas em todos os (9) períodos de tempo. Imagine como a sua n
Scalper Inside PRO
Alexey Minkov
4.76 (63)
!SPECIAL SALE! An exclusive indicator that utilizes an innovative algorithm to swiftly and accurately determine the market trend. The indicator automatically calculates opening, closing, and profit levels, providing detailed trading statistics. With these features, you can choose the most appropriate trading instrument for the current market conditions. Additionally, you can easily integrate your own arrow indicators into Scalper Inside Pro to quickly evaluate their statistics and profitability
Dynamic Forex28 Navigator
Bernhard Schweigert
5 (5)
Dynamic Forex28 Navigator - A ferramenta de negociação Forex de última geração. ATUALMENTE 49% DE DESCONTO. Dynamic Forex28 Navigator é a evolução dos nossos indicadores populares de longa data, combinando o poder de três em um: Indicador Advanced Currency Strength28 (695 avaliações) + Advanced Currency IMPULSE com ALERTA (520 avaliações) + Sinais CS28 Combo (Bônus). Detalhes sobre o indicador https://www.mql5.com/en/blogs/post/758844 O que o Next-Generation Strength Indicator oferece?  Tudo
Grabber System MT4
Ihor Otkydach
5 (1)
Apresento a você um excelente indicador técnico: Grabber, que funciona como uma estratégia de trading “tudo incluído”, pronta para usar. Em um único código estão integradas ferramentas poderosas de análise técnica de mercado, sinais de entrada (setas), funções de alertas e notificações push. Cada comprador deste indicador também recebe gratuitamente: Utilitário Grabber: ferramenta para gerenciamento automático de ordens abertas Vídeo tutorial passo a passo: como instalar, configurar e operar com
Algo Pumping MT4
Ihor Otkydach
5 (4)
PUMPING STATION – Sua estratégia pessoal “tudo incluído” Apresentamos o PUMPING STATION — um indicador revolucionário para Forex que vai transformar sua maneira de operar em uma experiência empolgante e eficaz. Este não é apenas um assistente, mas sim um sistema de trading completo com algoritmos poderosos que vão te ajudar a operar de forma mais estável. Ao adquirir este produto, você recebe GRATUITAMENTE: Arquivos de configuração exclusivos: para uma configuração automática e desempenho máximo
Easy Breakout
Mohamed Hassan
5 (10)
After your purchase, feel free to contact me for more details on how to receive a bonus indicator called VFI, which pairs perfectly with Easy Breakout for enhanced confluence!   Easy Breakout is a powerful price action trading system built on one of the most popular and widely trusted strategies among traders: the Breakout strategy ! This indicator delivers crystal-clear Buy and Sell signals based on breakouts from key support and resistance zones. Unlike typical breakout indicators, it levera
Enigmera
Ivan Stefanov
5 (7)
ENIGMERA: O núcleo do mercado Importante: A demonstração do MQL5.com funciona no Strategy Tester e pode não refletir completamente a funcionalidade do Enigmera. Verifique a descrição, as capturas de tela e o vídeo para mais detalhes. Fique à vontade para me enviar uma mensagem com qualquer dúvida! O código do indicador foi completamente reescrito. A versão 3.0 adiciona novas funcionalidades e corrige erros acumulados desde o início do indicador. Introdução Este indicador e sistema de negociação
Golden Trend Indicator
Noha Mohamed Fathy Younes Badr
4.9 (10)
Golden Trend indicator  is The best indicator for predicting trend movement this indicator never lags and never repaints and never back paints    and give  arrow buy and sell    before the candle appear  and it will help you and  will make your trading decisions clearer its work on all currencies and  gold and crypto and all time frame This unique  indicator uses very secret algorithms to catch the  trends, so you can trade using this indicator and see the trend clear on charts  manual guide and
TPSproTREND PrO
Roman Podpora
4.68 (25)
VERSION MT5        —        ИНСТРУКЦИЯ RUS           —        INSTRUCTIONS  ENG Principais funções: Sinais de entrada precisos SEM RENDERIZAÇÃO! Se aparecer um sinal, ele permanece relevante! Esta é uma diferença importante em relação aos indicadores de redesenho, que podem fornecer um sinal e depois alterá-lo, o que pode levar à perda de fundos depositados. Agora você pode entrar no mercado com maior probabilidade e precisão. Também existe a função de colorir as velas após o aparecimento da se
Lux Trend
Mohamed Hassan
5 (3)
After purchase, please contact me to get your trading tips + more information for a great bonus!   Lux Trend is a professional strategy based on using Higher Highs and Lower Highs to identify and draw Trendline Breakouts! Lux Trend  utilizes two Moving Averages to confirm the overall trend direction before scanning the market for high-quality breakout opportunities, ensuring more accurate and reliable trade signals. This is a proven trading system used by real traders worldwide, demonstrating
Volatility Trend System - um sistema de negociação que dá sinais para entradas. O sistema de volatilidade fornece sinais lineares e pontuais na direção da tendência, bem como sinais para sair dela, sem redesenho e atrasos. O indicador de tendência monitora a direção da tendência de médio prazo, mostra a direção e sua mudança. O indicador de sinal é baseado em mudanças na volatilidade e mostra entradas no mercado. O indicador está equipado com vários tipos de alertas. Pode ser aplicado a vários i
Gold Venamax MT4
Sergei Linskii
2 (1)
Gold Venamax   - este é o melhor indicador técnico de ações. O algoritmo do indicador analisa o movimento do preço de um ativo e reflete a volatilidade e as zonas de entrada potenciais. Recursos do indicador: Este é um super indicador com Magic e dois blocos de setas de tendência para uma negociação confortável e lucrativa. O botão vermelho para alternar blocos é exibido no gráfico. Magic é definido nas configurações do indicador, para que você possa instalar o indicador em dois gráficos exibin
GOLD Impulse with Alert
Bernhard Schweigert
4.6 (10)
Este indicador é uma super combinação dos nossos 2 produtos Advanced Currency IMPULSE with ALERT  +   Currency Strength Exotics . Funciona para todos os períodos de tempo e mostra graficamente impulso de força ou fraqueza para as 8 principais moedas mais um Símbolo! Este Indicador é especializado para mostrar a aceleração da força da moeda para quaisquer símbolos como Ouro, Pares Exóticos, Commodities, Índices ou Futuros. É o primeiro do seu género, qualquer símbolo pode ser adicionado à 9ª
FX Volume
Daniel Stein
4.6 (35)
FX Volume: Vivencie o Verdadeiro Sentimento de Mercado sob a Perspectiva de um Corretor Visão Geral Rápida Quer aprimorar sua abordagem de trading? FX Volume fornece insights em tempo real sobre como traders de varejo e corretores estão posicionados—bem antes de relatórios atrasados como o COT. Seja para buscar ganhos consistentes ou simplesmente ter uma vantagem mais clara no mercado, FX Volume ajuda você a detectar grandes desequilíbrios, confirmar rompimentos e aperfeiçoar sua gestão de ris
[ MT5 Version ]  [ Kill Zones ]  [ SMT Divergences ] How to trade using Order Blocks:  Click here User Interface Performance:  During testing in the strategy tester, the UI may experience lag. Rest assured, this issue is specific to the testing environment and does not affect the indicator's performance in live trading. Elevate your trading strategy with the  Order Blocks ICT Multi TF  indicator, a cutting-edge tool designed to enhance your trading decisions through advanced order block analys
Tendência do ouro   - este é um bom indicador técnico de acções. O algoritmo do indicador analisa o movimento do preço de um ativo e reflecte a volatilidade e as potenciais zonas de entrada. Os melhores sinais do indicador: - Para VENDER = histograma vermelho + ponteiro SHORT vermelho + seta de sinal amarelo na mesma direção. - Para COMPRAR = histograma azul + ponteiro LONGO azul + seta de sinal aqua na mesma direção. Vantagens do indicador: 1. O indicador produz sinais com elevada precis
O Wave Synchronizer é um indicador visual de análise de ondas. Combina sequências de movimentos de velas e cria ondas direcionais, produzindo movimentos sincronizados juntamente com o mercado. O início de cada onda começa com uma seta de sinalização, existindo também alertas. O indicador nunca redesenhará ou moverá as setas no histórico anterior. Aparecem setas de sinal no fecho da vela. Adapta-se para trabalhar com quaisquer instrumentos de negociação e prazos. Fácil de utilizar e configurar,
Uma implementação pessoal de blocos de pedidos, uma estratégia de negociação de posição simples, mas eficaz. O negociador deve entrar no mercado ou procurar negociações na direção do último bloco de ordem, se a faixa de preço não foi violada na direção oposta ao rompimento. Blocos abertos não são desenhados para maior clareza. [ Guia de instalação | Guia de atualização | Solução de problemas | FAQ | Todos os produtos ] Um bloco aberto de alta é a primeira barra de alta após uma nova baixa do me
ACTUALMENTE 31% DE DESCONTO!! A melhor solução para qualquer novato ou comerciante especializado! Este indicador é uma ferramenta comercial única, de alta qualidade e acessível, porque incorporámos uma série de características proprietárias e uma fórmula secreta. Com apenas UM gráfico, dá alertas para todos os 28 pares de moedas. Imagine como a sua negociação irá melhorar porque é capaz de identificar o ponto exacto de desencadeamento de uma nova tendência ou oportunidade de escalada! Constr
KT Asian Breakout Indicator
KEENBASE SOFTWARE SOLUTIONS
O indicador KT Asian Breakout analisa uma parte crítica da sessão asiática para gerar sinais de compra e venda em ambas as direções, com base na quebra de preço. Um sinal de compra ocorre quando o preço rompe acima da máxima da sessão, enquanto um sinal de venda ocorre quando o preço rompe abaixo da mínima da sessão. Coisas para lembrar Se a caixa da sessão for muito ampla verticalmente, deve-se evitar uma nova negociação, pois a maior parte da ação do preço já ocorreu dentro da sessão. Se a ve
TPSpro RFI Levels
Roman Podpora
4.85 (27)
O indicador que redefiniu a negociação, tornou-se referência para análise de gráficos e estabeleceu novos padrões em negociação. Zonas de reversão /   Zonas de pico de volume   /   Zonas ativas de um grande player     INSTRUÇÕES RUS         INSTRUÇÕES   ENG   /   Recomendamos usar com o indicador -   TPSpro TREND PRO Cada comprador deste indicador recebe adicionalmente GRATUITAMENTE: 6 meses de acesso aos sinais de negociação do serviço RFI SIGNALS - pontos de entrada prontos de acordo c
CONTACT US  after purchase to get the Indicator Manual. Download Now!  Offer valid only for next 10 Buyers.  Price   will   increase  gradually !  Download the  Metatrader 5 Version Read the product description carefully before purchasing the product.  Due to regulatory restrictions, our service is unavailable in certain countries such as India, Pakistan, and Bangladesh. Disclaimer: • Our products are available only on mql5.com. • We never contact anyone or sell our products privately. • We d
Advanced Supply Demand
Bernhard Schweigert
4.91 (294)
Atualmente com 33% de desconto! A melhor solução para qualquer Trader Novato ou especialista! Este indicador é uma ferramenta de negociação exclusiva, de alta qualidade e acessível porque incorporamos uma série de recursos proprietários e uma nova fórmula. Com esta atualização, você poderá mostrar fusos horários duplos. Você não só será capaz de mostrar um TF mais alto, mas também mostrar ambos, o TF do gráfico, MAIS o TF mais alto: MOSTRANDO ZONAS ANINHADAS. Todos os traders de Oferta e Demanda
With this system you can spot high-probability trades in direction of strong trends. You can profit from stop hunt moves initiated by the smart money! Important Information How you can maximize the potential of the scanner, please read here: www.mql5.com/en/blogs/post/718109 Please read also the blog about the usage of the indicator: Professional Trading With Strong Momentum. With this system you have 3 reliable edges on your side: A strong trend (=high probability of continuation) A deep pull
Bomb Signal
Aleksandr Makarov
Bomb Signal : 100% does not repaint Bonus: when you buy an indicator, you get any indicator for free (optional) . (Write in a private message or in telegram in your profile to receive a bonus) Bomb Signal is a powerful indicator for MetaTrader 4 designed to identify the most relevant trends in the financial market. If you are looking for a tool that accurately predicts movements, Bomb Signal is your ally. How does this work: This indicator combines three different methods – volume analysis, can
NAM Order Blocks
NAM TECH GROUP, CORP.
3 (2)
Indicador de detecção de blocos de pedidos de multi-timeframe MT4. Características - Totalmente personalizável no painel de controle do gráfico, fornece interação completa. - Oculte e mostre o painel de controle onde quiser. - Detectar OBs em vários períodos de tempo. - Selecione a quantidade de OBs para exibir. - Interface de usuário de OBs diferente. - Filtros diferentes em OBs. - Alerta de proximidade OB. - Linhas ADR de alta e baixa. - Serviço de notificação (alertas de tela | not
ACTUALMENTE COM 26% DE DESCONTO A melhor solução para qualquer novato ou comerciante especializado! Este Indicador é uma ferramenta comercial única, de alta qualidade e acessível, porque incorporámos uma série de características proprietárias e uma nova fórmula. Com apenas UM gráfico, pode ler a força da moeda para 28 pares de Forex! Imagine como a sua negociação irá melhorar porque é capaz de apontar o ponto exacto do gatilho de uma nova tendência ou oportunidade de escalada? Manual do util
Currency Strength Exotics
Bernhard Schweigert
4.87 (31)
ACTUALMENTE 20% DE DESCONTO ! A melhor solução para qualquer novato ou comerciante especializado! Este Indicador é especializado para mostrar a força da moeda para quaisquer símbolos como Pares Exóticos de Commodities, Índices ou Futuros. É o primeiro do seu género, qualquer símbolo pode ser adicionado à 9ª linha para mostrar a verdadeira força da moeda de Ouro, Prata, Petróleo, DAX, US30, MXN, TRY, CNH etc. Esta é uma ferramenta de negociação única, de alta qualidade e acessível, porque inco
O Indicador de Níveis de Negociação é um sistema de negociação concebido para determinar pontos de entrada, manter posições e direção de tendência. Inclui vários mecanismos a trabalhar num complexo, análise de onda da direção da tendência, análise de nível na construção de sinais, mostra possíveis alvos TP e SL. Capacidades de indicadores As setas de sinal aparecem na vela atual e não são recoloridas. Utiliza algoritmos especiais para procurar níveis a partir dos quais o preço salta. Funciona
Master Pullback
TDINVEST LLP
5 (3)
- 50% OFF - Telegram group : https://t.me/+5RIceImV_OJmNDA0 MT5 version : https://www.mql5.com/en/market/product/85917?source=Site+Market+Product+Page Master Pullback is a complete system that gives unique trading opportunities and a clear indication of the market: trend, signals as well as stop loss and take profit levels. This system has been designed to be as simple as possible and detects extreme overbought and oversold zones, support and resistance levels, as well as the major trend. You p
Mais do autor
Currency Strength Meter is the easiest way to identify strong and weak currencies. This indicator shows the relative strength of 8 major currencies + Gold: AUD, CAD, CHF, EUR, GBP, JPY, NZD, USD, XAU. Gold symbol can be changed to other symbols like XAG, XAU etc. By default the strength value is normalised to the range from 0 to 100 for RSI algorithm: The value above 60 means strong currency; The value below 40 means weak currency; This indicator needs the history data of all 28 major currency
Currency Strength Meter is the easiest way to identify strong and weak currencies. This indicator shows the relative strength of 8 major currencies + Gold: AUD, CAD, CHF, EUR, GBP, JPY, NZD, USD, XAU. Gold symbol can be changed to other symbols like XAG, XAU etc. By default the strength value is normalised to the range from 0 to 100 for RSI algorithm: The value above 60 means strong currency; The value below 40 means weak currency; This indicator needs the data of all 28 major currency pairs
Currency Strength Meter is the easiest way to identify strong and weak currencies. This indicator shows the relative strength of 8 major currencies + Gold: AUD, CAD, CHF, EUR, GBP, JPY, NZD, USD, XAU. Gold symbol can be changed to other symbols like XAG, XAU etc. By default the strength value is normalised to the range from 0 to 100 for RSI algorithm: The value above 60 means strong currency; The value below 40 means weak currency; This indicator needs the history data of all 28 major currenc
Currency Strength Meter is the easiest way to identify strong and weak currencies. This indicator shows the relative strength of 8 major currencies + Gold: AUD, CAD, CHF, EUR, GBP, JPY, NZD, USD, XAU. Gold symbol can be changed to other symbols like XAG, XAU etc. By default the strength value is normalised to the range from 0 to 100 for RSI algorithm: The value above 60 means strong currency; The value below 40 means weak currency; This indicator needs the data of all 28 major currency pairs
Chart State Saver for MT5 is utility which helps to save states of all your charts even if they will be closed. And then all saved charts' states can be easily loaded back to charts. It stores templates for each particular currency pair and automatically applies them to charts once they will be opened at next time. Also they can be applied to the charts by your own needs. Thus you can close any chart at your MT5 without scaring to lose chart's data like drawls, messages, chart styling and so on
News Scalping Executor is an advisor which helps to trade news with high impact and huge volatility. This advisor helps to create two opposite orders with risk management. It moves automatically stop loss level to avoid losses as much as possible by using many different algorithms. It helps to avoid trading the news if spread suddenly becomes very huge. To be profitable with this type of trading you should choose the most volatile types of news such as: GDP, CPI, Unemployment Claims, Interest
News Scalping Executor Pro is an advisor which helps to trade news with high impact and huge volatility. This advisor helps to create two opposite orders with risk management and profit protection. It moves automatically stop loss level to avoid losses as much as possible by using many different algorithms. It helps to avoid trading the news if spread suddenly becomes very huge. It can lock profit by moving stop loss or partially closing of orders. To be profitable with this type of trading y
Currency Strength Meter is the easiest way to identify strong and weak currencies. The indicator shows the relative strength of 8 major currencies: AUD, CAD, CHF, EUR, GBP, JPY, NZD, USD. By default the strength value is normalised to the range from 0 to 100 for RSI algorithm: The value above 60 means strong currency; The value below 40 means weak currency; The indicator is created and optimized for using it externally at an Expert Advisors or as a Custom Indicator inside your programs. For d
Trend Power for MT4
ALEKSANDR SHUKALOVICH
4.67 (3)
Trend Power Indicator is an indicator which helps to identify trend direction and its power by using moving averages ZigZag pattern and correlations of tradable instruments. It provides trend power data with user-friendly interface which can be read easily and fast.   This indicator by default is configured for trading of   Adam Khoo's   ( Piranhaprofit ) strategies. It saves mass of time for searching of tradable pairs by his strategies. It indicates when all required moving averages are align
Chart State Saver for MT4 is utility which helps to save states of all your charts even if they will be closed. And then all saved charts' states can be easily loaded back to charts. It stores templates for each particular currency pair and automatically applies them to charts once they will be opened at next time. Also they can be applied to the charts by your own needs. Thus you can close any chart at your MT4 without scaring to lose chart's data like drawls, messages, chart styling and so o
The MA Bounce Strategy is a strategy that seeks to long FX pairs on a strong uptrend as they bounce off their MA support and shorting FX pairs on a strong downtrend as they bounce off MA resistance. The best suitable periods of moving averages for that strategy are 18, 30, 50. This indicator helps to identify and find place for potential market entry by MA bounce strategy. Read   More information about  MA Bounce Strategy . By default MA Bounce Strategy indicator is configured for trading of M1
News Scalping Executor is an utility which helps to trade high impact and huge volatility   news . This utility helps to create two opposite orders with risk management and profit protection. It moves automatically stop loss level to avoid losses as much as possible by using many different algorithms. It helps to avoid trading the news if spread suddenly becomes very huge. It can lock profit by moving stop loss or partially closing of orders. To be profitable with this type of trading you sho
News Scalping Executor Pro is an utility which helps to trade high impact and huge volatility   news . This utility helps to create two opposite orders with risk management and profit protection. It moves automatically stop loss level to avoid losses as much as possible by using many different algorithms. It helps to avoid trading the news if spread suddenly becomes very huge. It can lock profit by moving stop loss or partially closing of orders. To be profitable with this type of trading you
Currency Strength Meter is the easiest way to identify strong and weak currencies. This indicator shows the relative strength of 8 major currencies + Gold: AUD, CAD, CHF, EUR, GBP, JPY, NZD, USD, XAU. Gold symbol can be changed to other symbols like XAG, XAU etc. By default the strength value is normalised to the range from 0 to 100 for RSI algorithm: The value above 60 means strong currency; The value below 40 means weak currency; This indicator needs the history data of all 28 major currenc
Currency Strength Meter is the easiest way to identify strong and weak currencies.   The   indicator shows the relative strength of 8 major currencies: AUD, CAD, CHF, EUR, GBP, JPY, NZD, USD. By default the strength value is normalised to the range from 0 to 100 for RSI algorithm: The value above 60 means strong currency; The value below 40 means weak currency; The indicator is created and optimized for using it externally at an Expert Advisors or as a Custom Indicator inside your programs. F
Trend Power for MT5
ALEKSANDR SHUKALOVICH
5 (1)
Trend Power Indicator is an indicator which helps to identify trend direction and its power by using moving averages ZigZag pattern and correlations of tradable instruments. It provides trend power data with user-friendly interface which can be read easily and fast.   This indicator by default is configured for trading of   Adam Khoo's   ( Piranhaprofit ) strategies. It saves mass of time for searching of tradable pairs by his strategies. It indicates when all required moving averages are align
The MA Bounce Strategy is a strategy that seeks to long FX pairs on a strong uptrend as they bounce off their MA support and shorting FX pairs on a strong downtrend as they bounce off MA resistance. The best suitable periods of moving averages for that strategy are 18, 30, 50. This indicator helps to identify and find place for potential market entry by MA bounce strategy.  More information about  MA Bounce Strategy can be read by this link  https://www.mql5.com/en/blogs/post/743037 .  By defau
Filtro:
Ericj1
54
Ericj1 2023.03.08 10:59 
 

Good day, I am renting the indicator and it is a good indicator. I want to use this indicator to trade GOLD and USD. How to remove all the other currecny lines showing the streght and weakness and be left with only GOLD and USD lines that will show strenght and weakness on thi strenght meter

ALEKSANDR SHUKALOVICH
6398
Resposta do desenvolvedor ALEKSANDR SHUKALOVICH 2023.03.08 11:21
Thanks for you review. It's very important for me. Answer for your question is here: https://www.mql5.com/en/market/product/48464#!tab=comments&page=8&comment=45459430
danmar
1810
danmar 2023.03.03 17:53 
 

HI i just discover that my very very recent asking to have 0, 1 or 2 decimals to have more easy to read was already made ! Great Aleksandr because for me it is so much clear ! your curr str is very very interesting, accurate and your reaction so quick Thanks a Lot. i appreciate a lot i use it , i have a lot of "other" currency and this one is very good and so easy to adapt visual and mode of compute well done for a nice price also Warmly ++++

2023 09 25 : this tool is really very accurate and has all the possibility to adapt at all needs (at least mine !) really accurate, quick compute, and Aleksandr answer all my questions quickly even the response is probably evident

i have 2 necessary tools and this one is one of the 2.

thank you a lot, well done, warmly

ALEKSANDR SHUKALOVICH
6398
Resposta do desenvolvedor ALEKSANDR SHUKALOVICH 2023.03.08 11:22
Thanks for your review.
271811
199
271811 2022.09.07 01:55 
 

Stay awayfrom strength meters...They only tell you what happened already in the market...useless

ALEKSANDR SHUKALOVICH
6398
Resposta do desenvolvedor ALEKSANDR SHUKALOVICH 2024.12.07 14:49
I'm glad to hear that because this indicator was created to show what happening in the market. And traders can use this information to analysis market chart. By the way all indicators analysis historical data and then calculate its own data. There is no indicators which can see future. And it's all good because smarter traders can earn money from less smarter traders unless who become sponsors for successful traders.
Bonnysam
34
Bonnysam 2022.08.20 23:42 
 

One of the best indicators i bought. The indicator is amazing and it saves soo much time. but what amazed me mostly is the level of care and help you get along with the indicator. Thank you Aleksander for offering 5 stars customer service. This will def not be the last time I purchase on of his remarkable indicators. I recommend you to get this indicator, YOU WILL NOT REGRET THIS

ALEKSANDR SHUKALOVICH
6398
Resposta do desenvolvedor ALEKSANDR SHUKALOVICH 2022.08.21 09:18
Thanks for review. I accept any ideas to improve indicator functionality.
astri453
50
astri453 2021.10.25 14:33 
 

What a good Indicator! I like it.

ALEKSANDR SHUKALOVICH
6398
Resposta do desenvolvedor ALEKSANDR SHUKALOVICH 2021.10.25 20:22
Thanks for good review. It's very important for me. I'm getting inspiration to improve it.
ROBERT EDWARD BIRD
2615
ROBERT EDWARD BIRD 2021.05.18 06:44 
 

Not accurate at all. One minute it gives you clear indication that a trade is good as per levels. You take the trade based off lower tf and BOOM..... Reversal. Consistent losses. Save your money on this one

ALEKSANDR SHUKALOVICH
6398
Resposta do desenvolvedor ALEKSANDR SHUKALOVICH 2024.01.02 17:10
I tried to help customer to improve its practice of using indicator.
ALEKSANDR SHUKALOVICH
Hi, I have seen you not very kind review. I want to help you. You first my customer who not so satisfied with my indicator. I think you are using it on a wrong way. I think something wrong with you trading strategy. Then lower timeframe you are using then much higher trading skill trader must have. 1 minutes timeframe is for master expert of trading. It's because on lower timeframe is very easy to manipulate with people. If you are not profitable on D1, H4, H1 TM you shouldn't use lower TF. Also Have you take your trades on price levels? Because if you take it between levels your stop loss can be easily triggered. Indicator shows currencies strength at current time. It's not a leading indicator. It does not see the future. As price starts to change values of indicator changes too and it does its work very accurately (I do not know why you think it's not accurate at all). Tell me about your trading strategy? I think I can help you with it. This indicator helps me to increase my winning trades about 6 percent. You shouldn't trade only indicator values blindly.
10:36 ALEKSANDR SHUKALOVICH
Good way to use indicator is to find many entries to the market according to you strategy then backtest this entries with indicator. Indicator allows to aggregate CSM values from history, Than you should find best CSM values for entry by analyzing your statistic. Than you should check each new entry. They should have similar CSM values.
11:28 ALEKSANDR SHUKALOVICH
By the way tradable pairs are configured for M15 timeframe.
20 May 05:02 ROBERT EDWARD BIRD
Thank you for your reply. Firstly, I am not a new trader. I have a pretty good grasp on what to look for.
Now looking through your message, my trading strategy is trend. I try to stay with the trend amd occasional pullback. Iv'e been trading 1 hr tf but entering off lower tf.(5-15min). I was using your indicator to try to accomplish this better. What I found was that even thhough all indicatirs on m15-D1 would be showing green and over 60% before I would trade with that trend. EG... XAU/USD. XAU would read over 60% on all TF's and USD under 40. Trade would be entered and lost within the hour.
05:03 ROBERT EDWARD BIRD
It would be helpful to see a user guide that caters to the average person on how to initiate your system. As for now, it just loses. Even off 15 min tf
05:06 ROBERT EDWARD BIRD
I also don't know why there is 2 tradable pairs columns. Perhaps you could let me know?
21 May 09:06 ALEKSANDR SHUKALOVICH
Sorry for my long respond. I have been out. I'll try answer soon.
09:21 ALEKSANDR SHUKALOVICH
1) I also don't know why there is 2 tradable pairs columns. Perhaps you could let me know?
First column to shows tradable pairs uses only currencies strength values from different timeframes.
Second columns to shows tradable pairs uses currencies strength values from different timeframes + moving averages alignments.
This columns uses as default presets. As I supposed this columns should be changed by trader according there needs and strategy. It's because each strategy requires its own strength of currencies. Also values from CSM can be used as countertrend traders. For example if strength of USD 80 and strength of CAD 20. These values very over stretched and they can be reversed to opposite direction (USD goes down and CAD goes up).
I supposed trader would backtest its strategy with CSM values and would find the best strength of currencies to its strategy. And then reconfigure tradable pairs columns to show only what trader needs.
Tradable columns count can be changed from 0 to unlimited. It can be done my changing a tradable pairs expression at indicator properties. Look to "Tradable pairs" section at it's properties.
09:24 ALEKSANDR SHUKALOVICH
here is rules from one of my trading strategy
...... ALEKSANDR SHUKALOVICH
It has 31 condition to check. CSM takes only 1 item and it allows to increase my win rate about 6 percent according my statistic. And still this item on experimental state. I'm looking for a better values from CSM. Every 3 month I check all setups and analyze values from CSM.
09:29 ALEKSANDR SHUKALOVICH
I can share my trading plan. Maybe it will be useful fore you.
09:31 ALEKSANDR SHUKALOVICH
Also strength for XAU is not very accurate because to identify its strength accurately you broker has to have all pairs with XAU (XAUAUD, XAUCAD, XAUCHF, XAUEUR, XAUGBP, XAUJPY, XAUNZD, XAUUSD)
09:32 ALEKSANDR SHUKALOVICH
I think your broker has not all of them.
09:32 ALEKSANDR SHUKALOVICH
At indicator properties you can see a warning about it.
09:33 ALEKSANDR SHUKALOVICH 09:36 ALEKSANDR SHUKALOVICH
I'm working on update right now which allows to backtest history on much more powerful way. Now it allows to grab CSM values only from indexes of closed candles. After update you can grab CSM values from any time with 1 minute precision.
09:39 ALEKSANDR SHUKALOVICH
I have many works to do updates for indicators it's very hard to me to write a good documentation. I have started working on it but it still very poor. sorry for that.
09:40 ALEKSANDR SHUKALOVICH
About my other strategy you can read here https://www.mql5.com/en/blogs/post/743037 MA Bounce Strategy
MA Bounce Strategy Indicator There is an indicator which can help to identify and find place for potential market entry by MA bounce strategy. Indicator can be downloaded by this links: MT4
09:40 ALEKSANDR SHUKALOVICH
I have sent you this link before.
09:42 ALEKSANDR SHUKALOVICH
Also I do not know all details about you strategy. There is a chance that this indicator is useless for you trading strategy.
******************************************************************************************************************************************************************************************************************************************
******************************************************************************************************************************************************************************************************************************************
******************************************************************************************************************************************************************************************************************************************
By the way if you have consistent loss just switch "Buy" and "Sell" buttons and you would gain consistent profit.
Clive Tyler
652
Clive Tyler 2020.11.24 09:32 
 

Excellent indicator from an excellent creator, who offers superb customer service and communication. Highly recommend!

lampaal
214
lampaal 2020.09.16 19:43 
 

Best indicator ever - the functionality is excellent. 100 stars. The new release is even better, now 1000 stars, what a tool!!

ALEKSANDR SHUKALOVICH
6398
Resposta do desenvolvedor ALEKSANDR SHUKALOVICH 2021.07.09 12:10
Thanks for you review. It's very meaningful for me. Hope it helps customers too.
aw1977
280
aw1977 2020.08.25 07:58 
 

O usuário não deixou nenhum comentário para sua avaliação

Aravind Kolanupaka
9160
Aravind Kolanupaka 2020.07.17 04:33 
 

Nice Indicator. 10 Stars **********

ALEKSANDR SHUKALOVICH
6398
Resposta do desenvolvedor ALEKSANDR SHUKALOVICH 2021.07.09 12:09
Thanks for you review.
Responder ao comentário
Versão 7.10 2024.11.29
Added MetaTrader global variables for tradable pairs.
Improved names of some input properties.
Fixed dashboard minimize state while switching charts symbols or timeframes.
Refactoring and minor code improvements.
Recompiled with new version of MetaTrader environment.
Versão 7.0 2023.12.18
Improved CCI algorithm and its coordinate system is converted to dimension from 0 to 100 values.
Improved RVI algorithm and its coordinate system is converted to dimension from 0 to 100 values.
Improved Momentum algorithm and its coordinate system is converted to dimension from 0 to 100 values.
Improved DeMarker algorithm.
Improved MACD algorithm.
Added ADX algorithm for instruments' volatility measurement (not to measure strength, the higher the value, the higher the volatility of the instrument).
Changed graph timeframes expression from "Current:[Current]" to "M1:[M5];M5:[AV[M15,M30]];M15:[H1];M30:[H4];H1:[H4];H4:[D1]" (To change it back set property "Graph timeframes expression" tp "Current:[Current]").
"Current:[Current]" expression means: for current chart timeframe show strength which would be calculated on the same timeframe;
"M1:[M5];M5:[AV[M15,M30]];M15:[H1];M30:[H4];H1:[H4];H4:[D1]" expression means:
M1:[M5] - M1 chart timeframe show graph lines which would be calculated on M5 timeframe candles for every one minute (M1);
M5:[AV[M15,M30]] - M5 chart timeframe show graph lines which would be calculated as average of M15 and M30 timeframes candles for every 5 minutes (M5);
M15:[H1] - M15 chart timeframe show graph lines which would be calculated on H1 timeframe candles for every 15 minute (M15);
Other parts of expression can be defined similar to above;
Graph lines labels are visible now by default (to hide them set property "Is graph line labels visible" to false).
Changed default font size for graph lines labels from 14 to 11 (to change it back set property "Line labels font size" to 14).
Changed default table's cell width for simple table from 60 to 62 to accommodate time at info cell.
Log level changed from "Disabled" to "Error" (if you do not need logs messages you have to change property "Log level" to "Disabled").
"Update on every tick " now updates CSM data if new quote would be received for any of monitoring pairs.
Fixed clicking on grid of table's headers cells.
Added information cell on table's header which can show different types of information or be as a "Button" to do some work.
Updated contact information at indicator's "About" property tab.
Added possibility to get alerts separately for all found tradable pairs.
Added seconds to notification's time in notifications signals.
Improved logging.
Added possibility to move dashboard to main window and any sub-window of a chart.
Fixed incorrect focus of dashboard's controls if there are several sub windows on a chart.
Added possibility to use "." and ";" symbols as a separator for timeframes formula for average value calculation of simple and sorted dashboard tables.
Improved parsing of "Graph timeframes Expression":
* Fixed indicator initialization failure if there is no binding between graph lines timeframes and current chart timeframe.
* Added possibility to set empty string to "Graph timeframes Expression", it works similar like "Current[Current]" expression.
Recompiled with new MQL compiler and others minor improvements and fixes.
Versão 6.10 2023.02.28
Added possibility to change number of decimals for simple table, sorted table, graph labels and graph lines libels.
Versão 6.0 2023.02.17
Added sessions time for throwing notifications.
Added possibility to choose show or not show cross lines notification for instruments' for which symbol does not exist.
Improved support of partial strength calculation if not all required history data is available.
Improved indicator work stability.
Improved trace messages.
Fixed mistype at trace messages.
Fixed algorithm of moving average value calculation.
Fixed tradable pairs searching with moving average algorithm in some cases.
Fixed not throwing of cross lines notification if at least one of 28 symbols does not exists.
Fixed out of range error in some cases.
Versão 5.40 2022.10.17
Added MACD algorithm for currencies' strength value calculation.
Added LM (max level boundary) algorithm for tradable pairs searching.
Versão 5.30 2022.09.29
Added better support of x0.5 scaling.
Window's title icon, Window's caption text and Window's main buttons icons are aligned by center.
Versão 5.22 2022.09.11
Added possibility to show label for history line with history line's date and time.
Versão 5.12 2022.08.25
Workaround incorrect GBP symbols parsing by IG broker.
Versão 5.11 2022.08.20
Workaround incorrect symbol parsing by IG broker.
Versão 5.10 2022.07.25
Prevented redundant log writing if dashboard window is invisible.
Improved strength value calculation if new candle for some pairs of 28 is appeared and for some pairs of 28 new candle is not appeared yet (haven't received new ticks for some pairs of 28 at time when new candle should be formed).
Versão 5.0 2022.06.19
Added possibility to show graph lines for multiple timeframes for the same instrument at one sub-window.
Added possibility to change table header text color for all tables.
Added possibility to change text color of table cells for weak, strong and neutral currencies strengths.
Added possibility to chose speed optimization for calculation graph lines for "Time based calculation" (Set property "Use fast time based calculation" to false for dip history back testing. It's slow but very accurate. Use this method for back testing your strategy.. Set property "Use fast time based calculation" to true for fast calculation. It can show little different values dip in history. Use this method for trading.).
Added average strength calculation from different timeframes for graph lines (values of graph lines are calculated by average CSM value of specified Timeframes f.e. AV[H1,H4]).
Added possibility to use specified graph lines timeframes according to current chart timeframe (f.e. Chart timeframe M15 - graph lines timeframes AV[H1, H4];H1 or Chart timeframe H1 - graph lines timeframes AV[H4, D1];H4).
Added graph lines styling for lines of current chart timeframe.
Added graph lines styling for lines of current chart instrument and current chart timeframe at the same time.
Added possibility to show maximum available points to draw graph lines if user has requested data for more than available points by "Candles for calculation" property.
Added "Disabled" log level and it's used by default.
Added possibility to change Libels view of Graph Lines by expression with 3 different replacement variables: ${Instrument}, ${Timeframe}, ${Strength}.
Added possibility to change symbol of current chart by clicking instruments names on headers of simple table rows on dashboard.
Added possibility to change timeframe of current chart by clicking on timeframes on header of simple table columns on dashboard.
Added possibility to change timeframe of current chart by clicking on timeframes on header of sorted table columns on dashboard.
Updated GUI Processor with many graphical improvements and bug fixes of UI processor.
Improved strength calculation speed.
Improved loading speed of graph lines by caching values.
Improved calculation speed of indicator processors for "Time based process" (if possible it passes calculation to "Index base process" which is much faster than "Time based process").
Improved log messages and added new messages to log.
Workaround incorrect symbol parsing by XM broker.
Fixed not updating indicator strength values in some cases (when history time equals to 0, transmitting to "Index base" calculation).
Fixed invalid data for drawing on graph lines if "Candles for calculation" property is set to 0.
Fixed wrong average strength value calculation in some cases.
Refactoring and many other improvements.
Versão 4.0 2021.12.31
Added possibility to run many instances of indicator to the same chart window.
Added application source description for all notifications, it helps to identify from which instance of indicator a notification was thrown.
Added possibility to change the names of tradable pairs table's columns.
Added tracing for terminal information, broker information, MQL program information and input parameters information.
Added "Get instruments from" property for Simple Table, Sorted Table and Tradable Pairs Table to show strength only for specified instruments.
Added possibility to draw graph lines for instruments from specified symbols or specified instruments.
Added possibility to show Cross Lines Notification for instruments from specified symbols or specified instruments.
Added possibility to show Cross Level Notification for instruments from specified symbols or specified instruments.
Added possibility to show Tradable Pairs Notification for instruments from specified symbols or specified instruments.
Added possibility to show Currencies Strength State Notification for instruments from specified symbols or specified instruments.
Added possibility to change table head color for all tables (Simple table, Sorted table, Tradable pairs table).
Added possibility to highlight tables' timeframes cell for current chart timeframe by different color.
Added possibility to highlight tables' instruments cells for current chart symbol by different color.
Added cross level notifications for average strength from multiple timeframes.
Added cross lines notifications for average strength from multiple timeframes.
Added possibility to search crosses lines for cross lines notifications on different timeframe together at the same time (works as AND condition) like it was done for crosses levels notifications.
Added new filtering algorithm for tradable pairs searching. It's called "Symbols". It allows to search tradable pairs with pairs which are listed by user or ignore pairs which are listed by user.
Changed MA algorithm rules for search of tradable pairs (If you are using custom tradable pairs expression do not forget to update your expression according new rules for MA algorithm).
Fixed not showing last tradable pair at tradable pairs table if all pairs should be shown by condition.
Fixed typo mistakes at input parameters of indicator.
Versão 3.3 2021.08.21
Optimized of CSM values calculation by caching values for every update circle (7 times faster, load of CPU for CSM values calculation is reduced for 85 percent).
Added several algorithms for processing of TradablePair table's cell clicking (open pair at new chart, open pair at other chart or new one if it is not opened yet).
Added scrolling of chart to history line time if it is out of view (it allows do not lose history line).
Fixed DeMarker algorithm name.
Workaround-ed MT4 bug when buttons of Timeframes Tool bar of MT4 works improperly while indicator is added to chart.
Workaround-ed MT4 bug when OHLC information of pointed by cursor candle/bar is not shown on Status Bar of MT4 while indicator is added to chart.
Versão 3.2 2021.06.26
Added 5 properties for tradable pairs expression (this properties are concatenated together and it allows to avoid MQL limits for property length of 226 chars, now it's possible to use expression with 1130 chars length).
Versão 3.1 2021.06.23
Added possibility to enable tradable pairs notifications only for specified columns.
Versão 3.0 2021.06.07
Added possibility to backtest history data with history line at specified time with one minute accuracy (not only with close time of candle).
Added time based graph lines calculation (It allows to show currencies strength which is calculated on specified timeframe on candle close time of current chart timeframe).
Added possibility to change Gold symbol. It allows to use any different symbol not only gold but XAG, XAU etc.
Added Bullish or Bearish direction of tradable pairs in tradable pairs notification message.
Sorting of tradable pairs alphabetically.
Adding history line object to visible list of chart objects.
Keeping history line state on chart even if indicator's properties have changed.
Momentum algorithm values for strength calculation is multiplied by 100.
RVI algorithm values for strength calculation is multiplied by 100.
Fixed out of range index error for indicator buffer for some CSM Algorithms.
Versão 2.12 2021.04.05
Fixed indicator buffer index out of range error for some CSM Algorithms.
Versão 2.11 2021.03.31
Fixed tradable pairs finder for MA alignment algorithm if Gold is enabled.
Versão 2.10 2021.03.29
Added navigation through tradable pairs by left mouse click on calls of tradable pairs table.
Added bearish and bullish coloring of tradable pairs table according to expression at indicator properties.
Added possibility to change color for bearish and bullish of tradable pairs cells.
Added bearish or bullish description next to tradable pair for Currency Strength State Notification.
Added new DM (Difference max between currencies' strength) algorithm for tradable pair search engine.
Added Moving Averages Alignment algorithm for tradable pair search engine.
Fixed D (Min Difference between currencies' strength) algorithm for tradable pair search engine for (CCI, RVI and Momentum algorithms).
Fixed indicator initialization if cross level expression is empty at indicator properties.
Versão 2.3 2020.12.31
Added possibility to use multiple tradable pairs finders.
Added tradable pairs state to Currency Strength State Notification.
Added possibility to change visible rows count for tradable pairs table.
Versão 2.2 2020.11.23
Added possibility to add dashboard window to chart main window.
Versão 2.1 2020.11.20
Fixed sending Tradable Pairs notification.
Versão 2.0 2020.11.17
Added high resolution screens support (4K).
Added User Interface (UI) scaling and Font scaling.
Added support of strength identification for Gold.
Added expression based tables columns visibility, It allows to customize tables columns.
Added possibility to get notification once N period candle is closed.
Added expression based notification for levels crossing, which allows to get notifications when there is a cross on many different timeframes all at once.
Added averaging CSM values for different timeframe for tradable pairs finder.
Added support for current chart timeframe for all expressions.
Added new Currencies Strength State Notification which shows strength of all currencies as N period candle is closed.
Added averaging CSM values for Currencies Strength State Notification.
Improved history data loading. It allows to show indicator data more faster if history data is missed.
Improved logging at notifications area.
Fixed updating indicator data when market is closed, when there is not any ticks.
Fixed not sending of notifications on some conditions.
Fixed typo mistakes.
Versão 1.20 2020.07.09
Added auto detection of symbols suffix.
Restore dashboard state when change chart symbol, timeframe, reconnection to the server and changing indicator properties.
Added highlighting of graph lines for current chart instruments.
Added scale ration parameter for RSI algorithm.
Fixed showing of graph lines if selected "Chart Symbols" for "Symbol Type" property.
Versão 1.10 2020.05.03
If not enough available bars on current chart or not full history data we start to draw graph lines for available bars rather than wait for downloading of all bars or history data.
Added logging if not possible to calculate currency strength values.
Updating indicator data forcibly if no updates last 30 seconds to avoid old data if there is no any ticks (weekends etc...) for a long time and MT would have downloaded new history data.
Updating indicator data forcibly at indicator init time to init all buffers and construct all necessary objects.
Fixed typo at currency symbol name "NZDUSD".
Fixed problem with program launch when program file name is very long.
Fixed out of range error while navigating through out indicator buffer data if not available bars at current chart.
Fixed smoothing config for Exponential, Smoothed and Linear weighted algorithms.