Trendlines Chart Patterns Indicator
- Indicadores
- Shiffolika Kapila
- Versão: 1.0
- Ativações: 10
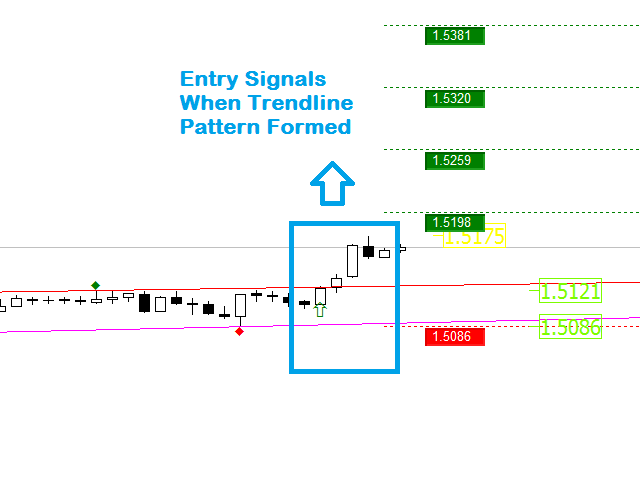
Trend Line Chart Pattern Signals Is a traders Tool for Signals based on Strong Patterns Formed By a pair of robust trend lines.
They FOR WITH DIFFERENT POPULAR PATTERNS ON CHARTS LIKE – TRIANGLES, FLAGS,RANGE , ASCENDING TRIANGLES, DESCENDING PATTERNS, PENNANTS ETC.
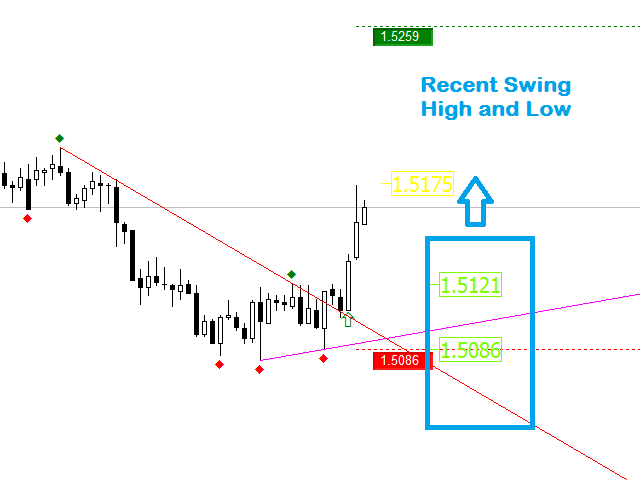
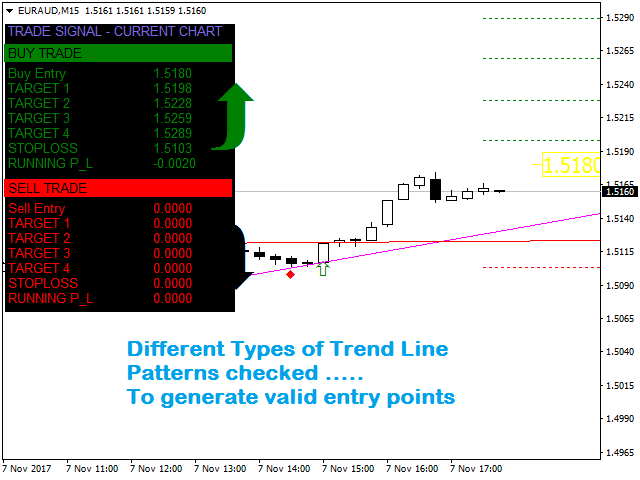
The TREND LINES form dynamically on running bars.
The sensitivity of the trend lines can be changed by custom settings.
The Buy and Sell Signals Generate upon Break Of the Trend Line + "Close" of the same bar above the previous swing High or Low, so they will come only when a strong move takes place.
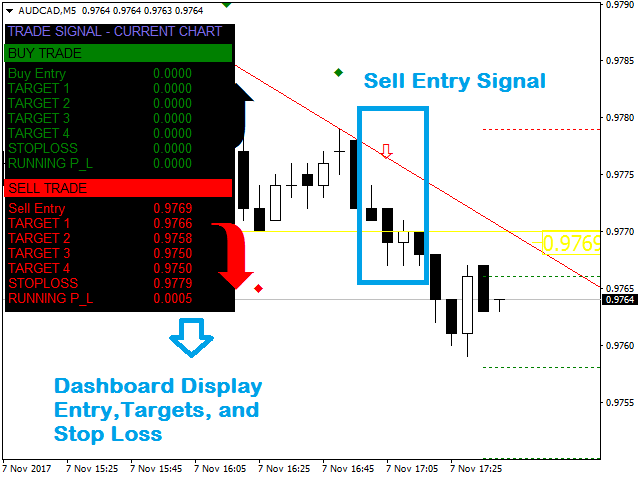
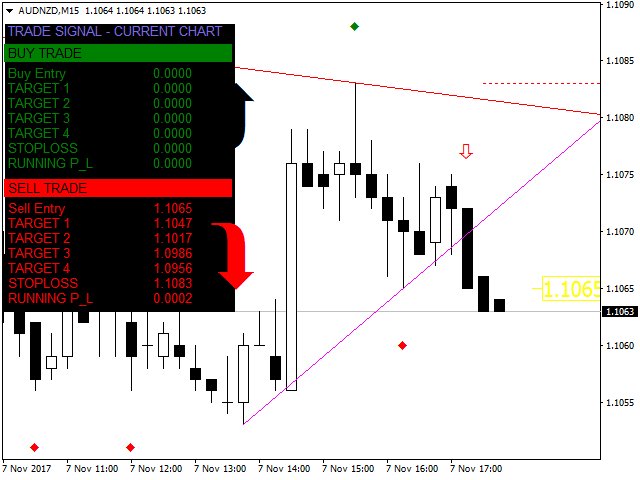
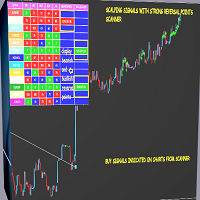
The DASHBOARD displays - ENTRY, MULTIPLE TARGETS AND STOP LOSS LEVELS, and RUNNING PROFIT OR LOSS IN THE TRADE.
The Signals Generate the suitable TARGETS AND STOP LOSS.
The trend line patterns can be customized by changing the - PERIOD setting, so more robust signals may come with higher periods like 30,50 as compared to selecting 5,10 or any small periods.
Parameters
- nPeriod = 10; - This period can be set from 1 to any higher number, for example, 10 means the trend line is formed if found over the last 10 bars.
- Limit = 100; -The look back number of bars to draw the patterns, for example, if we select 100, a trend line formed with above "n" period over the last 100 bars
- ArrowPos = 5; - Arrow Display Position
- Levels = true; - Display On Or Off Of The Trend Lines
- Levels2 = true; - Display On Or Off Of The Swing High And Low
- width = 3; - Display Font Size Of The Labels
- periodtotake = 200;- Target Setting In Pips
- ExitAtTarget = 4; - Selection Of The Target Exit 1 To 4, so if 4 is selected then the trade details on the dashboard will become refreshed once target 4 is reached.
- FontName = "Arial";- Font Selection
- FontSize = 14; -The Display font size of the recent swing high low levels and of the bar timer
- FontColor = White; - The text color of BAR timer display
- PopupAlerts = true; -The Toggle for Alerts of Buy sell signals
- EmailAlerts = false; - The Toggle for Email alerts of buy-sell signals
- Graphics = true; - Turns Display Of Dashboard







Indicator full of logic.... good job. You can make a decision based on those signals.