Levels density indicator
- Indicadores
- Philippe Pauleau
- Versão: 1.0
- Ativações: 5
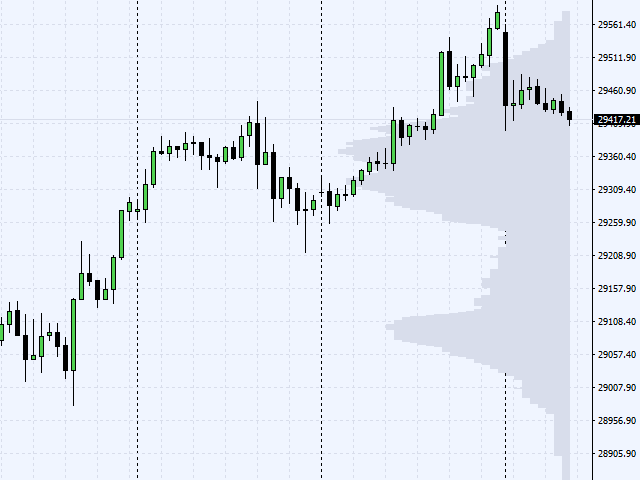
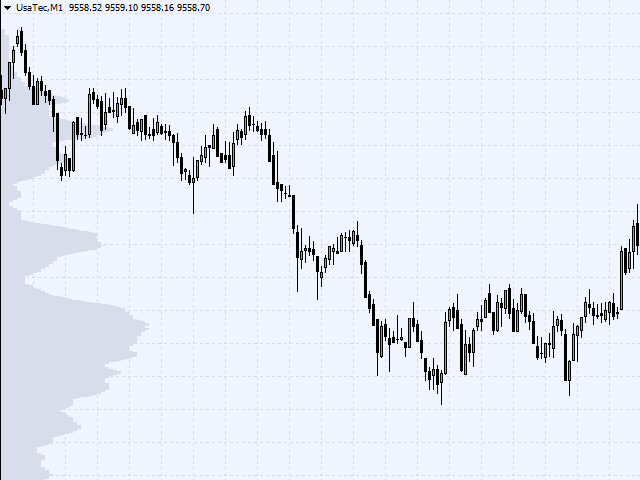
This indicator is showing level's density prices on background's graph.
Theses levels are showing the prices that are the most traded by the market.
This means that these levels can be used in order to place stoploss or takeprofit for swing orders, or for scalping manually in short time periods.
This gives a statistical advantage as these levels are more likelely to be reached or pullbacked by the market.
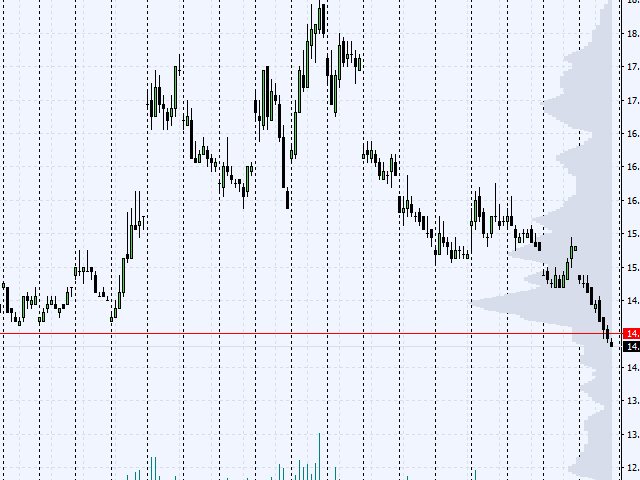
It is also usefull on VIX for example to determine when to enter local low volatility.
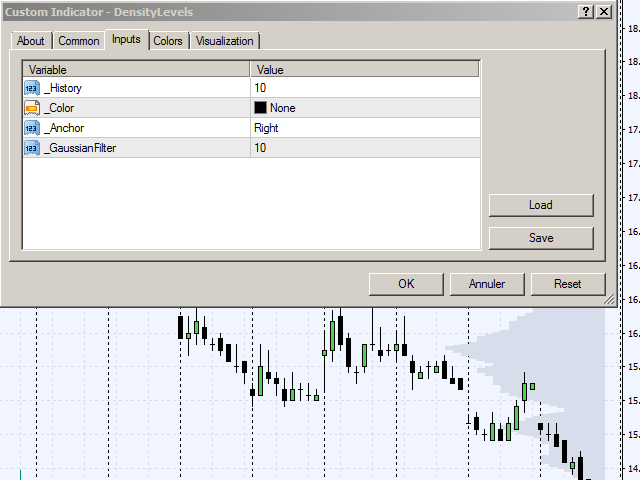
The indicator has the option to apply a gaussian's filter in order to smooth levels and avoid non statistically peaks.
If the indicator
color is set to : "NONE", then the indicator will use the background grid's color.
The History parameter can be set in order for the
indicator to calculate more candles than the number of visible candles on the chart.