PriceProbabilities
- Indicadores
- Stanislav Korotky
- Versão: 1.5
- Atualizado: 24 novembro 2021
- Ativações: 5
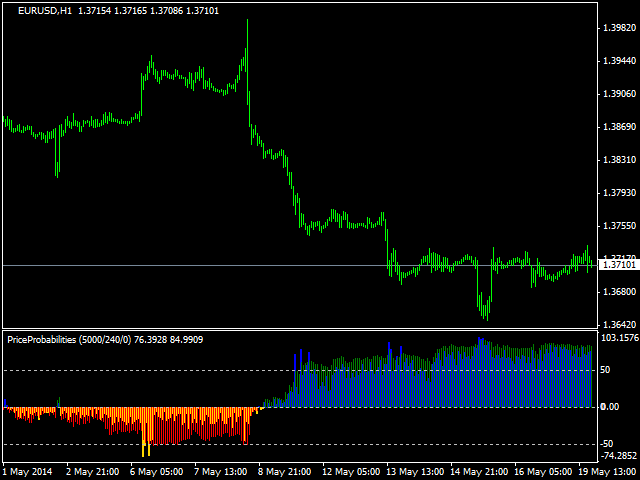
This is a signal indicator for automatic trading which shows probability measures for buys and sells for each bar. It is based on statistical data gathered on existing history and takes into account all observed price changes versus corresponding bar intervals in the past. The core of the indicator is the same as in PriceProbablility indicator intended for manual trading. Unlike PriceProbability this indicator should be called from MQL4 Expert Advisors or used for history visual analysis.
The indicator shows 2 measures:
- Plain quantitative measure of buy and sell strengths (green and red thin histigrams), can be used as a secondary signal, or for aggressive trading;
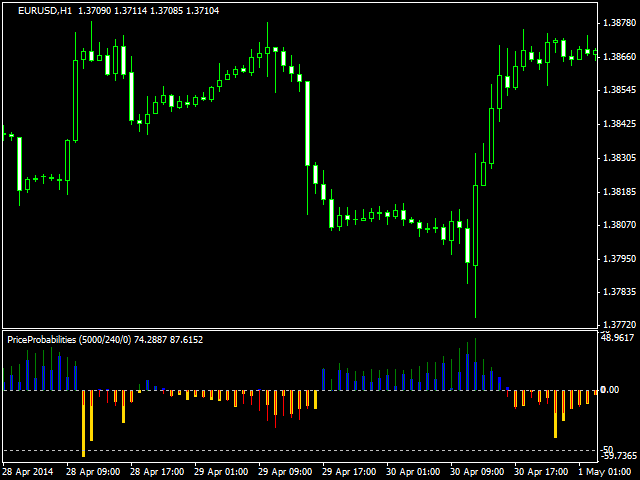
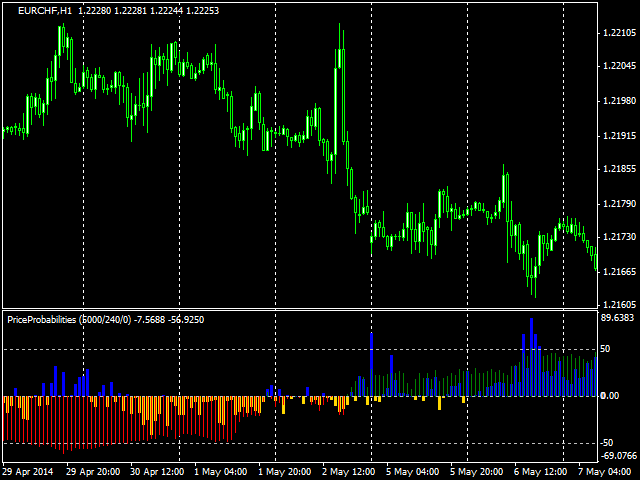
- Probability measure as a ratio of buy and sell probabilities (blue and yellow thick histograms), can be used as a primary signal;
It's important to note, that both measures are nondeterministic. Even if a measure counts for almost 100%, this does not guarantee that corresponding price movement does actually occur in near future. Due to the nature of probability, every single signal may behave differently, but overall they conform to general rules. So, in a long perspective the statistical approach yields more wins than losses.
Parameters:
- HistoryDepth - number of bars to use for statistic calculations; by default - 5000; the larger - the better; please, make sure that there are no holes in history for the specified number of bars; minimum value is 1000;
- ForecastDepth - number of bars to use for probability calculation; bar intervals up to ForecastDepth are taken into account; by default - 100, maximum - 1000; history should contain HistoryDepth plus ForecastDepth bars; NB: only ~1000 bars of history are available in tester at starting point;
- MaxBar - number of bars to calculate indicator on; by default - 100; NB! Calculations are very time consuming, so setting MaxBar to 1000 may require minutes to finish processing! when used from an expert, please, set this parameter to 1;
- Offset - number of bar to shift processing in history at; by default - 0;
- Divider - step of points to use in calculations; by default - 1, which means most accurate calculations in expense of time; when set to a larger value, for example, 10, it will speed up calculations in the specified number of times but results will be rough;
- Mode - mode of calculations; allowed values: 0 and 1; by default - 0;
The indicator can operate in 2 modes, any one selected by Mode parameter. The mode 0 is a default one calculating probabilities in a fairly straight-forward manner: any price change on last ForecastDepth bars is taken into account either for buy or sell hypothesis depending from its sign. The mode 1 is a tricky mode - it handles 2 hypotheses for buy and sell conditions separately, that is only positive changes are taken for buy and only negative for sell. The mode 0 better suits medium- and long-term trading, including trends. The mode 1 suits better short-term trading on local price oscillations, without a long-lasting trend conditions.
The indicator is calculated on every new bar, it does not process ticks.
Recommended timeframes: M15 - H1.

