Indicador Taurus All4 MT5
- Indicadores
- Fabio Oliveira Magalhaes
- Versão: 1.0
- Ativações: 5
Indicador Taurus All4
Taurus All4
Principal confirmação de tendência
O Taurus All4 é um indicador de alta performance, ele indica a força da tendência, e
você pode observar a força da vela.
Nosso indicador possui mais de 4 confirmações de tendência.
Ele é bem simples e fácil de usar.
Modos de confirmação
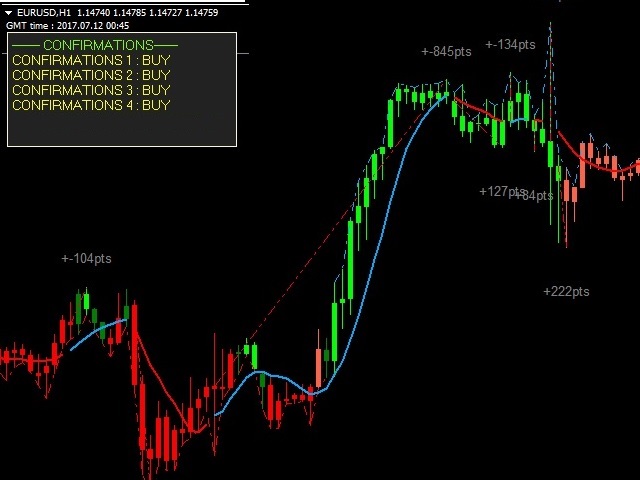
Confirmações de Tendência da Vela:
- Quando uma vela muda para verde claro a tendência é alta.
- Quando uma vela muda para vermelho claro a tendência está revertendo para baixo.
- Quando uma vela muda para vermelho escuro na tendência é baixa.
Confirmações de tendência da linha de tendência:
- Quando a linha no meio das velas ficar azul clara, a tendência será alta.
- Quando a linha no meio das velas, ficar vermelha na tendência será baixa.
Confirmações de tendência da linha pontilhada em cima ou abaixo da vela
- Quando uma linha em cima da vela está azul é uma verificação de tendência de alta.
- Quando uma linha abaixo da vela está vermelha é uma confirmação de tendência de baixa.
Confirmação Suporte e Resistência
- Você pode confirmar uma tendência também visualizando como linhas azuis de suporte e resistência, caso a resistência ou o suporte tenha sido rompido, você pode entrar em acordo com o indicador!
Principal confirmação de tendência
- A principal confirmação de tendência é a linha de tendência no meio das velas que é a confirmação mais forte.
- A 2 confirmação de tendência é um cor das velas.
- E a 3 confirmação de tendência é como linhas pontilhadas em cima ou abaixo das velas
- Não menos importante que as respostas das linhas azuis de suporte e resistência do indicador!