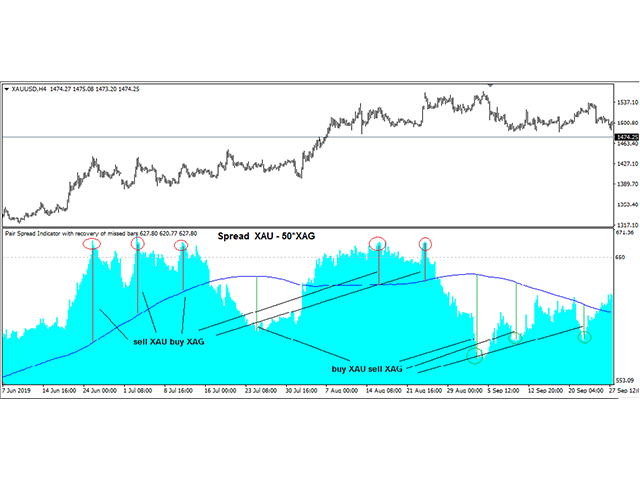
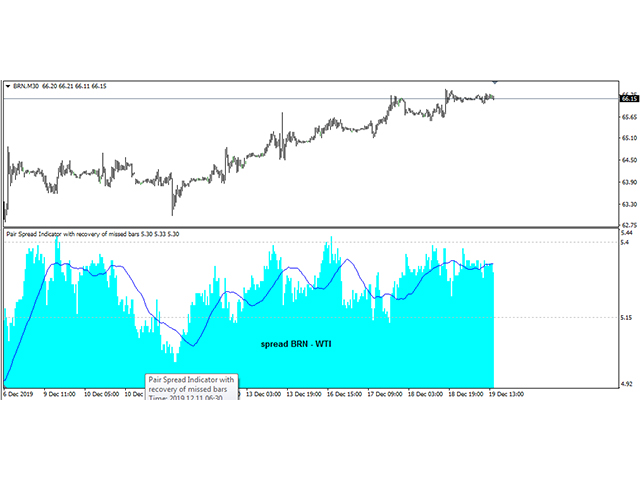
Pair Spread Indicator with recovery of missed bars
- Indicadores
- Vladislav Ostashenkov
- Versão: 1.4
- Ativações: 5
Pair Spread Indicator with recovery of missed bars.
This indicator will automatically restore missed bars in the history at average prices of neighboring bars.
- A histogram chart shows the price difference between the two instruments in a separate window. Ideal for related instruments, for example: BRN - WTI, GOLD - 50 * Silver, DJ - 14 * S & P500, etc .;
- Calculation method: the difference in closing prices (opening / maximum / minimum) between two current bars and sequentially N-bars back;
- Histogram moving average;
- Averaging parameters for the moving average: simple, exponential, smoothed, etc.
- A negative coefficient of one of the tools will change the chart by the sum of prices: tool_1 + tool_2;
- If one of the instruments has missed bars in the history, the indicator will automatically restore them from the average prices of
neighboring bars;
-
Indication of preset levels on the histogram chart.
*** Basic settings ***
- name - Tool;
- price weight coefficient - weight coefficient;
- bar price option -
- period - moving average parameter
- shift - shift
- averaging method - Averaging parameters for the moving average
- 0 - histogram of a positive column, color, width, style;
- 1 - histogram of a negative column, color, width, style;
- 2 - color of the moving average;
- 3 - color of a given level.