AO Chart Indicator
- Indicadores
- Bohdan Kasyanenko
- Versão: 1.3
- Atualizado: 1 dezembro 2021
- Ativações: 6
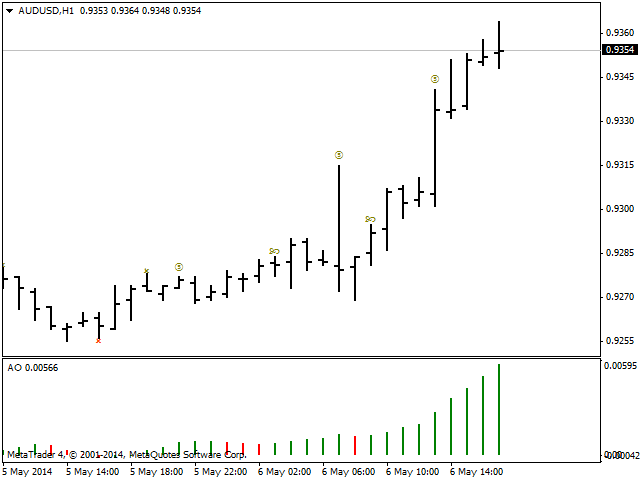
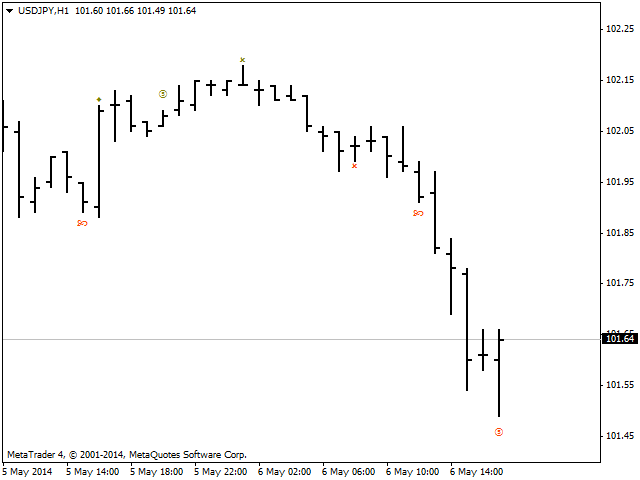
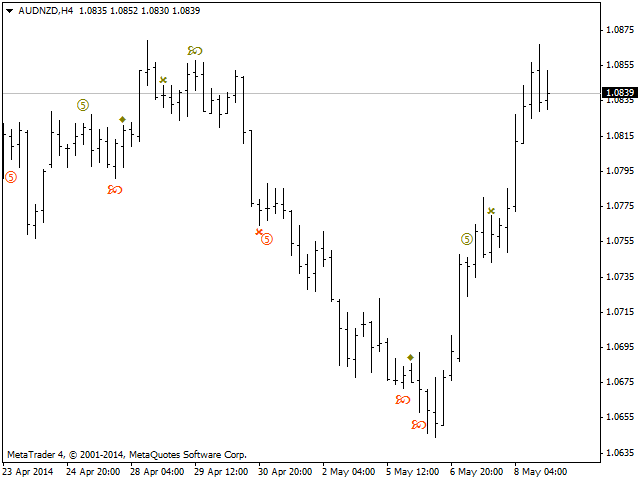
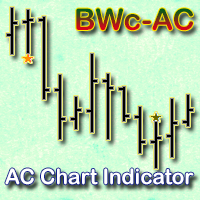
Indicator displays signals of the Awesome Oscillator on the chart according to the strategy of Bill Williams:
- Signal "Saucer" - is the only signal to buy (sell), which is formed when the Awesome Oscillator histogram is above (below) the zero line. A "Saucer" is formed when the histogram changes its direction from descending to ascending (buy signal) or from ascending to descending (sell signal). In this case all the columns AO histogram should be above the zero line (for a buy signal) or below the zero line (for sale).
- "Cross" - buy signal is formed when the histogram AO goes from negative to positive or vice versa. This occurs when the histogram crosses the zero line.
- "Twin Peaks" - a signal to buy is formed when there is a downward peak (the lowest minimum) which is below the zero line AO, followed by another downward peak, which is higher than the previous peak, looking downward. For sale - when there is a peak upward (highest high), located above the zero line AO, followed by another upward peak, which is lower than the previous peak, looking upward.
- In addition indicator displays the Fifth successive bar in the "red" or "green" zone, after which Bill Williams recommends not to increase a position.
