RSI Candle Signal
- Indicadores
- Jonathan Destailleur
- Versão: 1.0
RSI Candle Signal Indicator will change bars’ color when set overbought or oversold levels reach.
How to Use RSI Candle Signal
- Uptrend/Downtrends - RSI may be used to detect trending markets. For example, the RSI may stay above the mid line 50 in an uptrend.
- Top and Buttoms - RSI may help in identifying the tops around the overbought readings (usually above 70), and the bottoms around the oversold area (usually below 30).
- Divergence - divergence occurs when RSI directional movement is not confirmed by the price action. For example, a bullish divergence occurs when EURUSD makes lower low but RSI makes higher low. This means that EURUSD is losing momentum and a bullish correction is possible.
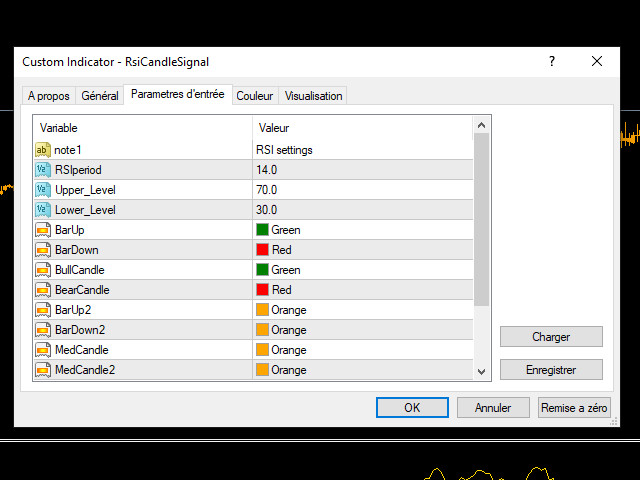
Paramètres ( The setting of the parameters is possible.)
Original Setting :
- RSI Period - 14.
- Overbought - 70.
- Oversold - 30.
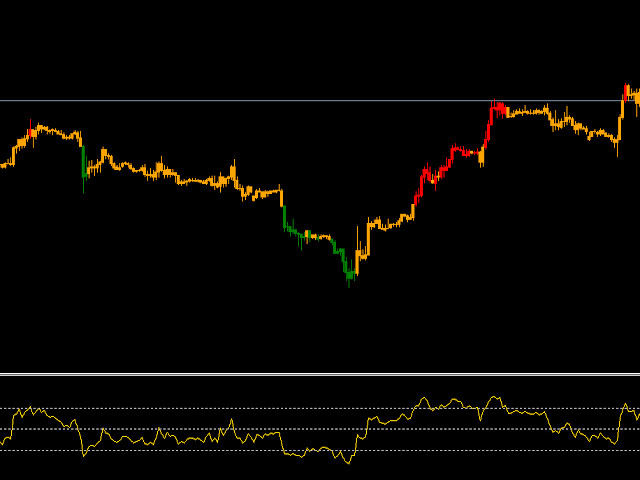


Work well, and helps clean my chart - as the RSI is now integrated on the chart, rather than as a separate graph below the chart.