HistogramChart
- Indicadores
- Dariusz Grywaczewski
- Versão: 213.0
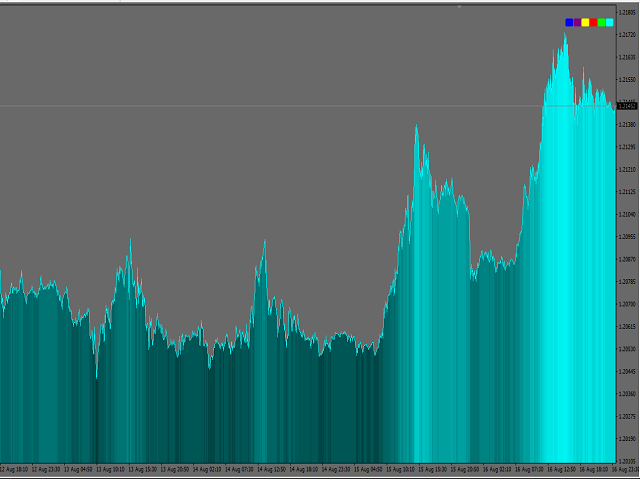
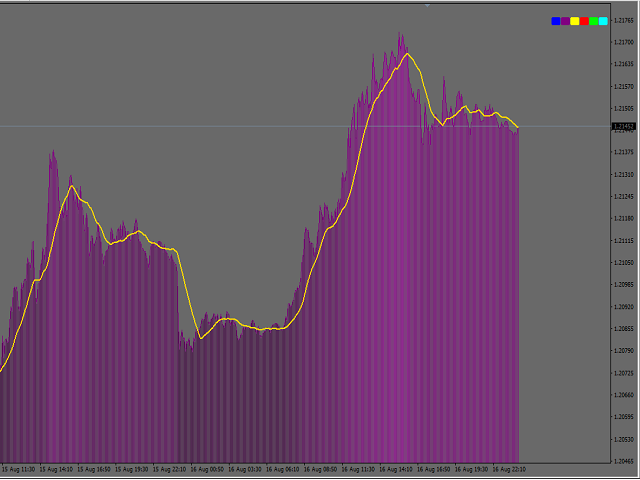
The indicator adds an overlay to the graph to create a histogram.
There are no parameters to set.
On the chart you
can choose the color in the upper right corner by clicking on the appropriate brick.
The histogram is shaded depending on the price value.
Remember to set a line chart (shown in the screenshot).
........................... I invite you to purchase.
