Better Volume MT5
- Indicadores
- Illia Zhavarankau
- Versão: 1.4
- Atualizado: 11 agosto 2019
- Ativações: 5
Description:
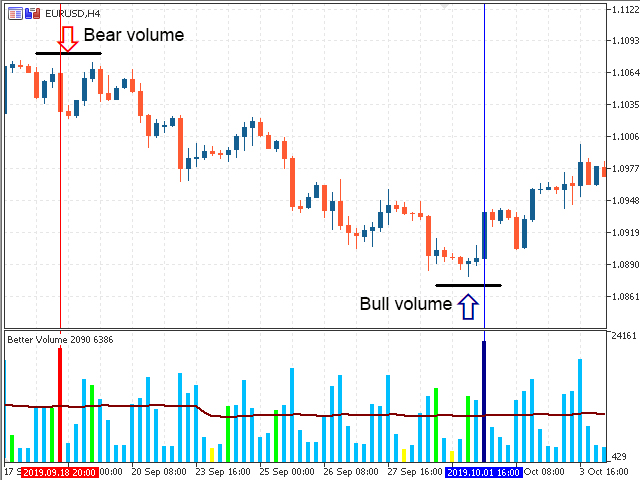
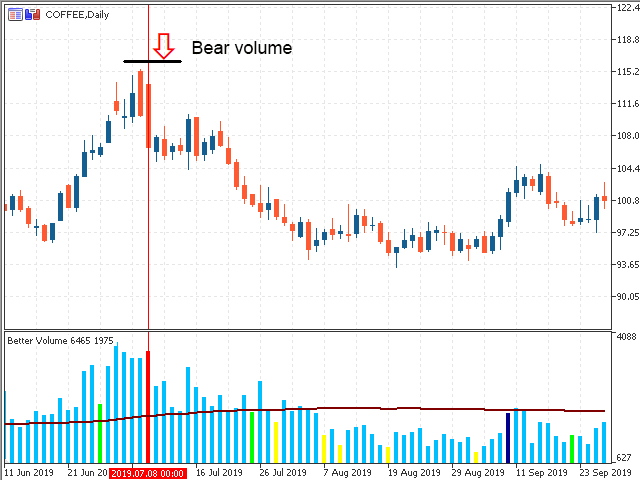
The indicator of tick volumes Better Volume MT5 allows you to assess the general mood of the market and quite accurately catch the moments of the formation of large movements. The indicator is a color histogram in an additional window. In the calculation of Better Volume MT5 the Price Action combinations are taken into account, the values of the volumes with the height of columns and color marking are displayed.
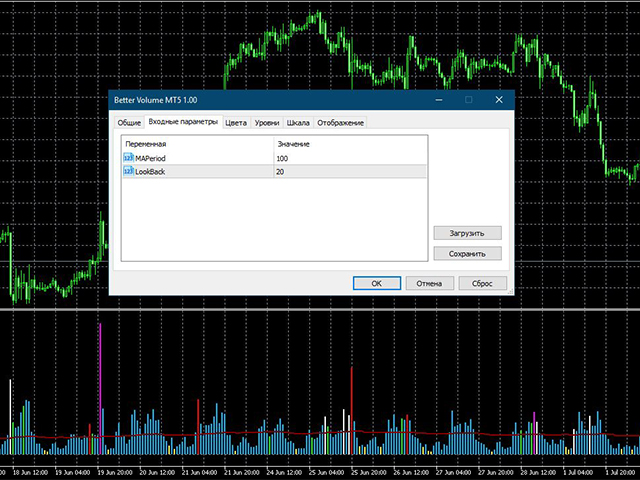
Input parameters:
MAPeriod - period for calculating the moving average for volume;
LookBack - period for which the correct and relative volume is searched.
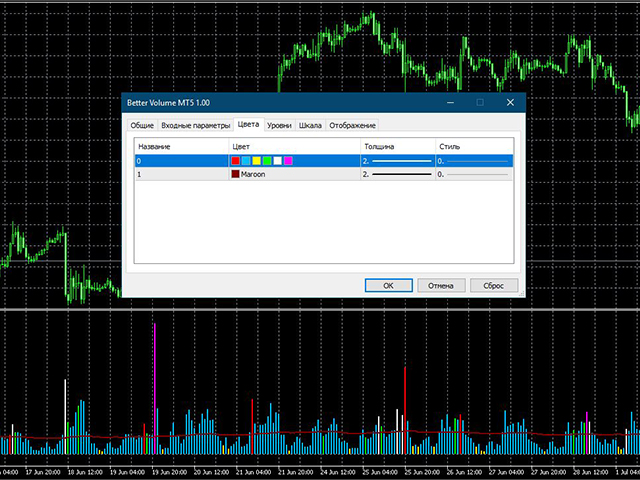
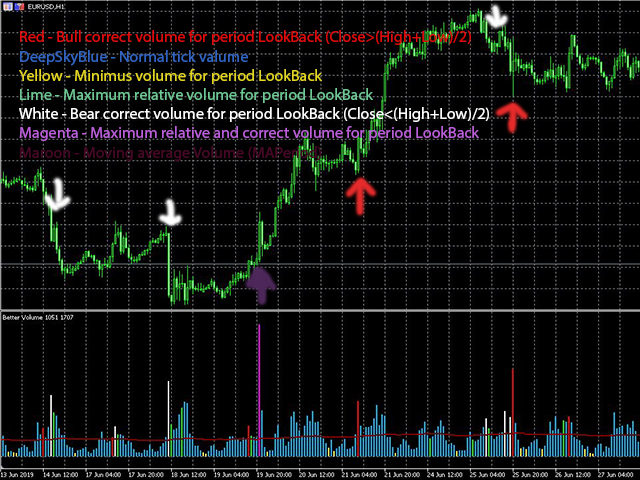
Description of colors:
Red - Bull correct volume for period LookBack (Close>(High+Low)/2);
DeepSkyBlue - Normal tick valume;
Yellow - Minimus volume for period LookBack;
Lime - Maximum relative volume for period LookBack;
White - Bear correct volume for period LookBack (Close<(High+Low)/2);
Magenta - Maximum relative and correct volume for period LookBack;