Support and resistant with pivot
- Indicadores
- Syarif Nur Arief
- Versão: 1.0
- Ativações: 5
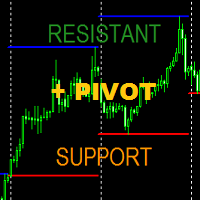
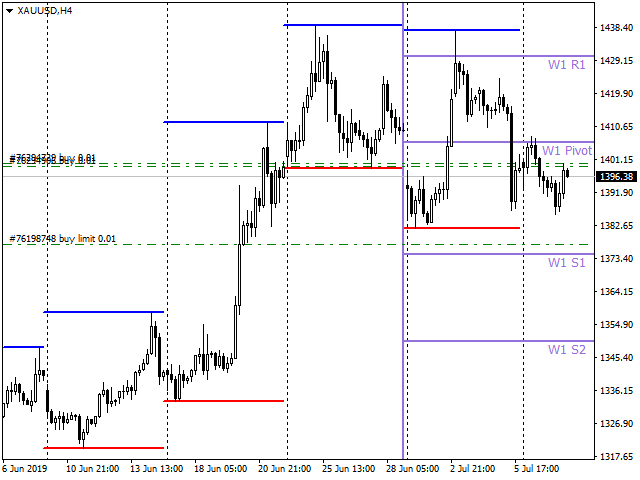
Indicator can drawing Support Level (Lowest price of choosed Time Frame) and Resistance Level (Highest price of choosed Time Frame),
and this indicator can drawing last of Pivot Level from the Last of Support Resistance Level.
Support and Resistance based Highest and Lowest at choosed Time Frame can be your next good experience for your forex trade to maximize your trade win and lost ratio.
Parameter :
- _S_and_R__Setup_, Default is # SUPPORT AND RESISTANT #, No Need To Change
- Drawing_S_and_R, Default is true, Change to false for not drawing Support and Resistant Level
- S_and_R__TF, Default is 1 Week, Change Time Frame
- Highest_Line_Color, Default is Blue, Change the color of Resistant Level
- Lowest_Line_Color, Default is Red, Change the color of Support Level
- Line_Width, Default is 2, Change the line width of Support and Resistant Level
- _Pivot_S_and_R_Setup_, Default is # DRAWING PIVOT FROM S and R #, No Need To Change
- Drawing_Pivot_Line, Default is true, Change to false for not drawing Pivot Level
- Pivot_Line_Color, Default is Yellow, Change the color of Pivot Level
- Pivot_Line_Width, Default is 2, Change the line width of Pivot Level
- Pivot_Text_Size, Default is 10, Change the text size of Pivot Level
