Support and Resistance Custom
- Indicadores
- Wen Cheng Wen
- Versão: 2.3
- Atualizado: 13 junho 2020
- Ativações: 5
Support and Resistance is a very important reference for trading. This indicator provides customized support and resistance levels, automatic draw line and play music functions.
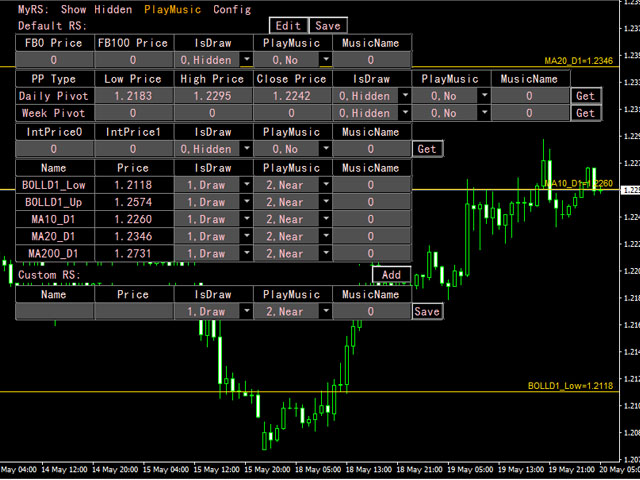
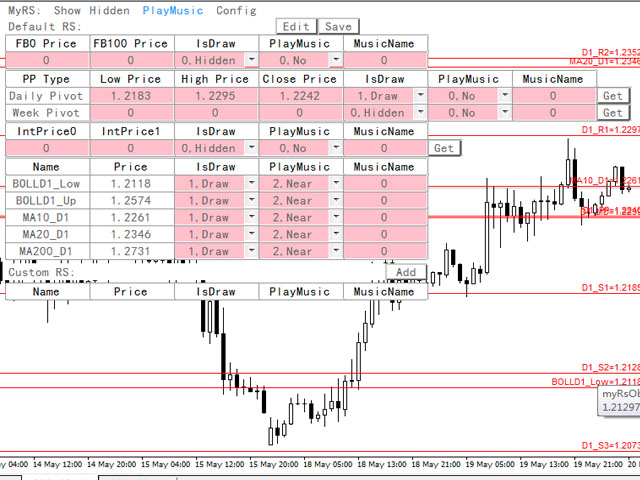
In addition to the custom RS, the default RS includes Pivot Point, Fibonacci, integer Price, MA, Bollinger Bands.
- Pivot Point is a resistance and support system. It has been widely used at froex,stocks, futures, treasury bonds and indexes. It is an
effective support resistance analysis system.
- Fibonacci also known as the Golden Section Sequence, it is a widely used for finding support and resistance.
- Bollinger Bands is a classic index used to measure the intensity and range of market volatility.
- MA is moving average line index, it is used widly on analysis RS.
- integer Price,like 1.1300,1.1400,1.1450...,these prices often become important for market.
all these can auto load by arguments.
In addition to the custom RS, the default RS includes Pivot Point, Fibonacci, integer Price, MA, Bollinger Bands.
- Pivot Point is a resistance and support system. It has been widely used at froex,stocks, futures, treasury bonds and indexes. It is an effective support resistance analysis system.
- Fibonacci also known as the Golden Section Sequence, it is a widely used for finding support and resistance.
- Bollinger Bands is a classic index used to measure the intensity and range of market volatility.
- MA is moving average line index, it is used widly on analysis RS.
- integer Price,like 1.1300,1.1400,1.1450...,these prices often become important for market.
all these can auto load by arguments.
Fibonacci
- 0.0, 0.236,0.382,0.5,0.618,0.786,1, 1.27,1.618
- set any price you need
- 0.0, 0.236,0.382,0.5,0.618,0.786,1, 1.27,1.618
- set any price you need
Pivot Point
- Support Levels
- P=(LastClose+LastHigh+LastLow)/3;
- S1=2*P-LastHigh;
- S2=P-(LastHigh-LastLow);
- S3=(2*P)-((2*LastHigh)-LastLow);
- Resistance Levels
- R1=2*P-LastLow;
- R2=P+(LastHigh-LastLow);
- R3=(2*P)+(LastHigh-(2*LastLow));
- Middle=(LastHigh+LastLow)/2
can auto load daily pivot point, or set any price you need ;
Interger Price
- is like 1.1350,1.1400,1.1450,1.1500.....
Ma
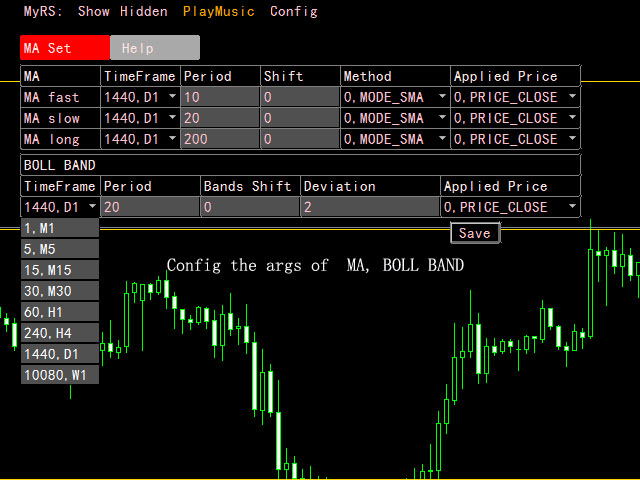
- Ma(10) of period D1 , and Ma(20) of period D1
- is auto load
Bollinger Bands
- Upper of period D1 and Lower of period D1
- is auto load
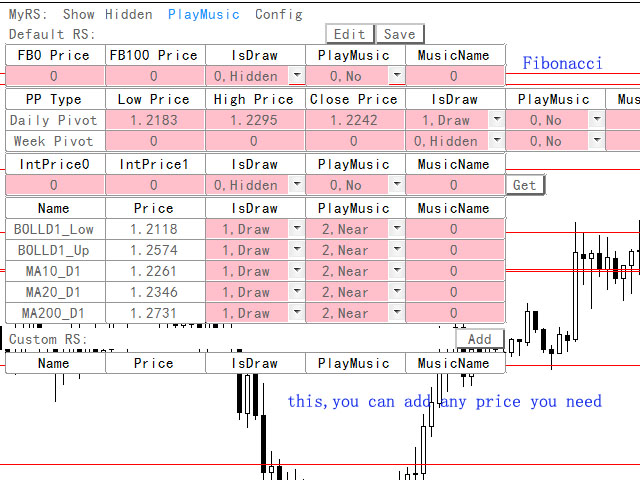
The Custom support and resistance
- you can set any price of you need
User Inputs
- left begin pixels - left of screen distance, pixels number
- BackGroud Color - set backgroud, black or white
- Line Color - set here the colors for the lines
- Lines Style - select here the style for the lines (solid, dot)
- Lines Width - set here the width for the lines
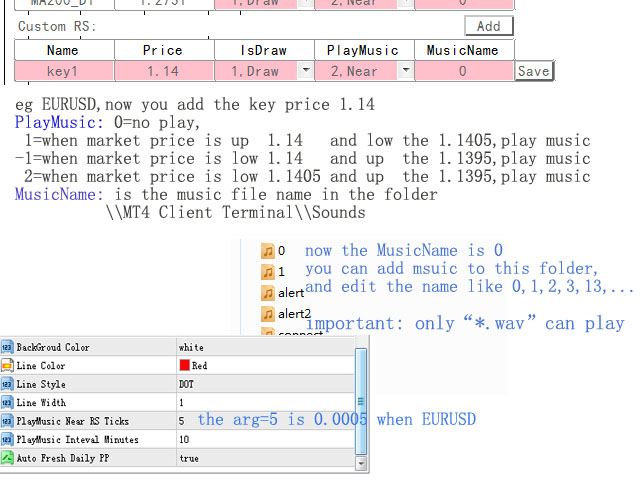
- PlayMusic Near RS Ticks - set here play music when market price near,boundary
- PlayMusic Inteval Minutes - set here how many minutes inteval after paly music last time.
- Auto Fresh Daily PP - select here to enable auto load daily pivot point, if is true you can not edit the daily pivot price indeed.
Requirements to play music
- first step, you need the music source, you can use any music but only "wav" formats can play in mt4 .
- second step, rename the music file name like: 0 or 1, 2, 111 ...
- the third step, copy the music file to the folder: \\your MT4 Client Terminal\\Sounds\\
If you want to test before pay it , please go to the test version ,
hope you like it , and thank you!



I'm using this Indicator very well.
I hope each pivot line(Dayily, BB, Fib, Ma) can control different color.
I'd like a price tag on the left. It could be more convenient.
Now, the price tag covers the candle.