• Visão global
  • Comentários
  • Discussão

The Sextet Scalper Pro

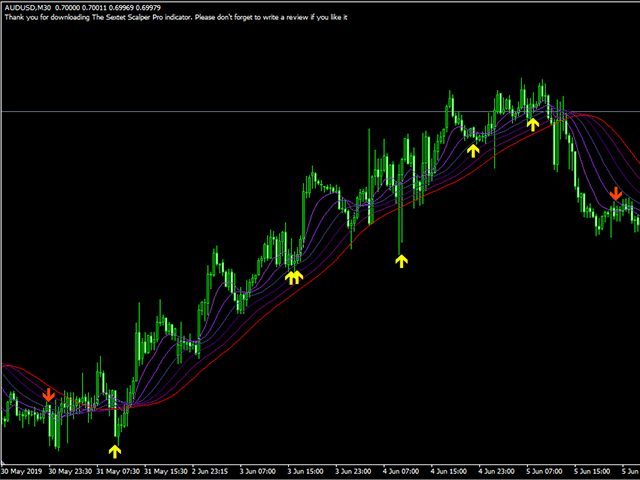
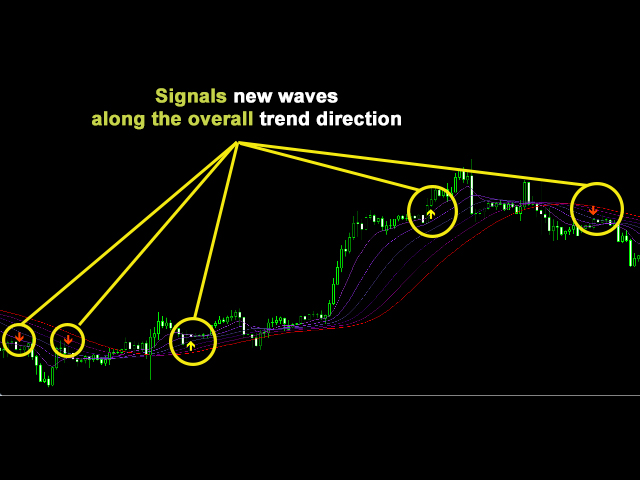
The Sextet Scalper Pro is an MT4 indicator that gives signals when new waves are starting in a trend. The trends are calculated using the original " The Sextet" indicator method.

You get a free EA to trade with The Sextet Scalper Pro: Free EA. Default settings were optimized on GBPUSD H1 from 2017.
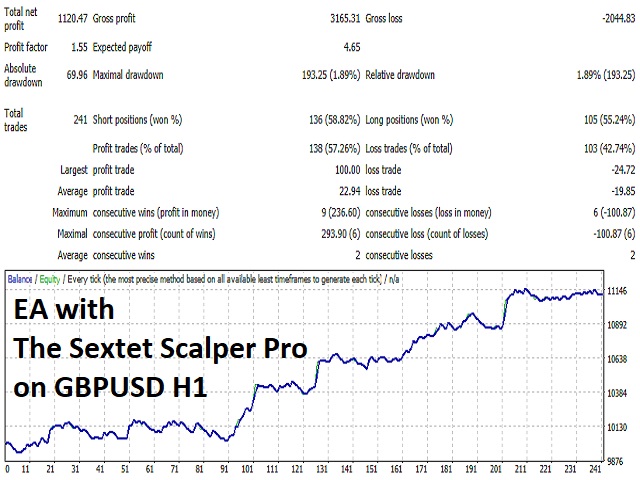
EA could be tested on free demo version of The Sextet Scalper Pro, before purchase.

Key Features:

  • Uses The Sextet Trend Detection Method which is already a good strategy in itself for detecting long trends
  • Signals New Waves in the main trend.
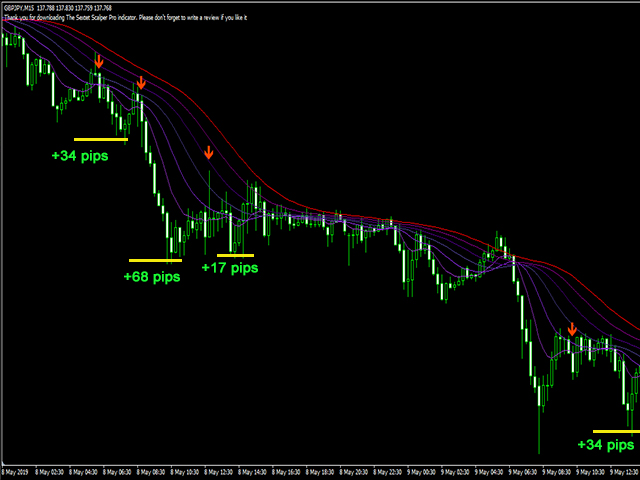
  • Great For Scalping.
  • Also Great For Swing Trading.
  • Sends Alerts and Push Notifications when there's a signal.
  • Works on All Timeframes and Pairs.
  • It's a Complete Strategy in and of itself.
  • Could be easily Integrated in Expert Advisors.
  • Non-repainting.

Settings:

Wave Calculation Period: Period used for the calculation of a new wave in the trend.
Range Detector Period 1: This setting and the following one are the periods used to filter out ranging markets.
Range Detector Period 2.
Slope Period 1: Period of the slope calculation used to avoid trading in big corrections, that could turn into reversals.
Slope Period 2: Period of the second slope calculation used to avoid trading in big corrections, that could turn into reversals. 

First MA Period: Choose the Period of the first moving average(MA).
First MA Method: Averaging Method used for the 1st MA (Simple, Exponential, etc.)
Second MA Period: Choose the Period of the second MA, which is an MA of the first MA.
Second MA Method:
Third MA Period... etc.

GetAlerts: true/false. If set to true you will receive Alerts on Mt4 when there's a buy/sell signal.
PushNotifications: true/false. If set to true you will receive Push Notifications on your phone when there's a buy/sell signal.(positive/negative).

If you like the indicator, please don't forget to LEAVE A REVIEW.

Watch my live trading videos here:
Youtube Channel: nelhajj trading
Produtos recomendados
VR Cub
Vladimir Pastushak
VR Cub é um indicador para obter pontos de entrada de alta qualidade. O indicador foi desenvolvido para facilitar cálculos matemáticos e simplificar a busca por pontos de entrada em uma posição. A estratégia de negociação para a qual o indicador foi escrito tem provado a sua eficácia há muitos anos. A simplicidade da estratégia de negociação é a sua grande vantagem, o que permite que até mesmo os comerciantes novatos negociem com sucesso com ela. VR Cub calcula os pontos de abertura de posição e
This is a trend indicator without redrawing Developed instead of the binary options strategy (by the color of the Martingale candlestick) Also works well in forex trading When to open trades (binary options) A signal will appear in the place with a candle signaling the current candle It is recommended to open a deal for one candle of the current timeframe M1 and M5 When a blue dot appears, open a deal up When a red dot appears, open a trade down. How to open trades on Forex. When a signal is rec
Os indicadores [ZhiBiCCI] são adequados para todo o ciclo de uso e também são adequados para todas as variedades do mercado. [ZhiBiCCI] Linha sólida verde é uma inversão da divergência de alta. A linha pontilhada verde é uma divergência de alta clássica. [ZhiBiCCI] A linha sólida para o vermelho é uma divergência de baixa reversa. A linha pontilhada vermelha é uma divergência clássica de baixa. [ZhiBiCCI] pode ser definido nos parâmetros (Alerta, Enviar e-mail, Enviar notificação), definid
We present you the indicator "Candle closing counter", which will become your indispensable assistant in the world of trading. That’s why knowing when the candle will close can help: If you like to trade using candle patterns, you will know when the candle will be closed. This indicator will allow you to check if a known pattern has formed and if there is a possibility of trading. The indicator will help you to prepare for market opening and market closure. You can set a timer to create a p
Introduction It is common practice for professional trades to hide their stop loss / take profit from their brokers. Either from keeping their strategy to the themselves or from the fear that their broker works against them. Using this indicator, the stop loss / take profit points will be drawn on the product chart using the bid price. So, you can see exactly when the price is hit and close it manually.  Usage Once attached to the chart, the indicator scans the open orders to attach lines fo
Master Scalping M1 é um indicador inovador que usa um algoritmo para determinar a tendência de forma rápida e precisa. O indicador calcula o tempo de abertura e fechamento de posições, os algoritmos do indicador permitem encontrar os momentos ideais para entrar em uma negociação (comprar ou vender um ativo), o que aumenta o sucesso das transações para a maioria dos traders. Benefícios do indicador: Fácil de usar, não sobrecarrega o gráfico com informações desnecessárias. Pode ser usado como filt
Daily Candle Predictor é um indicador que prevê o preço de fechamento de uma vela. O indicador destina-se principalmente ao uso em gráficos D1. Este indicador é adequado tanto para negociação forex tradicional quanto para negociação de opções binárias. O indicador pode ser usado como um sistema de negociação autônomo ou pode atuar como um complemento ao seu sistema de negociação existente. Este indicador analisa a vela atual, calculando certos fatores de força dentro do próprio corpo da vela, be
Noize Absorption Index MT4
Ekaterina Saltykova
5 (1)
Noize Absorption Index - is the manual trading system that measures the difference of pressure between bears forces and bulls forces. Green line - is a noize free index that showing curent situation. Zero value of index shows totally choppy/flat market.Values above zero level shows how powerfull bullish wave is and values below zero measures bearish forces.Up arrow appears on bearish market when it's ready to reverse, dn arrow appears on weak bullish market, as a result of reverse expectation. S
Owl smart levels
Sergey Ermolov
4.13 (23)
Versão MT5  |  FAQ O   Indicador Owl Smart Levels   é um sistema de negociação completo dentro de um indicador que inclui ferramentas populares de análise de mercado, como   fractais avançados de Bill Williams , Valable ZigZag que constrói a   estrutura de onda correta   do mercado e   níveis de Fibonacci que marcam os níveis exatos de entrada no mercado e lugares para obter lucros. Descrição detalhada da estratégia Instruções para trabalhar com o indicador Consultor de negociação Owl Helper Ch
The Penta-O is a 6-point retracement harmonacci pattern which usually precedes big market movements. Penta-O patterns can expand and repaint quite a bit. To make things easier this indicator implements a twist: it waits for a donchian breakout in the right direction before signaling the trade. The end result is an otherwise repainting indicator with a very reliable trading signal. The donchian breakout period is entered as an input. [ Installation Guide | Update Guide | Troubleshooting | FAQ | A
KT Renko Patterns MT4
KEENBASE SOFTWARE SOLUTIONS
2.33 (3)
KT Renko Patterns scans the Renko chart brick by brick to find some famous chart patterns that are frequently used by traders across the various financial markets. Compared to the time-based charts, patterns based trading is easier and more evident on Renko charts due to their uncluttered appearance. KT Renko Patterns features multiple Renko patterns, and many of these patterns are extensively explained in the book titled Profitable Trading with Renko Charts by Prashant Shah. A 100% automate
Power Renko is an indicator which plots Renko bricks underneath the chart using a histogram. You can select the brick size and the timeframe of the Renko bricks as well as whether or not to use the close price or the high/low price of the candles. Renko bricks are based on price alone, not time, therefor the Renko bricks will not be aligned with the chart's time. They are extremely useful for trend trading and many different strategies can be formed from them. Buffers are provided allowing you t
Trend Bilio - an arrow indicator without redrawing shows potential market entry points in the form of arrows of the corresponding color: upward red arrows suggest opening a buy, green down arrows - selling. The entrance is supposed to be at the next bar after the pointer. The arrow indicator Trend Bilio visually "unloads" the price chart and saves time for analysis: no signal - no deal, if an opposite signal appears, then the current deal should be closed. It is Trend Bilio that is considered
Alpha Trend
Evgeny Belyaev
3.33 (3)
Alpha Trend is a trend indicator for the MetaTrader 4 platform; it has been developed by a group of professional traders. The Alpha Trend indicator finds the most probable tendency reversal points, which allows making trades at the very beginning of a trend. This indicator features notifications, which are generated whenever a new signal appears (alert, email, push-notification). This allows you to open a position in a timely manner. Alpha Trend does not redraw, which makes it possible to evalua
Heiken Ashi candle chart is an improved version of The Japanese candle chart, which can effectively filter the market "noise" of the Japanese candle chart. It is favored by many traders for its simplicity and intuition. For trend traders, the HA candle chart is a magic tool. Unlike the traditional Japanese candle chart, Heikenashi does not reflect the opening price, high price, low price and closing price of the market. Instead, Heikenashi calculates the value of a single K line in the dominant
Apresentando o       Gráficos   Quantum Heiken Ashi PRO Projetadas para fornecer informações claras sobre as tendências do mercado, as velas Heiken Ashi são conhecidas por sua capacidade de filtrar o ruído e eliminar sinais falsos. Diga adeus às confusas flutuações de preços e olá para uma representação gráfica mais suave e confiável. O que torna o Quantum Heiken Ashi PRO verdadeiramente único é sua fórmula inovadora, que transforma os dados tradicionais de velas em barras coloridas fáceis de le
Binary Options Support Resistance Indicator This indicator is designed for binary options trading and effectively shows retracements from support and resistance levels. Signals appear on the current candle. A red arrow pointing downwards indicates a potential selling opportunity, while a blue arrow pointing upwards suggests buying opportunities. All that needs adjustment is the color of the signal arrows. It is recommended to use it on the M1-M5 timeframes as signals are frequent on these timef
Trendiness Index
Libertas LLC
5 (3)
"The trend is your friend" is one of the best known sayings in investing, because capturing large trendy price movements can be extremely profitable. However, trading with the trend is often easier said than done, because many indicators are based on price reversals not trends. These aren't very effective at identifying trendy periods, or predicting whether trends will continue. We developed the Trendiness Index to help address this problem by indicating the strength and direction of price trend
Binary Options Assistant (BOA) Multi Currency Dashboard for Binary Options (MT4) . You can use any of the BOA Signals Indicators with the dashboard. Just change the BOA Signals Indicator Name in the dashboard settings to the indicator you want to get signals from. For example: CHILL. BOA_BURN_Indicator_v1   Strategy :   Ana Trader Binary Options Strategy (MACD & Stochastic) BOA_COLD_Indicator_v1   Strategy :  Amalia Trader Binary Options Strategy (Keltner & Stochastic) BOA_CHILL_Indicator_
An indicator of pattern #31 ("Long Island") from Encyclopedia of Chart Patterns by Thomas N. Bulkowski. The second gap is in the opposite direction. Parameters: Alerts - show alert when an arrow appears   Push - send a push notification when an arrow appears (requires configuration in the terminal) GapSize - minimum gap size in points ArrowType - a symbol from 1 to 17 ArrowVShift - vertical shift of arrows in points   ShowLevels - show levels ColUp - color of an upward line ColDn - color of
The Th3Eng PipFinite indicator is based on a very excellent analysis of the right trend direction with perfect custom algorithms. It show the true direction and the best point to start trading. With StopLoss point and Three Take Profit points. Also it show the right pivot of the price and small points to order to replace the dynamic support and resistance channel, Which surrounds the price. And Finally it draws a very helpful Box on the left side on the chart includes (take profits and Stop loss
The indicator displays the data of the Stochastic oscillator from a higher timeframe on the chart. The main and signal lines are displayed in a separate window. The stepped response is not smoothed. The indicator is useful for practicing "manual" forex trading strategies, which use the data from several screens with different timeframes of a single symbol. The indicator uses the settings that are identical to the standard ones, and a drop-down list for selecting the timeframe. Indicator Parame
Trade with Gann on your side!! MASTER CIRCLE 360 CIRCLE CHART, originally created by Gann admitted that this is “The Mother of all charts”. It is one of the last studies that this great trader left for us. The numeric tab le is apparently quite simple like all the tables and is based on square numbers, the SQUARE OF 12 and is by evolution, one of the most important square numbers. Here we can find CYCLE, PRICE AND TIME thanks to angles and grades, to show past and future support and resistance.
Forex Gump
Andrey Kozak
2.75 (4)
Forex Gump is a fully finished semi-automatic trading system. In the form of arrows, signals are displayed on the screen for opening and closing deals. All you need is to follow the instructions of the indicator. When the indicator shows a blue arrow, you need to open a buy order. When the indicator shows a red arrow, you need to open a sell order. Close orders when the indicator draws a yellow cross. In order to get the most effective result, we recommend using the timeframes H1, H4, D1. There
PZ Support Resistance
PZ TRADING SLU
3.33 (3)
Cansado de traçar linhas de suporte e resistência? A Resistência de suporte é um indicador de período múltiplo que detecta e plota automaticamente linhas de suporte e resistência no gráfico com um toque muito interessante: conforme os níveis de preços são testados ao longo do tempo e sua importância aumenta, as linhas se tornam mais espessas e mais escuras. [ Guia de instalação | Guia de atualização | Solução de problemas | FAQ | Todos os produtos ] Melhore sua análise técnica da noite para o d
Trend Ray
Andriy Sydoruk
The indicator shows the potential trend direction by cyclical-wave dependence. Thus, all the rays of the intersection will be optimal rays, in the direction of which the price is expected to move, taking into account the indicator period. Rays can be used as a direction for potential market movement. But we must not forget that the approach must be comprehensive, the indicator signals require additional information to enter the market.
Point61 Indicator
Evgeniy Machok
5 (1)
The Point61 indicator is the result of many years of monitoring of price behavior of currency pairs and metals. It is not a secret, that in times of uncertainty, traders are looking for possible levels of support and resistance - the point, where price should stop its movement. There are 2 possible scenarios at these points: 1. Reverse (correction) to the opposite direction; 2. Breakthrough to continue movement. Very often these points are used to set stop orders - TakeProfit or
Shark Deal Book
Philip Pankaj Suthagar
4 (3)
Term  "shark"  in the business world denotes a high volume investor who just made a good investment in a highly Potential business deal.So, sharks are the ones who make the market move. In our case, if an American shark bought a Japanese company, he/she has to convert American dollars into Japanese yen to make the deal. So, the demand for the Japanese yen will increase sharply. Thus USD/JPY will go short rapidly if the deal was from the shark. Another example, In the case of forex, if fed increa
Bintang Binary R2
Anthonius Soruh
5 (2)
Bintang Binary Indicator work all pairs Time Frame : M5 Expaired : 1 Candle No Repaint, No Delay and Alerts Use manual and auto trading  Easy to use Trial Version, Rent Version and Full Version avaliable Trial Version >>> download here  https://www.mql5.com/en/market/product/54602 Trial Version not have Alerts Rent version 1 month, 3 month, 6 month, 9 month, and 1 years Auto trading is better use MT2 Trading Platform (Contact me for discount 10 % MT2 trading licence) Work good for forex trading
TWO PAIRS SQUARE HEDGE METER INDICATOR Try this brilliant 2 pairs square indicator It draws a square wave of the relation between your two inputs symbols when square wave indicates -1 then it is very great opportunity to SELL pair1 and BUY Pair2 when square wave indicates +1 then it is very great opportunity to BUY pair1 and SELL Pair2 the inputs are : 2 pairs of symbols         then index value : i use 20 for M30 charts ( you can try other values : 40/50 for M15 , : 30 for M30 , : 10 for H1 ,
Os compradores deste produto também adquirem
Gann Made Easy
Oleg Rodin
4.84 (57)
Gann Made Easy é um sistema de negociação Forex profissional e fácil de usar, baseado nos melhores princípios de negociação usando a teoria do sr. W. D. Gann. O indicador fornece sinais precisos de COMPRA e VENDA, incluindo níveis de Stop Loss e Take Profit. Você pode negociar mesmo em movimento usando notificações PUSH. Entre em contato comigo após a compra! Vou compartilhar minhas dicas de negociação com você e ótimos indicadores de bônus de graça! Provavelmente você já ouviu muitas vezes sobr
Trend Punch
Mohamed Hassan
5 (11)
This indicator is unstoppable when combined with our other indicator called  Support & Resistance . After purchase, send us a message and you will get it   for  FREE as a BONUS! Introducing Trend Punch , the revolutionary forex trend indicator that will transform the way you trade! Trend Punch is uniquely designed to provide precise buy and sell arrows during strong market trends, making your trading decisions clearer and more confident. Whether you're trading major currency pairs or exotic sym
FX Power MT4 NG
Daniel Stein
5 (12)
Receba a sua atualização diária do mercado com detalhes e screenshots através do nosso Morning Briefing aqui no mql5 e no Telegram ! O FX Power MT4 NG é a próxima geração do nosso medidor de força de moeda muito popular de longa data, o FX Power. E o que é que este medidor de força da próxima geração oferece? Tudo o que adorou no FX Power original MAIS Análise de força GOLD/XAU Resultados de cálculo ainda mais precisos Períodos de análise configuráveis individualmente Limite de cálculo personal
Gold Stuff
Vasiliy Strukov
4.89 (201)
Gold Stuff-um indicador de tendência projetado especificamente para o ouro, também pode ser usado em qualquer instrumento financeiro. O indicador não é redesenhado ou atrasado. O timeframe recomendado é H1. O EA Gold Stuff Expert Advisor está escrito neste indicador, você pode encontrá-lo no meu perfil. Importante! Entre em contato comigo imediatamente após a compra para obter instruções e bônus!  Você pode obter uma cópia gratuita do nosso indicador Strong Support e Trend Scanner, envie um
LEIA AS INFORMAÇÕES ABAIXO ANTES DE COMPRAR O PRODUTO! Apollo Pips PLUS SP é um produto único! É PARA QUEM QUER ADQUIRIR MEU NOVO INDICADOR "APOLLO PIPS" MAIS BÔNUS "SUPER PACK" COM ACESSO A TODOS OS MEUS INDICADORES DE NEGOCIAÇÃO! Ao adquirir o produto Apollo Pips PLUS SP você está na verdade adquirindo uma versão absolutamente nova do meu indicador Apollo Pips. Esta versão do indicador possui um algoritmo aprimorado e um parâmetro fácil de usar que lhe dá a oportunidade de usar o indicador em
TPSproTREND PrO
Roman Podpora
4.78 (18)
TPSpro TREND PRO   é um indicador de tendência que analisa automaticamente o mercado e fornece informações sobre a tendência e cada uma de suas mudanças, além de dar sinais para entrar em negociações sem redesenhar! O indicador utiliza cada vela, analisando-as separadamente. referindo-se a diferentes impulsos - impulso para cima ou para baixo. Pontos de entrada exatos em transações de moedas, criptomoedas, metais, ações, índices! Versão MT5                   DESCRIÇÃO COMPLETA DO INDICADOR    
Trend Pulse
Mohamed Hassan
5 (3)
Please contact me after purchase to immediately get your PDF strategy + documentation for Trend Pulse !  Official release price of $89  (1 /50 copies left). Next price is $199 . Introducing Trend Pulse , a unique and robust indicator capable of detecting bullish, bearish, and even ranging trends! Trend Pulse uses a special algorithm to filter out market noise with real precision. If the current symbol is moving sideways, Trend Pulse will send you a ranging signal, letting you know that it'
Scalper Inside PRO
Alexey Minkov
4.69 (49)
An exclusive indicator that utilizes an innovative algorithm to swiftly and accurately determine the market trend. The indicator automatically calculates opening, closing, and profit levels, providing detailed trading statistics. With these features, you can choose the most appropriate trading instrument for the current market conditions. Additionally, you can easily integrate your own arrow indicators into Scalper Inside Pro to quickly evaluate their statistics and profitability. Scalper Inside
Currency Strength Wizard é um indicador muito poderoso que fornece uma solução completa para uma negociação bem-sucedida. O indicador calcula o poder deste ou daquele par forex usando os dados de todas as moedas em vários intervalos de tempo. Esses dados são representados em uma forma de índice de moeda fácil de usar e linhas de energia de moeda que você pode usar para ver o poder desta ou daquela moeda. Tudo o que você precisa é anexar o indicador ao gráfico que deseja negociar e o indicador mo
Atomic Analyst
Issam Kassas
5 (2)
Primeiramente, vale ressaltar que este Indicador de Negociação não repinta, não redesenha e não apresenta atrasos, tornando-o ideal tanto para negociação manual quanto automatizada. Manual do utilizador: configurações, entradas e estratégia. O Analista Atômico é um Indicador de Ação de Preço PA que utiliza a força e o momentum do preço para encontrar uma vantagem melhor no mercado. Equipado com filtros avançados que ajudam a remover ruídos e sinais falsos, e aumentam o potencial de negociação.
- Real price is 80$ - 40% Discount ( It is 49$ now ) Contact me for instruction, any questions! Introduction The breakout and retest strategy is traded support and resistance levels. it involves price breaking through a previous level.  The break and retest strategy is designed to help traders do two main things, the first is to avoid false breakouts. Many false breakouts start with a candlestick that breaks out of a level but ends with an immediate candlestick that brings the price back into t
RelicusRoad Pro
Relicus LLC
4.54 (80)
Agora US $ 147 (aumentando para US $ 499 após algumas atualizações) - Contas ilimitadas (PCs ou Macs) Manual do usuário do RelicusRoad + vídeos de treinamento + acesso ao grupo de discórdia privado + status VIP UMA NOVA FORMA DE OLHAR PARA O MERCADO O RelicusRoad é o indicador de negociação mais poderoso do mundo para forex, futuros, criptomoedas, ações e índices, oferecendo aos traders todas as informações e ferramentas necessárias para se manterem rentáveis. Fornecemos análises técnica
Actualmente 20% OFF ! A melhor solução para qualquer novato ou comerciante especializado! Este software de painel de instrumentos está a funcionar em 28 pares de moedas. É baseado em 2 dos nossos principais indicadores (Advanced Currency Strength 28 e Advanced Currency Impulse). Dá uma grande visão geral de todo o mercado Forex. Mostra valores avançados de força da moeda, velocidade de movimento da moeda e sinais para 28 pares de divisas em todos os (9) períodos de tempo. Imagine como a sua
Clear Breakout
Martin Alejandro Bamonte
O indicador "Breakout Buy-Sell" foi desenvolvido para identificar e destacar potenciais oportunidades de compra e venda com base em rompimentos de preços durante diferentes sessões de mercado (Tóquio, Londres e Nova York). Este indicador ajuda os traders a visualizar claramente as zonas de compra e venda, bem como os níveis de take-profit (TP) e stop-loss (SL). Estratégia de Uso O indicador pode ser usado da seguinte maneira: Configuração Inicial : Selecione a sessão do mercado e ajuste o offset
Trend Screener
STE S.S.COMPANY
4.79 (81)
Indicador de tendência, solução única inovadora para negociação e filtragem de tendências com todos os recursos de tendências importantes construídos dentro de uma ferramenta! É um indicador multi-timeframe e multi-moedas 100% sem repintura que pode ser usado em todos os símbolos/instrumentos: forex, commodities, criptomoedas, índices e ações. O Trend Screener é um indicador eficiente que segue a tendência do indicador que fornece sinais de tendência de seta com pontos no gráfico. Os recursos qu
ACTUALMENTE 31% DE DESCONTO!! A melhor solução para qualquer novato ou comerciante especializado! Este indicador é uma ferramenta comercial única, de alta qualidade e acessível, porque incorporámos uma série de características proprietárias e uma fórmula secreta. Com apenas UM gráfico, dá alertas para todos os 28 pares de moedas. Imagine como a sua negociação irá melhorar porque é capaz de identificar o ponto exacto de desencadeamento de uma nova tendência ou oportunidade de escalada! Con
ACTUALMENTE COM 26% DE DESCONTO A melhor solução para qualquer novato ou comerciante especializado! Este Indicador é uma ferramenta comercial única, de alta qualidade e acessível, porque incorporámos uma série de características proprietárias e uma nova fórmula. Com apenas UM gráfico, pode ler a força da moeda para 28 pares de Forex! Imagine como a sua negociação irá melhorar porque é capaz de apontar o ponto exacto do gatilho de uma nova tendência ou oportunidade de escalada? Manual do u
O sistema PRO Renko é um sistema de negociação altamente preciso especialmente concebido para a negociação de gráficos RENKO. Trata-se de um sistema universal que pode ser aplicado a vários instrumentos de negociação. O sistema neutraliza eficazmente o chamado ruído de mercado, dando-lhe acesso a sinais de inversão precisos. O indicador é muito fácil de usar e tem apenas um parâmetro responsável pela geração de sinal. Você pode facilmente adaptar a ferramenta a qualquer instrumento de negoc
Gold Channel   é um indicador baseado na volatilidade, desenvolvido com um algoritmo de tempo especifico para o par XAUUSD que consiste em encontrar possíveis correções no mercado. Este indicador mostra duas linhas exteriores, uma interior (linha de retração) e um sinal de seta, onde a teoria do canal consiste em ajudar a identificar condições de sobrecompra e sobrevenda no mercado. O preço do mercado cairá geralmente entre os limites do canal. Se os preços tocarem ou se moverem para fora do can
Antes de tudo, vale ressaltar que esta Ferramenta de Negociação é um Indicador Não Repintante, Não Redesenhante e Não Atrasado, o que a torna ideal para negociação profissional. Curso online, manual do utilizador e demonstração. O Indicador de Conceitos de Ação de Preço Inteligente é uma ferramenta muito poderosa tanto para traders novos quanto experientes. Ele combina mais de 20 indicadores úteis em um único, combinando ideias avançadas de negociação como Análise do Trader do Círculo Interno e
NAM Order Blocks
NAM TECH GROUP, CORP.
5 (1)
Indicador de detecção de blocos de pedidos de multi-timeframe MT4. Características - Totalmente personalizável no painel de controle do gráfico, fornece interação completa. - Oculte e mostre o painel de controle onde quiser. - Detectar OBs em vários períodos de tempo. - Selecione a quantidade de OBs para exibir. - Interface de usuário de OBs diferente. - Filtros diferentes em OBs. - Alerta de proximidade OB. - Linhas ADR de alta e baixa. - Serviço de notificação (alertas de
PZ Trend Trading
PZ TRADING SLU
4.8 (5)
O Trend Trading é um indicador projetado para lucrar o máximo possível com as tendências que ocorrem no mercado, cronometrando retrocessos e rupturas. Ele encontra oportunidades de negociação analisando o que o preço está fazendo durante as tendências estabelecidas. [ Guia de instalação | Guia de atualização | Solução de problemas | FAQ | Todos os produtos ] Negocie mercados financeiros com confiança e eficiência Lucre com as tendências estabelecidas sem ser chicoteado Reconhecer retrocesso
TPSpro RFI Levels
Roman Podpora
4.8 (20)
Reversal First Impulse levels (RFI)    INSTRUCTIONS        RUS       -       ENG              R ecommended to use with an indicator   -   TPSpro  TREND PRO -  Version MT5 A key element in trading is zones or levels from which decisions to buy or sell a trading instrument are made. Despite attempts by major players to conceal their presence in the market, they inevitably leave traces. Our task was to learn how to identify these traces and interpret them correctly. Main functions: Displaying activ
Order Block Hunter
Noha Mohamed Fathy Younes Badr
5 (1)
Order block hunter indicator is the best indicator for  hunt the order blocks that area where there has been a large concentration of limit orders waiting to be executed Order blocks are identified on a chart by observing previous price action and looking for areas where the price experienced significant movement or sudden changes in direction .This indicator does that for you by using very complicated codes and helps you to take the best areas To buy and sell because it make marks at the best a
Scalper Vault
Oleg Rodin
5 (22)
Scalper Vault é um sistema profissional de escalpelamento que fornece tudo o que você precisa para um escalpelamento bem-sucedido. Este indicador é um sistema de negociação completo que pode ser usado por comerciantes de forex e opções binárias. O período de tempo recomendado é M5. O sistema fornece sinais de seta precisos na direção da tendência. Ele também fornece sinais superiores e inferiores e níveis de mercado Gann. Os indicadores fornecem todos os tipos de alertas, incluindo notificações
M1 Arrow
Oleg Rodin
4.67 (12)
Uma estratégia intradiária baseada em dois princípios fundamentais do mercado. O algoritmo é baseado na análise de volumes e ondas de preços usando filtros adicionais. O algoritmo inteligente do indicador dá um sinal apenas quando dois fatores de mercado se combinam em um. O indicador calcula ondas de um determinado intervalo no gráfico M1 usando os dados do período de tempo mais alto. E para confirmar a onda, o indicador utiliza a análise por volume. Este indicador é um sistema de negociação pr
IX Power MT4
Daniel Stein
5 (5)
O IX Power traz finalmente a precisão imbatível do FX Power para símbolos não-Forex. Determina com exatidão a intensidade das tendências a curto, médio e longo prazo nos seus índices, acções, mercadorias, ETFs e até criptomoedas favoritos. Pode analisar tudo o que o seu terminal tem para oferecer. Experimente e veja como o seu timing melhora significativamente quando negoceia. Características principais do IX Power Resultados de cálculo 100% precisos e sem repintura - para todos os símb
Backtest and Read Overview before purchase. Chart patterns have been a topic of debate among traders; some believe they are reliable signalers, while others do not. Our Chart Patterns All-in-One indicator displays various chart patterns to help you test these theories for yourself. The profitability of these patterns is not a reflection of the indicator's effectiveness but rather an evaluation of the patterns themselves. The Chart Patterns All-in-One indicator is an excellent tool for visualizin
Advanced Supply Demand
Bernhard Schweigert
4.9 (271)
Atualmente com 33% de desconto! A melhor solução para qualquer Trader Novato ou especialista! Este indicador é uma ferramenta de negociação exclusiva, de alta qualidade e acessível porque incorporamos uma série de recursos proprietários e uma nova fórmula. Com esta atualização, você poderá mostrar fusos horários duplos. Você não só será capaz de mostrar um TF mais alto, mas também mostrar ambos, o TF do gráfico, MAIS o TF mais alto: MOSTRANDO ZONAS ANINHADAS. Todos os traders de Oferta e Demanda
Break and Retest
Mohamed Hassan
3.83 (12)
This Indicator only places quality trades when the market is really in your favor with a clear break and retest. Patience is key with this price action strategy! If you want more alert signals per day, you increase the number next to the parameter called: Support & Resistance Sensitivity.  After many months of hard work and dedication, we are extremely proud to present you our  Break and Retest price action indicator created from scratch. One of the most complex indicators that we made with ove
Mais do autor
Signal Strength Meter
Naim El Hajj
3.33 (3)
The Signal Strength Meter is a Multi-Currency, Dual Timeframe Interactive Indicator, which calculates the strength of buy and sell signals, and displays a score for each symbol on a display board. Get a 7-Day Free Trial Version:  Click  Here  (Full Access to The Indicator for 7 Days) Check Video Below For Complete Demonstration, and User Manual here . Key Features: Allows you to see multiple currency signals from one chart Analyses the signals from more than a dozen classic indicators Identi
The Mode
Naim El Hajj
3.67 (3)
The M.O.D.E stands for " Multiple Oscillator Divergence Exit ". It is an indicator which signals a divergence between the price, and multiple oscillators. It is initially an exit indicator because it signals the weakening of a trend, but it could be used as an entry signal if used analytically Key Features: Check many divergences at once Non repainting Sends   Alerts and Push Notifications You could load the M.O.D.E onto a single chart, and be able to see the divergences happening on multiple os
FREE
The Sextet
Naim El Hajj
4 (3)
The Sextet  is an MT4 indicator that displays 6 levels of Moving Averages, where the second is the moving average of the first, the third of the second, and so on. It gives a signal when all the moving average levels align in order. Get a Free Sextet EA, and read discussions about using The Sextet Indicator on Forex Factory: The Sextet EA @ Forex Factory Check out the  The Sextet Scalper Pro  for a more elaborate scalping strategy also with  Free EA . Key Features: Is a Moving Average of a Movi
FREE
The Slope Scanner
Naim El Hajj
3 (2)
The Slope Scanner is a Multi-Currency, Multi-Timeframe scanner of The Slope indicator. It calculates the slope of the price, and displays its direction for each symbol and each timeframe on a display board. Check Video Below For Live Trading Demonstration. Get a 7-Day Free Trial Version:  Click  Here  (Full Access to The Indicator for 7 Days) Key Features: Allows you to see Multiple Murrency signals from one chart Calculates the slope of the Pair on All Timeframes Get a Currency Slope Strength
The Slope
Naim El Hajj
4 (3)
The Slope  is an MT4 indicator that calculates the slope of the price, and draws a histogram so you could see when it's positive, negative, or ranging. Key Features: Calculates Slope of the Line Chart Shows the numbers as a Histogram below the chart Choose Different Periods for calculating the slope. Sends  Alerts and Push Notifications when slope changes direction Settings: CalculationPeriod:  The number of bars used to calculated the slope ( for example, if CalculationPeriod = 10, The Slope
FREE
The   Signal Strength Meter Lite   is an which calculates the strength of buy and sell signals across many indicators, price action, and candlestick patterns, and displays a score for each symbol on a display board. Key Features: Analyses the signals from   more than a dozen   classic indicators Identifies Price Action and   Candlestick patterns   which are used in the calculation of the signals Returns a score of the Overall Signal Strength Ability to Change Smoothing Period to filter out small
Overnight EA
Naim El Hajj
The Overnight EA is a fully automated trading Expert Advisor, which uses technical analysis to take decisions based on various signals. It is originally intended to be used in the late hours of the night, where volatility is low, where we could scalp a few pips and avoid large drawdowns, however it could be used during any time of the day. Overnight EA is designed to have a very high winning ratio, and low drawdowns. It averages between 5-7% monthly with a fixed lot size. Using a VPS to run the
Customize Your Own Strategy and Get Instant Backtest Results All Oscillators Data in a single indicator, displayed on the chart. Get a 7-Day Free Trial Version: Click  Here  (Full Access to The Indicator for 7 Days) The Tangram indicator uses an amalgam of 7 different oscillators , then analyses when the price is in Overbought/Oversold territory, when there's a divergence , and when price is trending . Besides being an indicator that helps you analyse the charts, Tangram also gives you the ab
Filtro:
Sem comentários
Responder ao comentário