Colored Line Graph
- Indicadores
- Igor Semyonov
- Versão: 2.22
- Atualizado: 19 julho 2024
Descrição
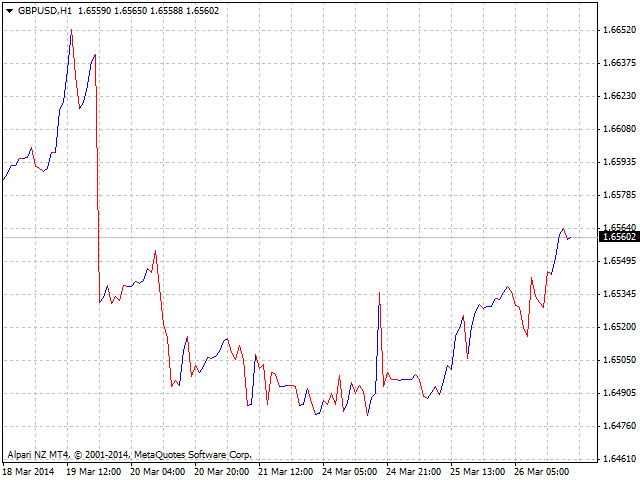
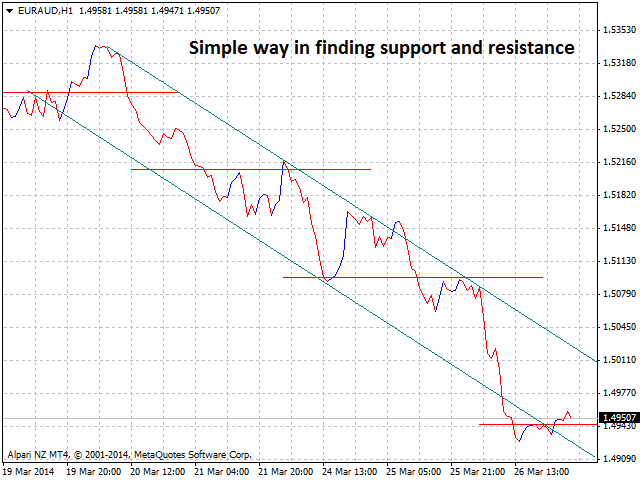
Este é um indicador que reflete o humor do mercado em cores na janela principal do instrumento financeiro no gráfico linear.
É útil para determinar os níveis de suporte e resistência.
Propósito
O indicador pode ser usado para negociação manual ou automatizada como parte de um Expert Advisor. Para negociação automatizada, você pode usar valores de buffers do indicador do tipo double:
- A linha ascendente - buffer 0, não deve ser igual a EMPTY_VALUE.
- linha descendente - buffer 1, não deve ser igual ao EMPTY_VALUE.

Bullshet