• Visão global
  • Comentários (2)
  • Discussão
  • O que há de novo

Directional Key To Change Symbols and TimeFrames

Do you think it's a bit cumbersome when you need to switch symbols or timeframes with mouse click?

1. What is this?

This is a program that can switch symbols and timeframes with direction keys.

  • Fast switching, very convenient, no mouse click required.
  • For traders, one symbol with multi-timeframe charts are usually added,  you can change symbol on those charts easily.
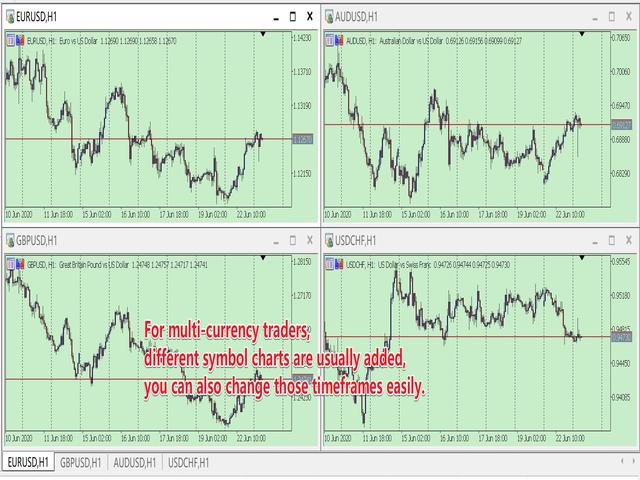
  • For multi-currency traders, different symbol charts are usually added, you can also change those timeframes easily.

I wrote this program in the form of indicator. So you can load other EAs, indicators or run other scripts.

2. How to use it

When you load the program:

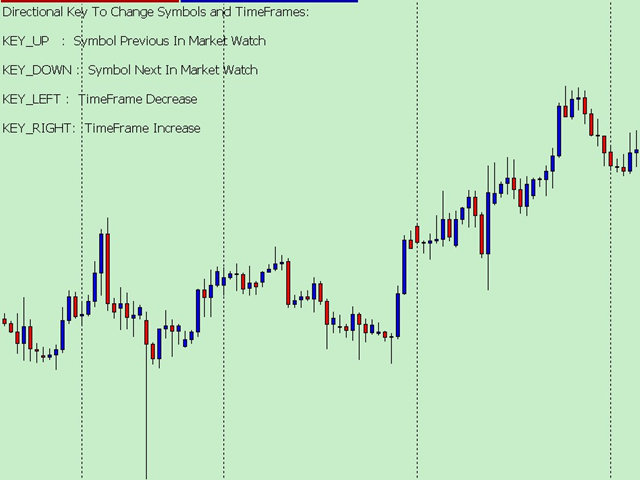
  • The direction key UP is to switch to the previous symbol in market watch.
    • PS:  When the chart is the first symbol, Key UP will switch to the last symbol.
  • The direction key DOWN is to switch to the next symbol in market watch.
    • PS:  When the chart is the last symbol, Key DOWN will switch to the first symbol.
  • The direction key LEFT is to decrease the timeframes.
    • PS:  When the timeframe is M1, Key LEFT will switch to the MN1 timeframe.
  • The direction key RIGHT is the increase time frame.
    • PS:  When the timeframe is MN1, Key RIGHT will switch to the M1 timeframe.

3. Parameters:

  • bool TurnOn_UpDown=true;    // Turn on the UP/DOWN key function to change Symbol.
  • bool TurnOn_LeftRight=true;  // Turn on the LEFT/RIGHT key function to change TimeFrame.
  • bool AllTimeFrames=false;     // Whether to use All Time Frames

=====The following options are used to change other open charts:

PS: I must tell you, when switching between multi charts, the system will download the data, If your system doesn't have data, it will download the data and sometime will cause slowdowns. That is the limited of MT5/MT4 client. When you don't have enough data, don't use the keyboard too quickly.

  • bool OtherOpenChart_Symbol = false;    // Change symbol on other open chart?
  • bool OtherOpenChart_TimeFrame = false;  // Change timeframe on other open chart?
  • int PermitCount = 0; // Just change the count of initially opened chart. 0 means all.
    • PS: when you want to change other charts, but not all the open charts. you can change the num.


Produtos recomendados
O Orion Telegram Notifier Bot  permite que o trader receba notificações de negociações em seu Telegram sempre que uma posição for aberta ou fechada. O EA envia notificações mostrando o Ativo, Magic Number, Direção, Lote (Volume), Preço de Entrada, Preço de Saída, Take Profit, Stop-Loss e Lucro do trade. Como configurar o Orion Telegram Notifier? Abra o Telegram e procure por "BotFather" Clique ou digite "/newbot" Crie um apelido (nickname) e nome de usuário (username) (Exemplo: apelido: MT5trad
RenkoChart EA
Paulo Henrique Da Silva
4.33 (3)
A ferramenta RenkoChart cria um símbolo personalizado com tijolos Renko diretamente no gráfico, exibindo preços precisos na respectiva data/hora de abertura para cada tijolo. Essa característica possibilita a aplicação de qualquer expert ao gráfico Renko. Além disso, esta ferramenta permite também o acesso aos dados históricos dos tijolos através de métodos nativos na linguagem de programação MQL5, como iOpen, iHigh, iLow e iClose, por exemplo. Informações Importantes: O renko gerado na inicia
FREE
Account Informer MT5
Ismail Hakki Delibas
5 (2)
Account Informer Utility Helps you :     Stay in Touch With Your Account.     Hear About Your Account Critical Conditions.     Check Your Account Connectivity.     Inform from any Position Change.     When All Orders Closed     Receive Notifications as Android or IOS Notifications on Your Phone, Email or Popup Window. Information can send in these conditions according to your selection :     Constant Time Period     When Drawdown Larger than Specified Value     When Margin Level Smaller t
This is a support tool that will notify you when the price crosses a trend line, you can draw any trend line by manual, and you can change or drag it on chart in working time This tool will automatically update the new location of the trend line to alert you How to use: after added it on chart, you will draw a trend line and set name of the trend line same as in input of the tool (the parameter LineName ) There are 3 notification methods : Pop Up Alert, Send Email or Notification You can choose
Enhance your price action strategy: inside bar breakouts at your fingertips This indicator detects inside bars of several ranges, making it very easy for price action traders to spot and act on inside bar breakouts. [ Installation Guide | Update Guide | Troubleshooting | FAQ | All Products ] Easy to use and understand Customizable color selections The indicator implements visual/mail/push/sound alerts The indicator does not repaint or backpaint An inside bar is a bar or series of bars which is/a
Super ATR
Lina Staseliene
Super ATR is a powerful tool for analyzing the ATR (Average True Range) levels. The intuitive interface allows you to easily monitor all the main ranges of volatility. Key Features Plots the daily АТR areas on the chart. Plots the weekly АТR areas on the chart. Plots the monthly АТR areas on the chart. Displays a panel with the current values of the main volatility ranges (M5,H1,D1,W1,MN) on the chart. The areas and values in the table change their color when the ATR level is reached. Draws the
BeST Swing Strategy MT5 is a Metatrader indicator based on the corresponding Jim Berg's work about volatility as described in his article "The Truth About Volatitlity" (TASC 2/2005).The indicator consists of 2 channel lines deriving as (MA+/- times the ATR) and can be used as a standalone trading system.The outlier prices of the Market as of the indicator's values can be used for producing Entry and Exit Signals. Advantages of the indicator == Uses 2 Swing Strategies == Never repaints its Sig
Have you ever take a long time to watch a Symbol when the network link is not good ? Have you ever wait for a long time when you switch chart between different Symbols or different TimeFrames ? If you do long-term backtesting , Have you ever to be downloaded datas for a long time ? Yes, If there is no data in the system, those will happen.  1. What is this: Download all the Symbol data in Market Watch to the system. PS: This is not outputting data to Files. This Link go to Demo version: https:/
TradingX Hotkeys
Johannes Stephanus Lombard
Inputs Available Lotsizes Partial Close % You can change lotsizes as you require On an open chart click once to select chart to be able to use hotkeys on specific chart. All Pairs can be used with this expert We created this expert to be able to still trade C300 with a 0.06 Lotsize If you enter a 0.6 lot and close 0.90% you can trade with 0.06 Lot Keys to be used: B -Buy S -Sell C -Close Profitable D -Breakeven (Note if stoploss is set it won't break even) P -Partial close X -Close all
AutoCloseTimer allows you to close positions and delete pending orders at a specified time. Usage Download and drag and drop AutoCloseTimer onto the chart. Check Allow AutoTrading in Common tab. Set parameters in Inputs tab. Notice: The close time must be later than the current market time. Input Parameters CloseSymbol - there are 2 options SymBol Of Chart - just close the symbol of the current chart All Symbols - close all symbols CloseTimerDay - specify a day for AutoCloseTimer. The default
Rectangle line Trade Execution Assistant Rectangle Line Trade Assistant EA  Semi-Automated Trading Assistant       IMPORTANT :   On the main/purchased program a user can click on the Rectangle line and move/ drag it around the chart, by double clicking on it. Please keep in mind that this option is not available on demo version, due to some restrictions/limitations of Strategy Tester, some Object related operations are not available in the Strategy Tester. But, it will not prevent you from Test
Introducing the Ultimate Trade Panel MT5 - Your All-in-One Trade Manager for MQL5 Trading Are you a trader looking to streamline your trading activities and gain a competitive edge in the market? Look no further! The Ultimate Trade Panel MT5 is here to revolutionize your trading experience on the MQL5 platform. With a plethora of unique and time-saving features, this expert advisor is designed to be your reliable companion for day-to-day trading activities. Key Features: Indicator Manager: Say g
Olá amigos Investir é considerado um negócio difícil e arriscado aos olhos das pessoas. Mas se você investir adquirindo conhecimentos e habilidades, o mercado nunca irá te prejudicar. A escrita de filtros no mercado de capitais é uma das ações que os profissionais da área realizam para aumentar a produtividade e economizar tempo. Devido à atividade de um grande número de símbolos, o volume de informações e dados armazenados é muito elevado. As pessoas que atuam neste mercado às vezes precisam
This tool can help you close all open orders with one click, just click "Close all". If you only want to close profitable orders, click the "Close profitable" button. After clicking, all floating orders will be closed; If you only want to close the orders with floating losses, click the "Close losable" button. After clicking, all orders with floating losses will be closed. This tool has been tested for a year. The one-click position closing function is very complete, the position closing is time
O HAshi-E é uma forma aprimorada de analisar os sinais do Heiken-Ashi. Resumo: O Heiken-Ashi é particularmente valorizado por sua capacidade de filtrar a volatilidade de curto prazo, o que o torna a ferramenta preferida para identificar e acompanhar tendências, ajuda na tomada de decisões sobre pontos de entrada e saída e auxilia na distinção entre sinais falsos e reversões genuínas de tendências. Diferentemente dos gráficos de velas tradicionais, as velas Heiken-Ashi são calculadas usando os
SyncGraph Plus
PATRICK ANTONIO MORELO A.
Indicador que sincroniza os gráficos, isto é, quando o ativo é substituído em um dos gráficos todos os que estiverem com o indicador sincronizado são alterados, com o mesmo timeframe (Same_Timeframe = true) ou com timeframes diferentes (Same_Timeframe = false). Os gráficos a serem sincronizados são identificados pela cor (Label). Para sincronizar os indicadores deve-se inserir o indicador em todos os gráficos a serem sincronizados, utilizado a mesma cor (Label). Uma caixa com a cor (Label) esco
MT5 To Notion
Levi Dane Benjamin
5 (3)
Este programa permitirá que você exporte todas as suas negociações de sua conta MetaTrader diretamente para o Notion usando uma interface de usuário muito amigável. Versão MT4  |  Guia do Usuário + Demo Para começar, use o Guia do Usuário e baixe o Modelo do Notion. Se você deseja uma demonstração, por favor, vá para o Guia do Usuário. Não funciona no testador de estratégias! Principais Características Exporte todas as negociações de sua conta de negociação para o Notion Exporte negociações em a
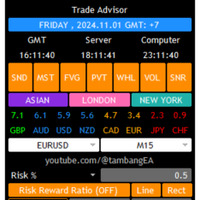
Consultor de comércio: dominando o gráfico O melhor assistente de Expert Advisor (EA) para traders profissionais VERSÃO Versão MT4 | Versão MT5 | Blogs v.3.0 - Integração com o bot do Telegram Nota: A versão MT4 é mais leve que a versão MT5 Consultor de comércio: dominando o gráfico O Trade Advisor é um assistente de trading avançado concebido para melhorar as estratégias de trading integrando importantes ferramentas de análise de mercado e funcionalidade perfeita para traders. Aqui e
N-second K-line chart, customizable, monitoring multiple seconds of multiple symbols simultaneously, all Chinese parameters, easy to use -------------------------------------------------------------------------------------------------------------- You can ask me any questions in private messages https://www.mql5.com/en/users/chaoping0326 Customization of indicators and EA for MT4 and MT5 is available Long term programming project (MT4 from 2012, MT5 from 2016). Good programming skills, reasonabl
Click and Go Trade Manager, the ultimate solution for seamless trading execution. With a simple click on the chart, you can effortlessly define your stop loss, entry price, and target levels. No more hassle of inputting values manually - it's made incredibly intuitive and easy. Embedded risk management is a key feature of our Trade Manager. We understand the importance of protecting your investments, which is why the Click and Go Trade Manager incorporates risk management. When placing orders, y
Ema cloud smooth
Hermes Sebastian Cifuentes Bohorquez
This indicator has been developed as an analytical tool based on exponential moving averages (EMA) . Its purpose is to provide additional insights into market dynamics using two exponential moving averages (EMA) and one smoothed exponential moving average (SMMA) . The indicator can be applied to different financial instruments and timeframes, depending on user preferences. Some traders use it on 30-second charts , complementing it with a 2-minute chart . How the Indicator Works The analysis is b
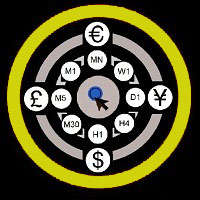
This utility can compare simultaneously time frames of different instruments and keep under control   the nine major time frames  of an instrument. It is composed by two changers, a crosshair and some additional components : the  multicharts time frames changer   is designed to  compare  simultaneously  up to thirty time frames  of different symbols with the  keyboard or the button the multicharts symbols changer can  link up to nine charts and control simultaneously the nine major time frame b
MMTrader Manager
Mateusz Makarewicz
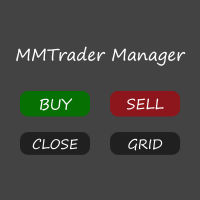
Welcome to my MMTrader Manager product. EA that allows You for simple managing trades and positions. Demo Trial version:  https://www.mql5.com/en/blogs/post/761592 Key Features: Position Opening – Open trades quickly with customizable Take Profit (TP), Stop Loss (SL), and lot size settings. Position Closing – Close trades with one click. Grid System – Automatically create a grid of orders. Recovery Mode – Loss recovery lot calculation. Trade History Data – Acces data to historical positions. Us
"Support or Resistance Alert Broken" is a simple and very intuitive tool that allows you to create or eliminate horizontal and trend supports and / or resistances with a simple click. When the support or resistance line is broken by the closing price at the end of the current candle, the "Support or Resistance Alert Broken" tool will send an alert with sound, as well as a notification to the MT4 or MT5 mobile application. This tool can send alerts from multiple pairs at the same time. Utility
PivotePoint MT5
Kambiz Shahriarynasab
Unlike many other indicators including the moving average indicator, Pivot Point can be a leading indicator. In these systems, the price levels of the previous period are used to determine the critical points instead of relying on the current price performance. Such an approach provides a clear framework for traders to plan their trades in the best possible way. You can use this method and its combination with the methods you want to build and use a powerful trading setup. MT4 version Let us kno
PLEASE CONTACT ME BEFORE PURCHASE FOR DISCOUNT UP TO 50% Key Features: Full Range Breakout Strategy: The EA continuously monitors price movements and identifies breakout points based on predefined high and low ranges. When the price moves beyond these levels, the EA automatically opens trades, positioning itself to take advantage of potential price trends. Trailing Stop Loss: To enhance risk management and protect profits, the EA includes a trailing stop loss feature. This functionality allows
Spread Eliminator
Wouter Dries Bijnens
I'm proudly introducing "Spread Eliminator" - Your Ultimate Solution against High Spreads in Forex Trading! Are you tired of hitting Stop Losses or having pending orders triggered at a bad price due to high spreads while trading? All this is now over with our revolutionary EA , Spread Eliminator! Can be used on Prop Firms that enforce high overnight spreads and/or high spreads during high volatile market conditions. Key Features: Smart Spread Monitoring: Spread Eliminator constantly monitors mar
Script for quick updates (synchronization) up-to-date data in the SQLite database. Saves open positions and orders, current quotes. Take advantage of SQLite's capabilities for intermediate data storage, analytics, and integrations of the MetaTrader platform. Keep all your data in one place. Use the saved data in SQL analytical queries, from Python and other languages, to build dashboards Parameters useDefaults true - use default parameters. Save data to the COMMON hierarchy, to the db/ram/{s
FREE
MQL Tool "Ofir Email to Telegram": Never Miss a Trading Alert Again! Tired of missing important alerts from your indicators and Expert Advisors (EAs)? Ofir Email to Telegram is the solution you've been waiting for! This revolutionary MQL tool automatically forwards all email alerts from your indicators and EAs directly to your Telegram account. Never again will you miss a trading opportunity or important notification! Here are just a few of the benefits of Ofir Email to Telegram: Quick and easy
TradePulse Commander Pannel
AL MOOSAWI ABDULLAH JAFFER BAQER
Apresentamos o **Painel de Gestão de Operações** definitivo, projetado para otimizar suas operações de trading e aumentar sua eficiência! Nosso painel avançado está repleto de recursos poderosos que simplificam suas tarefas de trading e fornecem informações em tempo real: - **Gerenciamento de TP e SL com um clique**: Elimine facilmente todos os níveis de Take Profit (TP) e Stop Loss (SL) em toda a sua conta ou para pares específicos com apenas um clique. - **Rastreamento de Ordens em Tempo Re
Os compradores deste produto também adquirem
Trade Assistant MT5
Evgeniy Kravchenko
4.41 (177)
Ajuda a calcular o risco por comércio, a fácil instalação de uma nova encomenda, gestão de encomendas com funções de fecho parcial, trailing stop de 7 tipos e outras funções úteis. Materiais e instruções adicionais Instruções de instalação   -   Instruções para a aplicação   -   Versão de teste da aplicação para uma conta de demonstração Função de linha Mostra no gráfico a linha de Abertura, Stop Loss, Take Profit. Com esta função é fácil definir uma nova ordem e ver as suas características ad
Bem-vindo ao Trade Manager EA—uma ferramenta de gestão de risco criada para tornar o trading mais intuitivo, preciso e eficiente. Não é apenas uma ferramenta para executar ordens, mas uma solução abrangente para planejamento de operações, gerenciamento de posições e controle de risco. Seja você um iniciante, trader avançado ou scalper que precisa de execução rápida, o Trade Manager EA adapta-se às suas necessidades, oferecendo flexibilidade em todos os mercados, desde forex e índices até commodi
TradePanel MT5
Alfiya Fazylova
4.85 (126)
O Trade Panel é um assistente comercial multifuncional. A aplicação contém mais de 50 funções de negociação para negociação manual e permite automatizar a maioria das operações de negociação. Atenção, a aplicação não funciona no testador de estratégia. Antes de comprar, pode testar a versão de demonstração numa conta de demonstração. Versão de demonstração aqui . Instruções completas aqui . Comércio. Permite realizar operações de negociação com um clique: Abra as ordens e posições pendentes com
Local Trade Copier EA MT5
Juvenille Emperor Limited
4.98 (86)
Experimente uma cópia de negociação excepcionalmente rápida com o Local Trade Copier EA MT5 . Com sua fácil configuração de 1 minuto, este copiador de negociações permite que você copie negociações entre vários terminais MetaTrader no mesmo computador Windows ou em um Windows VPS com velocidades de cópia ultra rápidas de menos de 0.5 segundos. Seja você um trader iniciante ou profissional, o   Local Trade Copier EA MT5   oferece uma ampla gama de opções para personalizá-lo de acordo com suas ne
The product will copy all telegram signal to MT5 ( which you are member) , also it can work as remote copier.  Easy to set up, copy order instant, can work with almost signal formats, image signal,  s upport to translate other language to English Work with all type of channel or group, even channel have "Restrict Saving Content", work with  multi channel, multi MT5 Work as remote copier: with signal have ticket number, it will copy exactly via ticket number. Support to backtest signal. How to s
Trade Dashboard MT5
Fatemeh Ameri
4.97 (71)
Tired of complex order placement and manual calculations? Trade Dashboard is your solution. With its user-friendly interface, placing orders becomes effortless, by a single click, you can open trades, set stop loss and take profit levels, manage trade lot size, and calculate risk to reward ratios, allowing you to only focus on your strategy. Say goodbye to manual calculations and streamline your trading experience with Trade Dashboard. Download  Demo Version  right now. You can find  Details of
Cerberus Equity Watcher
Samuel Bandi Roccatello
5 (3)
Cerberus the Equity Watcher é uma ferramenta de gerenciamento de risco que monitora constantemente o patrimônio da sua conta e evita grandes perdas, causadas por EAs defeituosos ou por seu comportamento emocional. É extremamente útil para traders sistemáticos que dependem de EAs que podem conter bugs ou que podem não ter um bom desempenho em condições de mercado inesperadas. Cerberus permite que você defina um valor mínimo de patrimônio e (opcionalmente) um valor máximo, se qualquer um deles for
Trade Manager DaneTrades
Levi Dane Benjamin
4.58 (24)
Trade Manager para ajudá-lo a entrar e sair rapidamente de negociações enquanto calcula automaticamente seu risco. Incluindo recursos para ajudar a evitar negociações excessivas, negociações de vingança e negociações emocionais. As negociações podem ser gerenciadas automaticamente e as métricas de desempenho da conta podem ser visualizadas em um gráfico. Esses recursos tornam este painel ideal para todos os traders manuais e ajudam a aprimorar a plataforma MetaTrader 5. Suporte multilíngue. Vers
MT5 to Telegram Signal Provider é uma utilidade fácil de usar e totalmente personalizável que permite o envio de sinais especificados para o chat, canal ou grupo do Telegram, tornando sua conta um fornecedor de sinais . Ao contrário da maioria dos produtos concorrentes, ele não usa importações de DLL. [ Demonstração ] [ Manual ] [ Versão MT4 ] [ Versão Discord ] [ Canal do Telegram ] Configuração Um guia do usuário passo a passo está disponível. Não é necessário conhecimento da API do Telegram;
Grid Manual MT5
Alfiya Fazylova
4.89 (18)
"Grid Manual" é um painel comercial para trabalhar com uma grade de ordens. O utilitário é universal, possui configurações flexíveis e uma interface intuitiva. Ele trabalha com uma grade de pedidos não apenas na direção da média das perdas, mas também na direção do aumento dos lucros. O trader não precisa criar e manter uma grade de pedidos, tudo será feito pelo ""Grid Manual". Basta abrir um pedido e o "Grid manual" criará automaticamente uma grade de pedidos para ele e trabalhará com ele até q
Trade Assistant 38 in 1
Makarii Gubaydullin
4.9 (21)
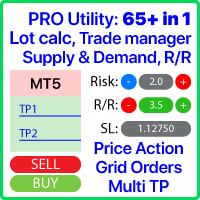
Ferramenta multifuncional: 65+ funções, incluindo: calculadora de lote, Price Action, proporção R/R, gerenciamento de trade, zonas de suporte e resistência Versão Demo   |   Manual de usuário   |    Versão MT4 O utilitário não funciona no testador de estratégia: você pode baixar a versão Demo AQUI para testar o produto. Contate-me   para perguntas / ideias de melhorias / caso encontrar algum erro Os trades automáticos serão permitidos se estiverem habilitados na plataforma e na corretora Simplif
RiskGuard Management
MONTORIO MICHELE
5 (19)
ATENÇÃO : o expert não funciona no testador de estratégias. Para uma versão de demonstração, visite meu perfil. Manual de instruções Para baixar o journal automático, visite meu perfil RiskGuard Management – Trading profissional, sem compromissos O RiskGuard Management é o aliado definitivo para todo trader que deseja maximizar os lucros e minimizar as perdas com uma gestão de risco avançada. Não é apenas uma ferramenta: é um sistema inteligente que te ajuda a seguir seu plano de trading, evita
Exp COPYLOT CLIENT for MT5
Vladislav Andruschenko
3.9 (31)
Copiadora de comércio para MT5 é um  comércio   copiadora para a plataforma МetaТrader 5 . Ele copia negociações forex  entre   qualquer conta   MT5  - MT5, MT4  - MT5 para a versão COPYLOT MT5 (ou MT4  - MT4 MT5  - MT4 para a versão COPYLOT MT4) Copiadora confiável! Versão MT 4 Descrição completa +DEMO +PDF Como comprar Como instalar    Como obter arquivos de log    Como testar e otimizar    Todos os produtos da Expforex Você também pode copiar negociações no terminal МТ4 ( МТ4  - МТ4, МТ5  -
Custom Alerts: Monitore vários mercados e nunca perca uma oportunidade importante Visão Geral Custom Alerts é uma solução dinâmica para traders que desejam uma forma consolidada de acompanhar possíveis setups em vários instrumentos. Ao integrar dados de nossas ferramentas principais — como FX Power, FX Volume e IX Power — Custom Alerts notifica automaticamente sobre mudanças cruciais do mercado, sem precisar gerenciar diversos gráficos ou correr o risco de perder oportunidades valiosas. Se voc
Telegram To MT5 Receiver
Levi Dane Benjamin
4.82 (11)
Copie os sinais de qualquer canal do qual você seja membro (incluindo privados e restritos) diretamente para o seu MT5.  Esta ferramenta foi projetada com o usuário em mente, oferecendo muitos recursos que você precisa para gerenciar e monitorar as negociações. Este produto é apresentado em uma interface gráfica fácil de usar e visualmente atraente. Personalize suas configurações e comece a usar o produto em minutos! Guia do usuário + Demo  | Versão MT4 | Versão Discord Se deseja experimentar
Trade copier MT5
Alfiya Fazylova
4.53 (30)
Trade Copier é um utilitário profissional projetado para copiar e sincronizar negociações entre contas de negociação. A cópia ocorre da conta / terminal do fornecedor para a conta / terminal do destinatário, instalada no mesmo computador ou vps. Antes de comprar, você pode testar a versão demo em uma conta demo. Versão de demonstração aqui . Instruções completas aqui . Principais funcionalidades e benefícios: Suporta a cópia de MT5> MT5, MT4> MT5, MT5> MT4, incluindo contas "MT5 netting". Os mod
DrawDown Limiter
Haidar, Lionel Haj Ali
5 (20)
Drawdown Limiter EA You are in the right place if you were searching for Drawdown control, Drawdown limiter, Balance protection, Equity Protection or Daily Drawdown Limit related to Prop Firm, FTMO, or Funded account trading, or if you want to protect your trading account. Have you suffered from controlling your drawdown when trading funded accounts? This EA is meant for you. Prop firms usually set a rule called “Trader Daily Drawdown”, and if it is not respected, you are disqualified.  I am an
Seconds Chart MT5
Boris Sedov
4.56 (16)
Seconds Chart — uma ferramenta exclusiva para criar gráficos de segundos no MetaTrader 5 . Com o Seconds Chart , você pode criar gráficos com períodos definidos em segundos, proporcionando flexibilidade e precisão ideais para análise, indisponíveis em gráficos padrão de minutos ou horas. Por exemplo, o período S15 indica um gráfico com velas de 15 segundos. Você pode usar quaisquer indicadores, Expert Advisors e scripts com a mesma facilidade dos gráficos padrão. Diferente das ferramentas padrão
EmoGuardian
Samuel Bandi Roccatello
5 (3)
Evite overtrading, FOMO e comportamentos compulsivos, impondo limites de risco avançados à sua conta de negociação usando o EmoGuardian. Adicione automaticamente Stop Losses às posições, gerencie as perdas de EAs , carregue/descarregue EAs automaticamente. Limite o risco por posição, por tradedd, por intervalo de tempo, por dia. As opções de gestão de risco foram desenvolvidas para combater especificamente os comportamentos compulsivos que levam os comerciantes a explodir as suas contas. Atenção
Didi Alert Needle Detector
Alexandre Tadeu Molina
5 (7)
DIDI Alert - Detector de Agulhadas da ATM Systems Você está procurando uma ferramenta que te ajude a aproveitar as melhores oportunidades de negociação no mercado financeiro? Então você precisa conhecer o DIDI Alert - Detector de Agulhadas da ATM Systems, o único utilitário do Mercado que se utiliza da poderosa estratégia de negociação do Setup de Agulhadas do Didi Aguiar através do DIDI INDEX e que conta com vários recursos disponíveis, nenhum outro PROGRAMA dedicado à essa estratégia é tão c
-25% discount ($149 -> $111) Everything for chart Technical Analysis indicator mt5 in one tool Draw your supply demand zone with rectangle and support resistance with trendline and get alerts to mobile phone or email alert -  Risk reward indicator mt5 Video tutorials, manuals, DEMO download   here .   Find contacts on my   profile . 1.   Extended rectangles and trendlines Object will be extended to the right edge of the chart when price will draw new candles on chart. This is rectangle extende
The Expert Advisor is a risk manager helping users to control their trading. In the settings, it is possible to specify the parameters at which the risk manager force closes the opened trades and closes the terminal as well, if it is needed to prevent opening trades on emotions, which do not correspond to the trading strategy. Risk Manager settings Check limit to close   - check the equity limit Limit to close   - minimum account equity triggering loss prevention measures Check day limit to cl
HINN Lazy Trader
ALGOFLOW OÜ
5 (2)
Community, update news, feature discussions, complaints, suggestions, and first-line support are organized in a free Discord server . Use   Webmoney  to pay in crypto. Lazy Trader is your personal risk management assistant that independently finds the best market entries, manages positions, and helps you extract maximum profit from every trading idea! It monitors charts from M1 to W1 , finds optimal entry points based on your parameters, and manages trades without your involvement: -   Got a
Painel de negociação para negociação em 1 clique. Trabalhando com posições e pedidos! Negociar a partir do gráfico ou do teclado. Com nosso painel de negociação, você pode executar negociações com um único clique diretamente no gráfico e realizar operações de negociação 30 vezes mais rápido do que com o controle MetaTrader padrão. Cálculos automáticos de parâmetros e funções tornam a negociação mais rápida e conveniente para os traders. Dicas gráficas, rótulos informativos e informações completa
O Local Trade Copier EA é uma solução para traders individuais ou gerentes de contas que precisam executar sinais de negociação de fontes externas ou que precisam gerenciar várias contas ao mesmo tempo, sem a necessidade de uma conta MAM ou PAMM. Copia de até 8 contas mestras para contas escravas ilimitadas [ Guia de instalação | Guia de atualização | Solução de problemas | Perguntas frequentes | Todos os produtos ] 100% auto-hospedado Fácil de instalar e usar Nenhum instalador, arquivos de con
2025 happy new year -25% discount ($199 -> $149) Advanced trading tool: One click smart orders that execute under your conditions Developed by trader for trading community:  position size calculator (lot size), open position after price action, strategy builder, set and forget trading, mobile notifications... Risk Management -  Risk percentage position size calculator, gain percentage, target risk reward ratio, spread and commissions are included in calculations 7 Advanced order types  - Set a
Copiadora->Interação de interface conveniente e rápida, os usuários podem usá-la imediatamente       ->>>> Recomendado para uso em computadores Windows ou VPS Windows Funções básicas: A velocidade normal de interação do copy trading é inferior a 0,5s Detecte automaticamente fontes de sinal e exiba uma lista de contas de fontes de sinal Correspondência automática de símbolos, 95% dos símbolos de negociação comumente usados em diferentes plataformas (casos especiais, como sufixos diferentes) são c
Risk Manager for MT5
Sergey Batudayev
4.56 (16)
O Expert Advisor Risk Manager para MT5 é um programa muito importante e, na minha opinião, necessário para todos os traders. Com este Expert Advisor você poderá controlar o risco em sua conta de negociação. O controle de risco e lucro pode ser realizado tanto em termos monetários quanto em termos percentuais. Para que o Expert Advisor funcione, basta anexá-lo ao gráfico de pares de moedas e definir os valores de risco aceitáveis ​​na moeda de depósito ou em % do saldo atual. PROMO BUY 1 GET 2
Ultimate Trailing Stop EA MT5
BLAKE STEVEN RODGER
4.13 (8)
This EA Utility allows you to manage (with advanced filtering) unlimited open orders (manual or EA) with 16 trailing stop methods: fixed, percent, ATR Exit, Chandelier Exit, Moving Average, Candle High Low Exit, Bollinger Bands, Parabolic, Envelope, Fractal, Ichimoku Kijun-Sen, Alligator, Exit After X Minutes or Bars, RSI and Stochastic. The trailing stop can be either real or virtual, and you can exit fully or with a partial close percent on touch or bar close.  Moreover, you can add (override
Averager FULL
Vladislav Andruschenko
4.58 (12)
Exp-Averager   foi projetado para calcular a média de suas negociações que receberam um certo rebaixamento, abrindo negociações de média. O consultor pode abrir posições adicionais na tendência e contra a tendência! Inclui um trailing stop médio para uma série de posições! Eles estão aumentando e diminuindo o lote. Uma estratégia popular para trazer posições não lucrativas ao preço médio. Versão MT4 Descrição completa +DEMO +PDF Como comprar Como instalar     Como obter arquivos de log    
Mais do autor
This product can be used to synchronize multiple Charts, and each Chart can be set to a different sync mode. With this product you can better view and manipulate charts: different time frames for a single Symbol, the same time frame for multiple Symbols... and more. PS: The link below is the FreeDemo product, you can use it on EURUSD/XUAUSD/USDCNH symbol: https://www.mql5.com/en/market/product/38557 Feature: Chart settings  can be synchronized, including : background, indentation, size, etc. M
Do you think it's a bit cumbersome when you need to switch symbols or timeframes with mouse click? 1. What is this? This is a program that can switch symbols and timeframes with direction keys. Fast switching, very convenient, no mouse click required. For traders, one symbol with multi-timeframe charts are usually added,  you can change symbol on those charts easily. For multi-currency traders, different symbol charts are usually added, you can also change those timeframes easily. I wrote this p
1. What is this         Rising volatility and falling volatility are not the same, whether it is academic research or actual testing has shown this point.         The original ATR indicator is calculated by putting up and down fluctuations together. This indicator is to calculate separately the upward volatility and the downward volatility, which can better help you study the market. 2. Indicator description          There are two modes for the calculation of this indicator, as shown in the fo
Have you ever take a long time to watch a Symbol when the network link is not good ? Have you ever wait for a long time when you switch chart between different Symbols or different TimeFrames ? If you do long-term backtesting , Have you ever to be downloaded datas for a long time ? Yes, If there is no data in the system, those will happen.  1. What is this: Download all the Symbol data in Market Watch to the system. PS: This is not outputting data to Files. This Link go to Demo version: https:/
This product can be used to synchronize multiple Charts, and each Chart can be set to a different sync mode. With this product you can better view and manipulate charts: different time frames for a single Symbol, the same time frame for multiple Symbols, system indicators for single/multiple Symbols... and more. Feature: Chart settings can be synchronized, including : background, indentation, size, etc. Multiple Chart window start times  or end times can be synchronized. Multiple Chart time fr
I see that many tools in the market deal with Position and Order in the form of operation panels. Which is loaded into a Chart in the form of an EA. However, once the operator panel EA is loaded, no other EAs can be loaded. So, I wrote the one-click operation of Position and Order as a script, so you can load other EAs and easily complete one-click operation of Trade. 1. What is this: This is a one-click script to close position order. Now you can close position tickets at high speed, for examp
I see that many tools in the market deal with Position and Order in the form of operation panels. Which is loaded into a Chart in the form of an EA. However, once the operator panel EA is loaded, no other EAs can be loaded. So, I wrote the one-click operation of Position and Order as a script, so you can load other EAs and easily complete one-click operation of Trade. 1. What is this: This is a one-click script to delete the pending order . Now you can delete pending tickets at high speed, for
According to trading experience: Some symbols are easy to reverse on certain days, such as Monday, or afternoon, and so on. So comparing the current price with the corresponding historical moment price is valuable. If the price coordinate system uses a logarithmic price, you will get a lot of valuable information. 1. What is this? This program can convert the symbol price and add it to your Chart. You can compare it with your major chart. The DEMO version Link: https://www.mql5.com/en/market/pr
What is this: Violent trading: means sending a large number of orders to your brokerage server,  it can conduct a stress test of the trading. In this program you can run a variety of trading tests.  Now you can trade at high speed, For example 1000 orders in an instant. The Demo version's link:  https://www.mql5.com/en/market/product/38431/ Why to use: Whether manual trading or EA trading,  the status of the broker server is very important. So it is beneficial to conduct a trading stress test on
1. Why did I develop this series of indicators I found that most traders need to use multiple time frame indicators. They usually switch time frame to see indicators. However, once the timeframe is switched, you cannot see the  corresponding relationship  between  the price in the smaller timeframe  and  the indicator in the larger timeframe . For example: if your price chart is in H1 timeframe, you can see H4, D1 and W1 indicators in H1 timeframe Chart. This is more helpful for you to find th
Filtro:
[Excluído] 2019.02.21 09:31 
 

O usuário não deixou nenhum comentário para sua avaliação

[Excluído] 2019.02.21 09:29 
 

O usuário não deixou nenhum comentário para sua avaliação

Responder ao comentário
Versão 1.6 2020.06.06
recompiled for MT5 update.
Versão 1.5 2020.02.18
A large update, now you can change other chart.
//The following options are used to change other open charts:
input bool OtherOpenChart_Symbol = false; //Change symbol on other open chart?
input bool OtherOpenChart_TimeFrame = false; //Change timeframe on other open chart?
input int PermitCount = 0; //Just change the count of initially opened chart. 0 means all.

PS:
I must tell you, When switching between multi charts, the system will download the data, If your system doesn't have data, it will download the data and sometime will cause slowdowns. That is the limited of MT5/MT4 client.
Versão 1.4 2020.02.14
Change TurnOn parameter to :
bool TurnOn_UpDown=true; // Turn on the UP/DOWN key function to change Symbol.
bool TurnOn_LeftRight=true; // Turn on the LEFT/RIGHT key function to change TimeFrame.
Now, you can choose the change mode.
Versão 1.3 2020.01.31
add the parameter to turn on/off the directional key funcion.
Versão 1.2 2019.10.28
If you add this indicator more than once, the system will alert you.
Versão 1.1 2019.10.24
Hide the text, and move it to program description.