Pair chart nrp obs
- Indicadores
- Artem Kuzmin
- Versão: 1.1
- Atualizado: 25 abril 2022
- Ativações: 5
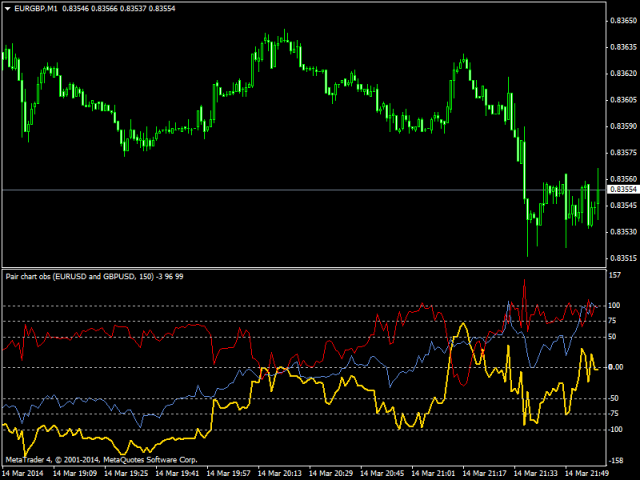
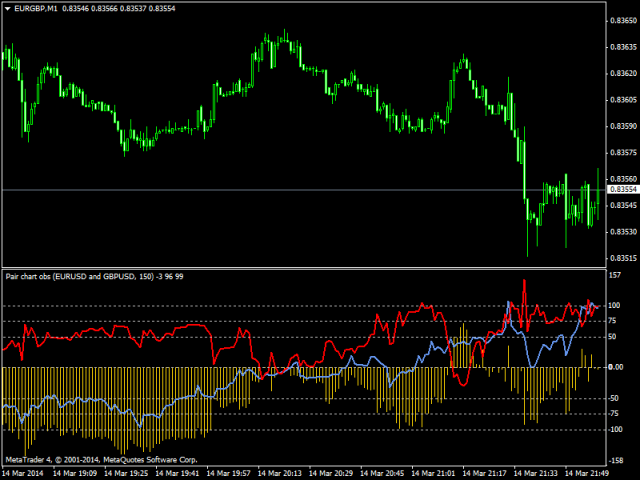
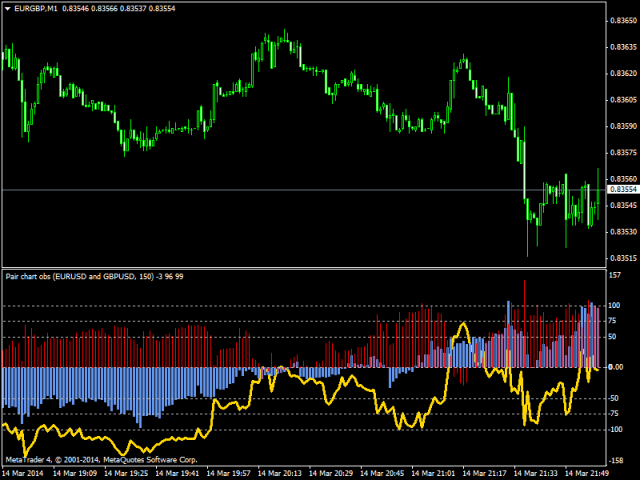
The indicator is based on pair trading methods. It is not redrawn unlike similar indicators.
Shows correlation between two selected instruments in percent for a predetermined period, and the positions of the instruments relative to each other.
Has a function for reverse display of any of the analyzed symbols - for instruments with negative correlation.
Can be drawn as a line or as a histogram.
Settings:
- Symb1 - first symbol name.
- Revers1 - reverse display of the first symbol.
- Symb2 - second symbol name.
- Revers2 - reverse display of the second symbol.
- ExtPeriod- calculation period in bars.
- Pair_Line_or_Histo - show correlation chart as a line or a histogram.
- Symb_Line_or_Histo - show price charts as a line or a histogram.

