Sensitive Price Levels
- Utilitários
- Marco Malguzz
- Versão: 1.0
- Ativações: 5
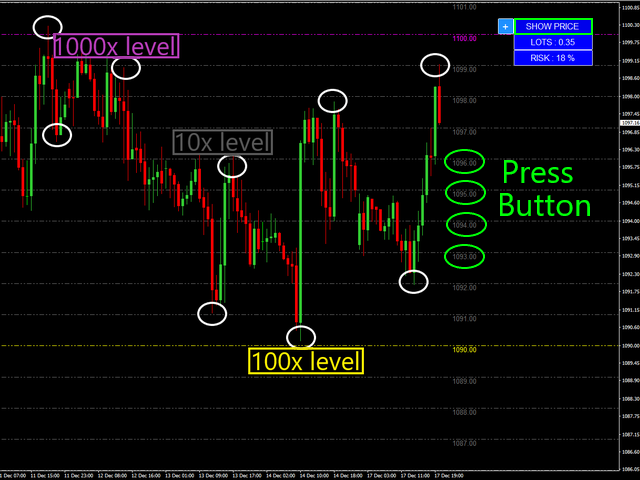
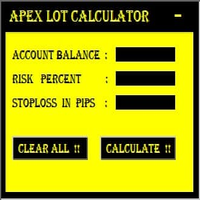
The Sensitive Price Level indicator (SPL) draws fixed horizontal levels on charts that allow seeing sensitive target prices, helping to find more accurate entry points to open or close your trades. It is a needful instrument to take a decision in trading activity and to give a clear orientation on charts. A simple control panel allows calculating operation costs and lots.
Features
1.Grid visualization
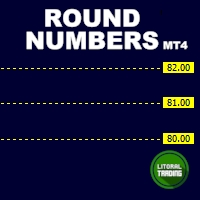
price levels multiple of 10X,100X,1000X, identified by colors:
- 10X : DIMGRAY dot lines.
- 100X : YELLOW dot lines.
- 1000X : MAGENTA dot lines.
Default colors and price multiples can be modified with the control panel.
You can show/hide line prices by pressing the SHOW PRICE button.
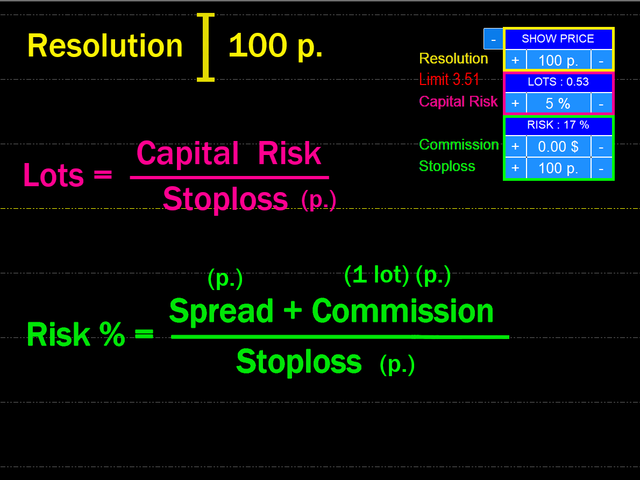
2. LOTS are calculated according to risk (expressed as the percentage of the capital) and stop loss (SL).
A message with maxim lots will appear if lots surpass the limit.
3. RISK represents the operation cost, including commissions, expressed as the percentage of the stop loss.
You can change risk/spread visualization by pressing the RISK button.
Button Parameters
1. Resolution - Grid resolution ( five choices).
2. Capital Risk – Manage your risk percentage.
3.Commission – Broker’s commission for operation (1 lot trade).
4. Stoploss – operation SL calculated in point.
Settings and Parameters
XValueButton : X button chart coordinate (default 200)
YValueButton : Y button chart coordinate (default 30)
FontSizeButton : button size (default 30)
FontSizeText : text size (default 3)
Resolution : grid resolution (default 100)
RiskPerc : capital risk operation (default 5)
Commission : broker’s commission (default 0)
Stoploss : stop loss operation (default 100)
Color10x : color line 10x (default DimGray)
Color100x : color line 100x (default Yellow)
Color1000x : color line 1000x (default Magenta)
NumLINE : number of lines drawn (default 300)
ColorButton : button color (default Blue)
ColorSetButton : second button color (default DodgerBlue)
ColorText : text color (default White)
ColorError : error text color (default Red)
For more inquiries please ask me in the Comments
CHANGE THE WAY TO LOOK CHARTS!
