• Visão global
  • Comentários
  • Discussão (4)
  • O que há de novo

Weiss Wave with Zigzag and several data

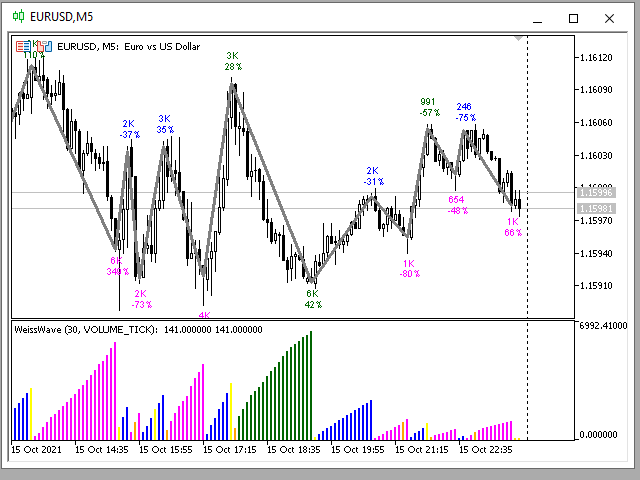
Weiss Wave com muitas funcionalidade e extremamente leve. O mesmo pode ser usado tanto no mercado brasileiro quanto no mercado exterior!


Voce poderá:

   - Analisar o volume do mercado pelos swings realizados!

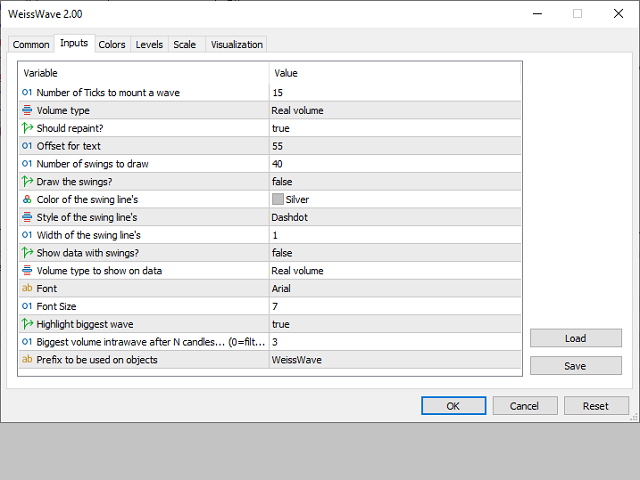
   - Definir a fonte dos dados apresentados no grafico, seu tamanho e cor! Ou simplesmente oculta essa informação!

   - Definir se quer mostrar ou não os swings no grafico e quantos swings! Alem de definir a cor da linha de tendencia, espessura e estilo da linha de tendencia!

   - Definir um volume nos dados apresentados diferente do que é usado no histograma.


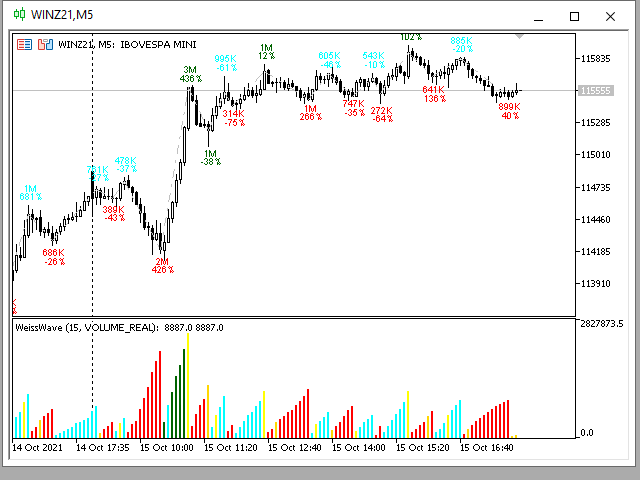
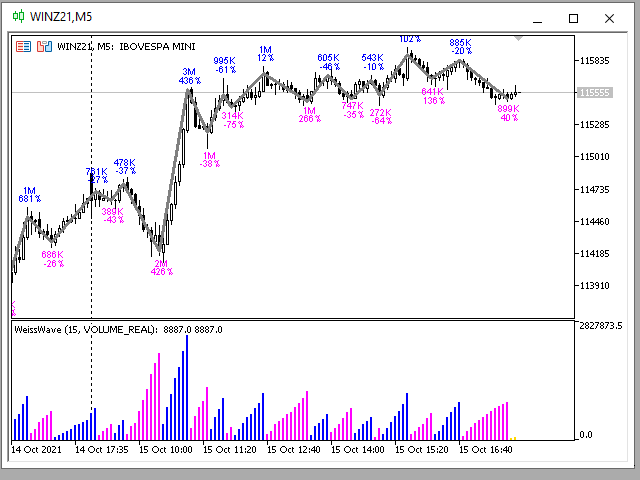
Os dados mostrados no grafico quando habilitados são:

    - Volume (conforme configuração!);

    - Percentagem de crescimento em relação a onda anterior do mesmo tipo;

    - Pontuação da onda alcançada de um fechamento ate o proximo!
Produtos recomendados
Supply and Demand Indicator + FREE Currency Strength Meter ADD-ON Looking for a powerful tool that can help you identify the most reactive zones in the forex market? Our supply and demand indicator for MetaTrader 4 and 5 is exactly what you need. With its advanced algorithms and real-time analysis, this indicator helps traders of all experience levels make informed trading decisions. The supply and demand indicator is a cutting-edge tool that helps traders identify areas where buyers and sellers
Weis Waves
Flavio Javier Jarabeck
2.83 (18)
The original author is David Weis, an expert in the Wyckoff Method. The Weis Wave is a modern adaptation of the 1930's Wyckoff Method, another expert in Tape Reading techniques and Chart Analysis. Weis Waves takes market volume and stacks it into waves according to price conditions giving the trader valuable insights about the market conditions. If you want to learn more about this subject you can find tons of videos in YouTube. Just look for "The Wickoff Method", "Weis Wave" and "Volume Spread
FREE
Description The indicator uses market profile theory to show the most relevant trading zones, on a daily basis. The zones to be shown are LVN (low volume nodes) and POC (point of control). An LVN zone is one which represents price areas with the least time or volume throughout the day. Typically, these areas indicate a supply or demand initiative, and in the future, they can turn into important breakout or retracement zones. A POC zone is one which represents price areas with the most time or vo
Crash 1000 Scalping Indicator for the Crash 1000 Deriv Synthetic Index. Introduction The Crash 1000 Scalping Indicator is a specialized tool designed for the Crash 1000 index on the Deriv Synthetic market. This indicator is particularly useful for scalping on the M1 timeframe, helping traders to identify precise entry and exit points for buy positions. It is designed to be non-repainting, providing clear signals with audible alerts and push notifications, and is compatible with mobile devices th
A nova versão torna este indicador uma ferramenta completa para estudo, análise e operação de padrões probabilísticos. Suas funções incluem: Monitor de porcentagem de múltiplos ativos no gráfico. Martingales configuráveis. Vinte e um padrões pré-configurados, incluindo padrões Mhi e C3. Um editor de padrões avançado para armazenar até 5 padrões personalizados. Modo Backtest para testar resultados com relatório de perdas. Filtro de tendência. Filtro de hits. Opção de Ciclos de Martingale. Vários
Waves PRO
Flavio Javier Jarabeck
For those who appreciate Richard Wyckoff approach for reading the markets, we at Minions Labs designed a tool derived - yes, derived, we put our own vision and sauce into this indicator - which we called Waves PRO . This indicator provides a ZigZag controlled by the market volatility (ATR) to build its legs, AND on each ZigZag leg, we present the vital data statistics about it. Simple and objective. This indicator is also derived from the great book called " The Secret Science of Price and Volum
Wapv Price and volume
Eduardo Da Costa Custodio Santos
O Indicador WAPV Price and Volume para MT5 faz parte do conjunto de ferramentas do (Wyckoff Academy Wave Market) e ( Wyckoff Academy Price and Volume). O Indicador WAPV Price and Volume para MT5 foi criado para facilitar a visualização da movimentação do volume  no gráfico de forma intuitiva. Com ele você pode observar os momentos de pico de volume e momentos em que o mercado não tem interesse profissional Identificar momentos que o Mercado esta se movimentando por inércia e não por moviment
Price Movement Classification Categorizes movements as significant/insignificant Tracks both direction and magnitude Considers volume in analysis Market Condition Identification Buying Pressure: More significant green candles Selling Pressure: More significant red candles Neutral Conditions: Balanced or low volatility Visual Representation Boxes show trading ranges Labels provide detailed statistics Color transitions mark significant changes Use Cases Market Analysis Identify hourly trading pat
Power of Three ICT Indicator in Smart Money Concept MT5 The Power of Three Indicator is an advanced trading tool available for MetaTrader 5 , designed to highlight three crucial market phases: Accumulation, Manipulation, and Distribution , which align with Smart Money trading principles. These phases represent distinct price behaviors, guiding traders in analyzing market stability, liquidity movements, and directional trends. The indicator marks accumulation zones with red boxes, while manipulat
WAPV Weis Wave Chart Forex
Eduardo Da Costa Custodio Santos
O Weis Wave Chart Forex para MT 5 é um um indicador de Preço e Volume. A leitura de Preço e Volume foi amplamente divulgada através de Richard Demille Wyckoff com base nas três leis criadas por ele: Oferta e Demanda, Causa e Efeito e Esforço x Resultado. Em 1900 R.Wyckoff já utilizava o gráfico de Ondas em suas análises. Muitos anos depois, por volta de 1990 , David Weis Automatizou o gráfico de ondas de R. Wyckoff e hoje nós trazemos a evolução do gráfico de ondas de David Weis. Ele mostra
- This is the exact conversion from TradingView: "Support/Resistance" By "BarsStallone". - This indicator lets you read the buffers for R/S values. - This is a non-repaint and light processing load indicator. - This is not a multi time frame indicator If you want the multi time frame version you should create a personal order and I deliver two files that you need them both to have the multi time frame indicator running on your system. - The MT4 version of the indicator is not light load from pr
Introducing the Order Block Indicator , the pinnacle of trading technology. Order blocks, the large cluster of buy or sell orders placed by institutional traders, significantly influence market direction. They form at critical price levels and can act as robust support and resistance zones. Our cutting-edge indicator allows you to harness the full potential of these influential market dynamics, providing a never-before-seen level of precision and customization. Here's why this tool stands apart:
The Penta-O is a 6-point retracement harmonacci pattern which usually precedes big market movements. Penta-O patterns can expand and repaint quite a bit. To make things easier this indicator implements a twist: it waits for a donchian breakout in the right direction before signaling the trade. The end result is an otherwise repainting indicator with a very reliable trading signal. The donchian breakout period is entered as an input. [ Installation Guide | Update Guide | Troubleshooting | FAQ | A
No Demand No Supply MT5
Trade The Volume Waves Single Member P.C.
No Demand No Supply   This indicator identifies   No Demand –No Supply candles to your chart and plots volume bars colored according to the signal. It can be applied to all timeframes or to a specific one only. It can also be used as regular volume indicator  with exceptional future of WEIGHTED VOLUME. Furthermore is has an alert notification, sound and email when a signals occurs. The indicator does not repaint but the alert will come on two candles back due to the definition of No Demand No Su
Best SAR MT5
Ashkan Hazegh Nikrou
4.33 (3)
Descrição :  estamos felizes em apresentar nosso novo indicador gratuito baseado em um dos indicadores profissionais e populares no mercado forex (PSAR) este indicador é uma nova modificação no indicador SAR parabólico original, no indicador pro SAR você pode ver o cruzamento entre os pontos e o gráfico de preços, este crossover não é sinal, mas fala sobre o potencial de fim de movimento, você pode começar a comprar pelo novo ponto azul e colocar o stop loss um atr antes do primeiro ponto azul
FREE
B Xtrender
Yashar Seyyedin
To download MT4 version please click here . This is the exact conversion from TradingView: "B-Xtrender" By "QuantTherapy". - It is an oscillator based on RSI and multiple layers of moving averages. -   It is a two in one indicator to calculate overbought and oversold zones for different RSI settings. -  This indicator lets you read the buffers for all data on the window. - This is a non-repaint and light processing load indicator. - You can message in private chat for further changes you need.
PivotWave
Jeffrey Quiatchon
Introducing PivotWave – your ultimate trading companion that redefines precision and market analysis. Designed with traders in mind, PivotWave is more than just an indicator; it’s a powerful tool that captures the pulse of the market, identifying key turning points and trends with pinpoint accuracy. PivotWave leverages advanced algorithms to provide clear visual signals for optimal entry and exit points, making it easier for traders to navigate volatile market conditions. Whether you are a begin
To download MT4 version please click here . This is the exact conversion from TradingView: "WaveTrend [LazyBear]" By "zeusuk3". One of the coolest indicators out there to detect overbought and oversold zones. It can be used as a part of more complicated strategy and for confirming a potential trade setup. There are buffers to use in EAs also. The indicator is loaded light and non-repaint. - You can message in private chat for further changes you need. Thanks for downloading 
Follow The Line MT5
Oliver Gideon Amofa Appiah
4.52 (29)
This indicator obeys the popular maxim that: "THE TREND IS YOUR FRIEND" It paints a GREEN line for BUY and also paints a RED line for SELL. (you can change the colors). It gives alarms and alerts of all kinds. IT DOES NOT REPAINT and can be used for all currency pairs and timeframes. Yes, as easy and simple as that. Even a newbie can use it to make great and reliable trades. NB: For best results, get my other premium indicators for more powerful and reliable signals. Get them here: https://www.m
FREE
Volume Delta Candle
Muhammad Muzaffar Hussan
Volume Delta Candles: A Comprehensive Tool for In-Depth Trading Analysis Unlock a seamless way to interpret trading experience within each candle. With Volume Delta Candles, there's no need for additional volume indicators—everything you need is built in. This advanced tool utilizes lower timeframes or live market data to present the percentage of buying versus selling volume within each candle as an intuitive color-coded bar. Before diving in, ensure you’re familiar with Volume and Volume Delta
Volumes Direction MT5
William Oswaldo Mayorga Urduy
VOLUMES DIRECTION MT5 Normalmente, o indicador de volume tem uma mudança de cor padrão quando o volume atual é maior do que o anterior, é importante, mas não muito útil. Por este motivo, este indicador foi criado que além do volume normal, quando a vela é de alta ou de baixa, ela os pinta com uma cor diferente, por padrão é azul para alta e vermelho para baixa, mas essas cores podem ser personalizadas para o Gosto do comerciante. Não se esqueça de verificar meus outros indicadores que o aj
Mini Chart Indicators
Flavio Javier Jarabeck
The Metatrader 5 has a hidden jewel called Chart Object, mostly unknown to the common users and hidden in a sub-menu within the platform. Called Mini Chart, this object is a miniature instance of a big/normal chart that could be added/attached to any normal chart, this way the Mini Chart will be bound to the main Chart in a very minimalist way saving a precious amount of real state on your screen. If you don't know the Mini Chart, give it a try - see the video and screenshots below. This is a gr
Value Chart Candlesticks
Flavio Javier Jarabeck
4.73 (11)
The idea of a Value Chart indicator was presented in the very good book I read back in 2020 , " Dynamic Trading Indicators: Winning with Value Charts and Price Action Profile ", from the authors Mark Helweg and David Stendahl. The idea is simple and the result is pure genius: Present candlestick Price analysis in a detrended way! HOW TO READ THIS INDICATOR Look for Overbought and Oversold levels. Of course, you will need to test the settings a lot to find the "correct" one for your approach. It
FREE
Range Directional Force Indicator – Designed for You to Optimize! The Range Directional Force Indicator is a cutting-edge tool designed to empower traders by visualizing market dynamics and directional strength. Built to offer insights into market trends and reversals, this indicator is an invaluable asset for traders seeking precision in their strategies. However, it is important to note that this indicator is not optimized , leaving room for you to tailor it to your unique trading preferenc
FlowVol AllinOne
Thalles Nascimento De Carvalho
FlowVol All-in-One: A Completa Análise de Fluxo com DOM, VSA e Times and Sales PRONTO PARA ELEVAR SUA ANÁLISE DE FLUXO DE ORDENS NO MT5? O FlowVol All-in-One é a ferramenta definitiva para traders de fluxo de ordens, combinando as três principais técnicas de análise de volume (DOM, VSA e Times and Sales) em um único indicador poderoso. É importante ter acesso ao book de ofertas da corretora para utilizar todo o potencial desta ferramenta de fluxo . Ideal para scalpers e traders de curto pr
The Accumulation / Distribution is an indicator which was essentially designed to measure underlying supply and demand. It accomplishes this by trying to determine whether traders are actually accumulating (buying) or distributing (selling). This indicator should be more accurate than other default MT5 AD indicator for measuring buy/sell pressure by volume, identifying trend change through divergence and calculating Accumulation/Distribution (A/D) level. Application: - Buy/sell pressure: above
The Antique Trend Indicator is a revolutionary trend trading and filtering solution with all the important features of a trend tool built into one tool! The Antique Trend indicator is good for any trader, suitable for any trader both for Forex and binary options. There is no need to configure anything, everything has been perfected by time and experience, it works great during flats and trends. The Antique Trend indicator is a tool for technical analysis of financial markets, reflecting curren
Was: $249  Now: $149   Market Profile defines a number of day types that can help the trader to determine market behaviour. A key feature is the Value Area, representing the range of price action where 70% of trading took place. Understanding the Value Area can give traders valuable insight into market direction and establish the higher odds trade. It is an excellent addition to any system you may be using. Inspired by Jim Dalton’s book “Mind Over Markets”, this indicator is designed to suit the
Product overview  The HPL (High Probability Levels) indicator is a cutting-edge trading tool designed to identify high-probability levels in the market using imbalances. By leveraging the concept of imbalances, HPL provides traders with precise insights into potential market reversals and continuations, enhancing trading accuracy and decision-making. Key features  1. Imbalance detection : HPL automatically identifies and marks imbalances on the chart, highlighting areas where the market may seek
Flow Bookmap
Thalles Nascimento De Carvalho
Flow Bookmap: Visualize o Fluxo de Mercado e Proteja Seu Operacional ️ QUER DOMINAR O MERCADO COM INFORMAÇÕES PRECISAS SOBRE COMPRADORES E VENDEDORES? O Flow Bookmap é a ferramenta definitiva para traders que buscam entender o comportamento do mercado em profundidade. Ele transforma os dados do fluxo de ordens em uma interface intuitiva no gráfico do MT5, destacando regiões de interesse crítico para decisões rápidas e seguras. Como Funciona? O Flow Bookmap interpreta a interação entre
Os compradores deste produto também adquirem
Golden Trend Indicator MT5
Noha Mohamed Fathy Younes Badr
4.88 (16)
Golden Trend indicator  is The best indicator for predicting trend movement this indicator never lags and never repaints and never back paints    and give  arrow buy and sell    before the candle appear  and it will help you and  will make your trading decisions clearer its work on all currencies and  gold and crypto and all time frame This unique  indicator uses very secret algorithms to catch the  trends, so you can trade using this indicator and see the trend clear on charts  manual guide and
FX Volume MT5
Daniel Stein
4.82 (17)
FX Volume: Vivencie o Verdadeiro Sentimento de Mercado sob a Perspectiva de um Corretor Visão Geral Rápida Quer aprimorar sua abordagem de trading? FX Volume fornece insights em tempo real sobre como traders de varejo e corretores estão posicionados—bem antes de relatórios atrasados como o COT. Seja para buscar ganhos consistentes ou simplesmente ter uma vantagem mais clara no mercado, FX Volume ajuda você a detectar grandes desequilíbrios, confirmar rompimentos e aperfeiçoar sua gestão de ris
CBT Quantum Maverick Sistema de Negociação de Opções Binárias de Alta Eficiência O CBT Quantum Maverick é um sistema de opções binárias de alto desempenho, projetado para traders que buscam precisão, simplicidade e um enfoque disciplinado. Não exige personalização: o sistema está otimizado para resultados eficazes desde o início. Basta seguir os sinais, que podem ser dominados com um pouco de prática. Principais características: Precisão nos sinais: Sinais baseados na próxima vela, utilizando
TPSproTREND PrO MT5
Roman Podpora
4.69 (16)
TPSpro TREND PRO  - is a trend indicator that automatically analyzes the market and provides information about the trend and each of its changes, as well as giving signals for entering trades without redrawing! The indicator uses each candle, analyzing them separately. referring to different impulses - up or down impulse. Exact entry points into transactions for currencies, crypto, metals, stocks, indices!  ИНСТРУКЦИЯ RUS         INSTRUCTIONS  ENG       R ecommended to use with an indicator   -
Este é um indicador para MT5 que fornece sinais precisos para entrar em uma negociação sem redesenhar. Ele pode ser aplicado a qualquer ativo financeiro: forex, criptomoedas, metais, ações, índices. Ele fornecerá estimativas bastante precisas e informará quando é melhor abrir e fechar um negócio. Assista o vídeo (6:22) com um exemplo de processamento de apenas um sinal que compensou o indicador! A maioria dos traders melhora seus resultados de negociação durante a primeira semana de negociação c
Este painel mostra os últimos   padrões harmónicos   disponíveis para os símbolos seleccionados, pelo que poupará tempo e será mais eficiente /   versão MT4 . Indicador gratuito:   Basic Harmonic Pattern Colunas do indicador Symbol :   aparecem os símbolos seleccionados Trend :   de alta ou de baixa Pattern :   tipo de padrão (gartley, borboleta, morcego, caranguejo, tubarão, cifra ou ABCD) Entry :   preço de entrada SL:   preço de paragem de perda TP1:   preço do 1º take profit TP2:   preço
Matrix Arrow Indicator MT5
Juvenille Emperor Limited
5 (13)
O   Matrix Arrow Indicator MT5   é uma tendência única 10 em 1 seguindo um indicador multi-timeframe   100% sem repintura   que pode ser usado em todos os símbolos/instrumentos:   forex ,   commodities ,   criptomoedas ,   índices ,   ações .  O  Matrix Arrow Indicator MT5  determinará a tendência atual em seus estágios iniciais, reunindo informações e dados de até 10 indicadores padrão, que são: Índice de movimento direcional médio (ADX) Índice de canal de commodities (CCI) Velas clássicas de
TPSpro RFI Levels MT5
Roman Podpora
4.53 (19)
INSTRUÇÕES         Russo   -        ENG       R   ecomendado para uso com um indicador       -       TPSpro   TREND PRO -   Versão MT4         Um elemento-chave na negociação são as zonas ou níveis a partir dos quais as decisões de comprar ou vender um instrumento de negociação são tomadas. Apesar das tentativas dos principais participantes de esconder sua presença no mercado, eles inevitavelmente deixam rastros. Nossa tarefa era aprender como identificar esses rastros e interpretá-los corretame
Gartley Hunter Multi
Siarhei Vashchylka
5 (9)
Gartley Hunter Multi - An indicator for searching for harmonic patterns simultaneously on dozens of trading instruments and on all possible timeframes. Manual (Be sure to read before purchasing) | Version for MT4 Advantages 1. Patterns: Gartley, Butterfly, Shark, Crab. Bat, Alternate Bat, Deep Crab, Cypher 2. Simultaneous search for patterns on dozens of trading instruments and on all possible timeframes 3. Search for patterns of all possible sizes. From the smallest to the largest 4. All fou
Bill Williams Advanced
Siarhei Vashchylka
5 (9)
Bill Williams Advanced is designed for automatic chart analysis using Bill Williams' "Profitunity" system. The indicator analyzes four timeframes at once. Manual (Be sure to read before purchasing) Advantages 1. Automatically analyzes the chart using the "Profitunity" system of Bill Williams. The found signals are placed in a table in the corner of the screen. 2. Equipped with a trend filter based on the Alligator indicator. Most of the system signals are recommended to be used only according t
RelicusRoad Pro MT5
Relicus LLC
4.78 (18)
Agora US $ 147 (aumentando para US $ 499 após algumas atualizações) - Contas ilimitadas (PCs ou Macs) Manual do usuário do RelicusRoad + vídeos de treinamento + acesso ao grupo de discórdia privado + status VIP UMA NOVA FORMA DE OLHAR PARA O MERCADO O RelicusRoad é o indicador de negociação mais poderoso do mundo para forex, futuros, criptomoedas, ações e índices, oferecendo aos traders todas as informações e ferramentas necessárias para se manterem rentáveis. Fornecemos análises técnicas e
FxaccurateLS
Shiv Raj Kumawat
WHY IS OUR FXACCCURATE LS MT5 THE PROFITABLE ? PROTECT YOUR CAPITAL WITH RISK MANAGEMENT Gives entry, stop and target levels from time to time. It finds Trading opportunities by analyzing what the price is doing during established trends. POWERFUL INDICATOR FOR A RELIABLE STRATEGIES We have made these indicators with a lot of years of hard work. It is made at a very advanced level. Established trends provide dozens of trading opportunities, but most trend indicators completely ignore them! The
Quantum TrendPulse
Bogdan Ion Puscasu
5 (13)
Apresentando   Quantum TrendPulse   , a ferramenta de negociação definitiva que combina o poder do   SuperTrend   ,   RSI   e   Stochastic   em um indicador abrangente para maximizar seu potencial de negociação. Projetado para traders que buscam precisão e eficiência, este indicador ajuda você a identificar tendências de mercado, mudanças de momentum e pontos de entrada e saída ideais com confiança. Principais características: Integração SuperTrend:   siga facilmente a tendência predominante do
Atomic Analyst MT5
Issam Kassas
4.32 (19)
Primeiramente, vale ressaltar que este Indicador de Negociação não repinta, não redesenha e não apresenta atrasos, tornando-o ideal tanto para negociação manual quanto automatizada. Manual do utilizador: configurações, entradas e estratégia. O Analista Atômico é um Indicador de Ação de Preço PA que utiliza a força e o momentum do preço para encontrar uma vantagem melhor no mercado. Equipado com filtros avançados que ajudam a remover ruídos e sinais falsos, e aumentam o potencial de negociação.
O Indicador de Quadrados de Gann é uma poderosa ferramenta de análise de mercado baseada no artigo "Fórmula Matemática para Previsões de Mercado" escrito por W.D. Gann, que se baseia em conceitos matemáticos para análise. Ele incorpora elementos das técnicas de Gann relacionadas com os quadrados de 144, 90 e 52, bem como o quadrado de 9. Além disso, inclui o método do  sobre como combinar o quadrado de 9 com canais e padrões de estrela. Manual do Usuário e Modo de Uso: Antes de usar este indicad
BookMap HeatMap
Roberto Spadim
1 (2)
This Indicator creates a heatmap based on depth of market of the current symbol or another symbol. Other symbol is useful when you trade futures market and a contract has 'mini' and 'full' split. For example, in Brazil (B3 - BMF&Bovespa), WDO and DOL are future Forex contract of BRL/USD (where 1 DOL = 5 WDO) and big banks work mostly with DOL (where liquidity is important). Please use with M1 timeframe , objects are too small to be displayed at higher timeframes (MT5 limit). The number of level
Berma Bands
Muhammad Elbermawi
5 (3)
O indicador Berma Bands (BBs) é uma ferramenta valiosa para traders que buscam identificar e capitalizar tendências de mercado. Ao analisar a relação entre o preço e os BBs, os traders podem discernir se um mercado está em uma fase de tendência ou de variação. Visite o [ Blog Berma Home ] para saber mais. As Bandas de Berma são compostas por três linhas distintas: a Banda de Berma Superior, a Banda de Berma Média e a Banda de Berma Inferior. Essas linhas são plotadas em torno do preço, criando u
Apresentando       Quantum Breakout PRO   , o inovador Indicador MQL5 que está transformando a maneira como você negocia Breakout Zones! Desenvolvido por uma equipe de traders experientes com experiência comercial de mais de 13 anos,       Quantum Breakout PRO       foi projetado para impulsionar sua jornada comercial a novos patamares com sua estratégia de zona de fuga inovadora e dinâmica. O Quantum Breakout Indicator lhe dará setas de sinal em zonas de breakout com 5 zonas-alvo de lucro e su
Easy Breakout MT5
Mohamed Hassan
5 (3)
After your purchase, feel free to contact me for more details on how to receive a bonus indicator called VFI, which pairs perfectly with Easy Breakout for enhanced confluence!     Easy Breakout MT5   is a powerful price action trading system built on one of the most popular and widely trusted strategies among traders: the   Breakout strategy ! This indicator delivers crystal-clear Buy and Sell signals based on breakouts from key support and resistance zones. Unlike typical breakout indicators
Quantum Heiken Ashi PRO MT5
Bogdan Ion Puscasu
4.44 (9)
Apresentando o   Quantum Heiken Ashi PRO Projetadas para fornecer informações claras sobre as tendências do mercado, as velas Heiken Ashi são conhecidas por sua capacidade de filtrar o ruído e eliminar sinais falsos. Diga adeus às confusas flutuações de preços e olá para uma representação gráfica mais suave e confiável. O que torna o Quantum Heiken Ashi PRO verdadeiramente único é sua fórmula inovadora, que transforma os dados tradicionais de velas em barras coloridas fáceis de ler. As barras ve
Advanced Supply Demand MT5
Bernhard Schweigert
4.5 (14)
Atualmente com 33% de desconto! A melhor solução para qualquer Trader Novato ou especialista! Este indicador é uma ferramenta de negociação exclusiva, de alta qualidade e acessível porque incorporamos uma série de recursos proprietários e uma nova fórmula. Com esta atualização, você poderá mostrar fusos horários duplos. Você não só será capaz de mostrar um TF mais alto, mas também mostrar ambos, o TF do gráfico, MAIS o TF mais alto: MOSTRANDO ZONAS ANINHADAS. Todos os traders de Oferta e Demanda
Extreme  Breakout Signal   is a trading strategy based on price breaking through key support or resistance levels. It indicates potential trend shifts, allowing traders to capture new upward or downward movements. Parameter extreme radius:   extreme radius( Different parameters can be set for different periods ) Key Principles Support & Resistance : Prices often reverse near these levels; breaking them may signal a new trend. Confirmation : Use volume or other indicators to verify the breakout's
Golden Spikes Detector
Batsirayi L Marango
3.25 (4)
Golden Spikes Detector Este indicador é baseado em uma estratégia avançada principalmente para picos de negociação nos índices Boom e Crash. Algoritmos complexos foram implementados para detectar apenas entradas de alta probabilidade. Ele alerta sobre possíveis entradas de compra e venda. Para negociar picos na corretora Deriv ou Binária, receba apenas os alertas Buy Boom e Sell Cash. Ele foi otimizado para ser carregado em um período de 5 minutos, embora a análise de vários períodos de tempo se
KT Renko Patterns MT5
KEENBASE SOFTWARE SOLUTIONS
KT Renko Patterns scans the Renko chart brick by brick to find some famous chart patterns that are frequently used by traders across the various financial markets. Compared to the time-based charts, patterns based trading is easier and more evident on Renko charts due to their uncluttered appearance. KT Renko Patterns features multiple Renko patterns, and many of these patterns are extensively explained in the book titled Profitable Trading with Renko Charts by Prashant Shah. A 100% automated
Primeiramente, vale ressaltar que este Sistema de Trading é um Indicador Não Repintado, Não Redesenho e Não Atrasado, o que o torna ideal tanto para o trading manual quanto para o automatizado. Curso online, manual e download de predefinições. O "Sistema de Trading Inteligente MT5" é uma solução completa de trading projetada para traders novos e experientes. Ele combina mais de 10 indicadores premium e apresenta mais de 7 estratégias de trading robustas, tornando-o uma escolha versátil para dive
Royal Scalping Indicator M5
Vahidreza Heidar Gholami
5 (6)
Royal Scalping Indicator is an advanced price adaptive indicator designed to generate high-quality trading signals. Built-in multi-timeframe and multi-currency capabilities make it even more powerful to have configurations based on different symbols and timeframes. This indicator is perfect for scalp trades as well as swing trades. Royal Scalping is not just an indicator, but a trading strategy itself. Features Price Adaptive Trend Detector Algorithm Multi-Timeframe and Multi-Currency Trend Low
Monster Harmonics Indicator is a harmonic pattern indicator. It recognizes Gartley, Bat, Crab, Butterfly, Cypher, White Swan, Black Swan, Shark and AB=CD patterns. Projected patterns that are not yet completed are recognized, too. Monster even shows the PRZ (Potential Reversal Zone). Users can add their own user defined patterns to Monster. Besides the current pattern, Monster also shows all patterns in the symbols history. Monster will provide alerts for developing patterns. Introduced by H.M.
SEE THE TREND ON EVERY TIME FRAME. INTELLIGENT INDICATOR READS PRICE ACTION TO SPOT TRUE MARKET CYCLES AND TREND. This advanced multi-currency and multi-time frame indicator,   reads trend in real-time   so you always know the trends of the markets   you want to trade.  ​Trend-Viewer Pro has been specifically designed to read the trend of   every time frame   and   every market , simultaneously, making it much easier for you to find markets with   time frame correlation , so you can focus on th
KT Momentum Arrows MT5
KEENBASE SOFTWARE SOLUTIONS
5 (2)
KT Momentum Arrows Indicator is based on a momentary breakout which is calculated using the bands deviation and emerging volatility in a certain direction. A buy signal is generated when the price closes above the upper band and a sell signal is generated when the price closes below the lower band. A magnitude coefficient is used as the input which affects the band deviation and volatility at the same time. The coefficient value should be carefully selected and analyzed based on the instrument a
Gartley Hunter MT5
Siarhei Vashchylka
5 (13)
Gartley Hunter - An indicator for searching for harmonic patterns (Gartley patterns) and their projections. The indicator is equipped with a system of alerts and push notifications. Manual (Be sure to read before purchasing) | Version for MT4 Advantages 1. 12 harmonic patterns: 7 classical and 5 exotic. New patterns will be added as the indicator develops. 2. Constant automatic search for harmonic patterns. The indicator is capable of finding from the smallest to the largest patterns. 3. Automa
Mais do autor
Prior Cote
Ricardo Rodrigues Lucca
Prior Cote - Saliente pontos interessantes do dia anterior Coloca linhas automaticas em pontos que voce decidir do dia anterior: máxima, mínima, fechamento, aberto, ponto medio. Além disso, é possivel decidir um distânciamento em percentual da referência que voce escolheu e um valor máximo em percentual. Dessa maneira, ele faz a linha do zero em uma cor que voce escolheu e vai se distanciando para ambos os lados ate atingir o valor máximo que o usuario escolheu. As linhas para cima (ou positivas
FREE
Narrow Range Timeframe
Ricardo Rodrigues Lucca
4.5 (2)
Esse indicador utiliza o conceito NR7. Esse conceito diz que se a setima vela for a de menor range, isto é, menor diferença entre máxima e mínima de todas as 7 velas. O indicador marca essa vela com dois marcadores e fica aguardando o rompimento do range composto das 7 velas, isto é, a maior máxima entre as 7 velas anteriores e menor mínima entre as 7 velas anteriores. O indicador é chamado "Timeframe" porque digamos que tenhamos uma sessão de negociação que dura 9 horas, e temos a terceira vela
FREE
Moving Ratio
Ricardo Rodrigues Lucca
"Moving Ratio Candle" serve para verificar o quão distante uma vela de um ponto de pressão teórico. Além disso, temos dois limitadores o primeiro pela média e o segundo pela mediana. O desenho do indicador é em formato de barra e a linha que cruza cortando a barra da esquerda para direita é a partir do calculo do fechamento para ambos os lados. O resto segue um calculo mais padrão. O mesmo poderia ser feito como linha, mas eu quero saber o comportamento desse indicador em relação a vela de preço
FREE
Stormer RSI 2
Ricardo Rodrigues Lucca
A estratégia do robô é baseada na ensinada pelo Stormer. Segue a explicação da mesma: Quando o RSI fica abaixo de 25, compramos nos últimos 15 minutos do pregão a mercado e o stop de ganho fica na maior máxima dos dois últimos dias. Sendo o mesmo movimentado até ser atingido ou ir para baixo da entrada (quando encerramos a posição a mercado, independente de termos atingido o número máximo de dias). Como utilizo? Configura o Lote e configure a hora e minuto que o EA deve operar. O mesmo só se
Filtro:
Sem comentários
Responder ao comentário
Versão 2.0 2021.10.16
* Removido coloração da fonte, a cor usada é a mesma do histograma;
* Removido pontos dos dados resumidos, para deixar mais limpo o grafico;
* Destacar a maior onda do dia (a cor dela é a 4);
* Destacar a vela com maior volume em uma onda dado que temos N velas (a cor pode ser a 5 ou 6);