• Visão global
  • Comentários
  • Discussão (8)
  • O que há de novo

Time And Sales Layout

Time And Sales Layout indicator shows traded buy and sell volumes right on the chart. It provides a graphical representation of most important events in the time and sales table.

The indicator downloads and processes a history of real trade ticks. Depending from selected depth of history, the process may take quite some time. During history processing the indicator displays a comment with progress percentage.

When the history is processed, the indicator starts analyzing ticks in real time. The last bar data is updated.

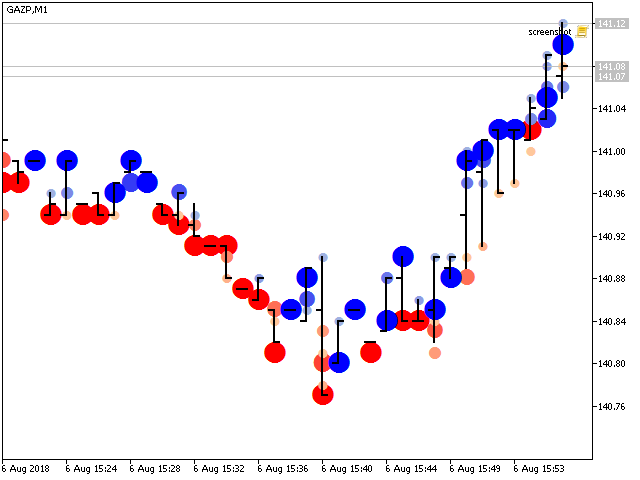
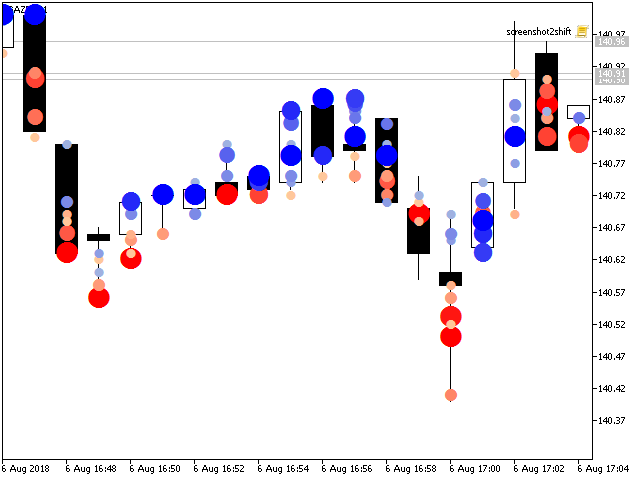
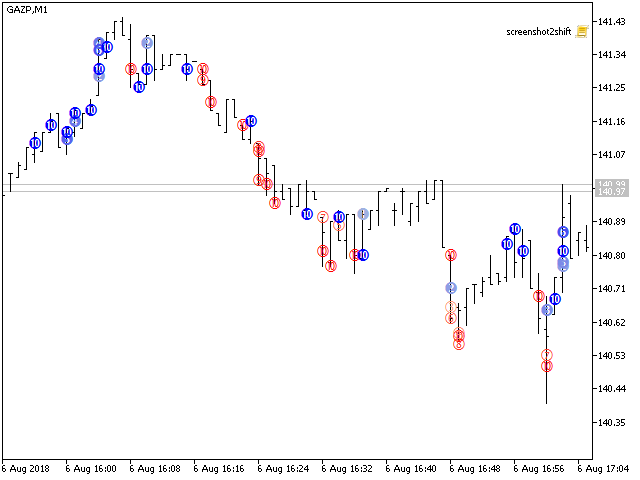
The indicator displays color marks where most significant volumes were traded, for buys and sells separately.

The indicator is primarily intended for intraday use, minute timeframes are recommended. 


Parameters

  • ShowHistoryFrom - a date to start tick history analysis, by default - 0, which means last day; please note that 0 for datetime type is shown in MetaTrader's UI as 1970.01.01 00:00:00 by design;
  • Threshold - minimal volume of a single trade to take into account; use this parameter to filter out small trades and show only large ones;
  • CharCode - a character code to display indicator's marks; it can be any symbol from the Wingdings font or -1; by default -1, which means that numeric bullets with values from 1 to 10 are displayed, denoting relative volume size;
  • CharSize - defines the size of marks ("width" of indicator buffers); by default -1 (which means that the sizes vary proportinal to volumes), can be a value from 1 to 5;
  • ColorPositive, ColorPositiveSmall - color gradient for buy volumes;
  • ColorNegative, ColorNegativeSmall - color gradient for sell volumes;


Produtos recomendados
BoxChart MT5
Evgeny Shevtsov
5 (7)
The market is unfair if only because 10% of participants manage 90% of funds. An ordinary trader has slim changes to stand against these "vultures". This problem can be solved. You just need to be among these 10%, learn to predict their intentions and move with them. Volume is the only preemptive factor that faultlessly works on any timeframe and symbol. First, the volume appears and is accumulated, and only then the price moves. The price moves from one volume to another. Areas of volume accumu
Was: $249  Now: $149   Market Profile defines a number of day types that can help the trader to determine market behaviour. A key feature is the Value Area, representing the range of price action where 70% of trading took place. Understanding the Value Area can give traders valuable insight into market direction and establish the higher odds trade. It is an excellent addition to any system you may be using. Inspired by Jim Dalton’s book “Mind Over Markets”, this indicator is designed to suit the
To download MT4 version please click here . - This is the exact conversion from TradingView: "Trend Direction Force Index - TDFI [wm]" By "causecelebre". - The screenshot shows similar results from tradingview and Metatrader when tested on ICMarkets on both platforms. - This indicator uses multiple levels of averaging to detect trend strength. - You can optimize filter low and filter high levels to achieve best results. - You have access to buffers to use in EAs. - This is a light-load processin
O indicador cria cotações atuais, que podem ser comparadas com as históricas e, com base nisso, fazer uma previsão do movimento dos preços. O indicador possui um campo de texto para navegação rápida até a data desejada. Opções: Símbolo - seleção do símbolo que o indicador exibirá; SymbolPeriod - seleção do período do qual o indicador coletará dados; IndicatorColor - cor do indicador; HorisontalShift - deslocamento das cotações desenhadas pelo indicador pelo número especificado de barras; I
Order Book, known also as Market Book, market depth, Level 2, - is a dynamically updated table with current volumes of orders to buy and to sell specific financial instument at price levels near Bid and Ask. MetaTrader 5 provides the means for receiving market book from your broker, but in real time only, without access to its history. The indicator OrderBook Cumulative Indicator accumulates market book data online and visualizes them on the chart. In addition, the indicator can show the market
Desenvolvido pela Smart Trader - Smart Reversion Pattern é um indicador capaz de identificar padrões de reversão , tanto reversões de alta quanto reversões de baixa. Ele foi desenhado para fornecer um rápido conhecimento dos padrões, em tempo real. Também pensamos na parte de interface, criando um visual limpo e agradável para identificar no gráfico os padrões de formação. Obs: Caso algum padrão que você precise não esteja listado, basta entrar em contato conosco e solicitar a inclusão - geralme
This new unique indicator Actual tick footprint (volume chart) is developed for using on Futures markets, and it allows seeing the volume of real deals right when they are performed. The indicator Actual tick footprint (volume chart) represents a greatly enhanced tick chart that includes additional information about the volume of deal performed at a specific price. In addition, this unique indicator for MetaTrader 5 allows to clearly detecting a deal type – buy or sell. Alike the standard tick c
Volume Profile V6
Andrey Kolesnik
4.5 (2)
The volume profile indicator of the market + a S mart oscillator . It works on almost all instruments - currency pairs , stocks , futures , cryptocurrency , on real volumes and on tick ones . You can set both the automatic definition of the profile range , for example , for a week or a month , etc . , and set the range manually by moving the boundaries ( two vertical lines red and blue ) . It is shown as a histogram . The width of the histogram at this level means , conditionally , the number of
Forex Volume MT5
KEENBASE SOFTWARE SOLUTIONS
KT Forex Volume shows the buying and selling volume of a currency pair in the form of a colored histogram. The volume is made of buying and selling transactions in an asset. In FX market: If the buying volume gets bigger than the selling volume, the price of a currency pair would go up. If the selling volume gets bigger than the buying volume, the price of a currency pair would go down. Features Avoid the bad trades by confirming them using the tick volume data. It helps you to stay on the side
Description The indicator uses market profile theory to show the most relevant trading zones, on a daily basis. The zones to be shown are LVN (low volume nodes) and POC (point of control). An LVN zone is one which represents price areas with the least time or volume throughout the day. Typically, these areas indicate a supply or demand initiative, and in the future, they can turn into important breakout or retracement zones. A POC zone is one which represents price areas with the most time or vo
RAD CRITICAL LEVES RAD indicator tracks “Relevant Volume” in real time, identifying accumulation and distribution processes, projecting them in the chart as SUPPORT or RESISTANCE zones. Natural   support   and resistance levels are generated by Volume Accumulation and Distribution processes. As these processes evolve, levels at which the relevant volume in the market place is positioned, become difficult areas to cross upwards or downwards. By using this information, traders can identify very s
AW Candle Patterns
AW Trading Software Limited
O indicador AW Candle Patterns é uma combinação de um indicador de tendência avançado combinado com um poderoso scanner de padrão de vela. É uma ferramenta útil para reconhecer e destacar os trinta padrões de velas mais confiáveis. Além disso, é um analisador de tendências atual baseado em barras coloridas com       plug-in painel de tendência multi-timeframe que pode ser redimensionado e posicionado. Uma capacidade única de ajustar a exibição de padrões dependendo da filtragem de tendências. Va
Delta Aggression Volume PRO  é um Indicador desenvolvido para acompanhar a força e continuidade do   volume   das agressões de venda e de compra. Nota : Ele   só funciona   com   corretoras e/ou mercados   que   informam o tipo de agressão   de   cada negociação , ou seja, informando se foi uma   agressão de venda ou de compra . Criptomoedas e Forex   não fornecem este tipo de dado, ou seja, não funciona com eles . O   Delta Agrression Volume PRO   possui recursos que possibilitam visualizar a
Você gosta de operar Análise Técnica, assim como eu? Então você vai gostar deste indicador, pois ele calcula de forma automática os suportes e resistências do ativo em tempos gráficos simultâneos, ou o famoso MTF (Multi Time Frame). Além dos suportes e resistências é possível ter sinais de alerta quando o preço rompe ou toca (ou os dois). Sua configuração é bem simples. O visual é totalmente configurável. Faça bom uso!
VolumeDeltaBars
Stanislav Korotky
This indicator is a conventional analytical tool for tick volumes changes. It calculates tick volumes for buys and sells separately, and their delta on every bar, and displays volumes by price clusters (cells) within a specified bar (usually the latest one). The algorithm used internally is the same as in the indicator VolumeDeltaMT5 , but results are shown as cumulative volume delta bars (candlesticks). Analogous indicator for MetaTrader 4 exists - CumulativeDeltaBars . This is a limited substi
UPD1 Profile Levels MT5
Vitaliy Kuznetsov
5 (3)
O indicador localiza os níveis de volume máximo e mínimo de preços (perfil do mercado) no histograma de trabalho para o número especificado de barras.   Perfil composto. A altura do histograma é totalmente automática e se adapta a qualquer instrumento e período de tempo. O algoritmo do autor é usado e não repete análogos conhecidos. A altura dos dois histogramas é aproximadamente igual à altura média da vela. Um alerta inteligente irá ajudá-lo a informar sobre o preço relativo ao nível de volume
Wapv Price and volume
Eduardo Da Costa Custodio Santos
O Indicador WAPV Price and Volume para MT5 faz parte do conjunto de ferramentas do (Wyckoff Academy Wave Market) e ( Wyckoff Academy Price and Volume). O Indicador WAPV Price and Volume para MT5 foi criado para facilitar a visualização da movimentação do volume  no gráfico de forma intuitiva. Com ele você pode observar os momentos de pico de volume e momentos em que o mercado não tem interesse profissional Identificar momentos que o Mercado esta se movimentando por inércia e não por moviment
AnyProfile MT5
Evgeny Shevtsov
5 (17)
The indicator displays market profiles of any duration in any place on the chart. Simply create a rectangle on the chart and this rectangle will be automatically filled by the profile. Change the size of the rectangle or move it - the profile will automatically follow the changes. Operation features The indicator is controlled directly from the chart window using the panel of buttons and fields for entering parameters. In the lower right corner of the chart window there is a pop-up "AP" button
Volumes Direction MT5
William Oswaldo Mayorga Urduy
VOLUMES DIRECTION MT5 Normalmente, o indicador de volume tem uma mudança de cor padrão quando o volume atual é maior do que o anterior, é importante, mas não muito útil. Por este motivo, este indicador foi criado que além do volume normal, quando a vela é de alta ou de baixa, ela os pinta com uma cor diferente, por padrão é azul para alta e vermelho para baixa, mas essas cores podem ser personalizadas para o Gosto do comerciante. Não se esqueça de verificar meus outros indicadores que o aj
Volume Delta Candle
Muhammad Muzaffar Hussan
Volume Delta Candles: A Comprehensive Tool for In-Depth Trading Analysis Unlock a seamless way to interpret trading experience within each candle. With Volume Delta Candles, there's no need for additional volume indicators—everything you need is built in. This advanced tool utilizes lower timeframes or live market data to present the percentage of buying versus selling volume within each candle as an intuitive color-coded bar. Before diving in, ensure you’re familiar with Volume and Volume Delta
Mini Chart Indicators
Flavio Javier Jarabeck
The Metatrader 5 has a hidden jewel called Chart Object, mostly unknown to the common users and hidden in a sub-menu within the platform. Called Mini Chart, this object is a miniature instance of a big/normal chart that could be added/attached to any normal chart, this way the Mini Chart will be bound to the main Chart in a very minimalist way saving a precious amount of real state on your screen. If you don't know the Mini Chart, give it a try - see the video and screenshots below. This is a gr
O indicador SMC Venom Model BPR é uma ferramenta profissional para os traders que trabalham com o conceito Smart Money (SMC). Identifica automaticamente dois padrões principais no gráfico de preços: FVG   (Fair Value Gap) é uma combinação de três velas, em que existe um gap entre a primeira e a terceira velas. Forma uma zona entre níveis onde não há suporte de volume, o que geralmente leva a uma correção de preço. BPR   (Balanced Price Range) é uma combinação de dois padrões FVG que formam uma
VR Grid Mt5
Vladimir Pastushak
3.43 (7)
O indicador VR Grid foi projetado para criar uma grade gráfica com configurações definidas pelo usuário. Ao contrário da grade padrão , a VR Grid é usada para construir níveis circulares . Dependendo da escolha do usuário, o passo entre os níveis de rodada pode ser arbitrário. Além disso, ao contrário de outros indicadores e utilitários, o VR Grid mantém a posição da rede mesmo quando o período de tempo muda ou o terminal é reiniciado. Configurações, arquivos de configuração, versões demo, instr
FREE
The Strat indicator is a full toolkit regarding most of the concepts within "The Strat" methodology with features such as candle numbering, pivot machine gun (PMG) highlighting, custom combo highlighting, and various statistics included. Alerts are also included for the detection of specific candle numbers, custom combos, and PMGs.   SETTINGS Show Numbers on Chart: Shows candle numbering on the chart. Style Candles: Style candles based on the detected number. Only effective on non-line
O padrão Copa e alça é uma formação técnica de preços que se assemelha a uma xícara e alça, em que a xícara tem a forma de um "U" e a alça apresenta um ligeiro desvio para baixo. O lado direito do padrão - a alça - é menor que o lado esquerdo - xícara - e retrocede não mais que 50% da parte superior. Pode ser um padrão de continuação e reversão. [ Guia de instalação | Guia de atualização | Solução de problemas | FAQ | Todos os produtos ] Sinais de negociação claros Cores e tamanhos personalizáve
Owl Smart Levels MT5
Sergey Ermolov
4 (29)
Versão MT4  |  FAQ O Indicador Owl Smart Levels é um sistema de negociação completo dentro de um indicador que inclui ferramentas populares de análise de mercado, como fractais avançados de Bill Williams , Valable ZigZag que constrói a estrutura de onda correta do mercado e níveis de Fibonacci que marcam os níveis exatos de entrada no mercado e lugares para obter lucros. Descrição detalhada da estratégia Instruções para trabalhar com o indicador Consultor de negociação Owl Helper Chat privado d
Your Pointer is no ordinary Forex channel. This corridor is built on the basis of the analysis of several candles, starting from the last one, as a result of which the extremes of the studied interval are determined. They are the ones who create the channel lines. Like all channels, it has a middle line as well as a high and low line. This channel is worth watching for its unusual behavior. The use of the Your Pointer indicator allows the trader to react in time to the price going beyond the bo
Crash 1000 Scalping Indicator for the Crash 1000 Deriv Synthetic Index. Introduction The Crash 1000 Scalping Indicator is a specialized tool designed for the Crash 1000 index on the Deriv Synthetic market. This indicator is particularly useful for scalping on the M1 timeframe, helping traders to identify precise entry and exit points for buy positions. It is designed to be non-repainting, providing clear signals with audible alerts and push notifications, and is compatible with mobile devices th
True Weis Wave
Atila Goncalves Firmino
Uma versão baseada na descrição do David Waves em seu livro 'Trade About to Happen' da sua adaptação do gráfico de onda de Wyckoff. O indicador acumula o volume de forma direcional, somando a cada fechamento de tijolo ou vela, com indicação de cor para alta e baixa.  Podendo ser usado com volume real e de tick. Ele também muda de cor quando há a superação do valor acumulado da onda anterior, sendo o sinal de entrada. Amarelo é usado para doji em gráfico de fala. Ele continua com as somas anteri
Este indicador permite-lhe desfrutar os dois produtos mais populares para analisar volumes de ofertas e das negociações no mercado a um preço favorável: Actual Depth of Market Chart Actual Tick Footprint Volume Chart Este produto combina o poder de ambos os indicadores e é fornecido como um único arquivo. Venda Anti-crise. Hoje com menor preço. Anda logo! A funcionalidade do COMBO Actual Depth of Market e Tick Volume Chart é totalmente idêntica aos indicadores originais. Você vai aproveitar o po
Os compradores deste produto também adquirem
Trend Screener Pro MT5
STE S.S.COMPANY
4.85 (82)
Desbloqueie o poder da negociação de tendências com o indicador Trend Screener: sua solução definitiva de negociação de tendências, alimentada por lógica difusa e sistema de múltiplas moedas! Eleve sua negociação de tendências com o Trend Screener, o revolucionário indicador de tendências alimentado por lógica difusa. É um poderoso indicador de acompanhamento de tendências que combina mais de 13 ferramentas e recursos premium e 3 estratégias de negociação, tornando-o uma escolha versátil para to
Algo Pumping
Ihor Otkydach
5 (11)
PUMPING STATION – Sua estratégia pessoal “tudo incluído” Apresentamos o PUMPING STATION — um indicador revolucionário para Forex que vai transformar sua maneira de operar em uma experiência empolgante e eficaz. Este não é apenas um assistente, mas sim um sistema de trading completo com algoritmos poderosos que vão te ajudar a operar de forma mais estável. Ao adquirir este produto, você recebe GRATUITAMENTE: Arquivos de configuração exclusivos: para uma configuração automática e desempenho máxim
Golden Trend Indicator MT5
Noha Mohamed Fathy Younes Badr
4.89 (18)
Golden Trend indicator  is The best indicator for predicting trend movement this indicator never lags and never repaints and never back paints    and give  arrow buy and sell    before the candle appear  and it will help you and  will make your trading decisions clearer its work on all currencies and  gold and crypto and all time frame This unique  indicator uses very secret algorithms to catch the  trends, so you can trade using this indicator and see the trend clear on charts  manual guide and
Divergence Bomber
Ihor Otkydach
5 (1)
Cada comprador deste indicador recebe adicionalmente, e de forma gratuita: A ferramenta exclusiva "Bomber Utility", que acompanha automaticamente cada operação, define os níveis de Stop Loss e Take Profit e fecha operações de acordo com as regras da estratégia; Arquivos de configuração (set files) para ajustar o indicador em diferentes ativos; Set files para configurar o Bomber Utility nos modos: "Risco Mínimo", "Risco Balanceado" e "Estratégia de Espera"; Um vídeo tutorial passo a passo que aju
O Support And Resistance Screener está em um indicador de nível para MetaTrader que fornece várias ferramentas dentro de um indicador. As ferramentas disponíveis são: 1. Screener de estrutura de mercado. 2. Zona de retração de alta. 3. Zona de retração de baixa. 4. Pontos de Pivô Diários 5. Pontos Pivot semanais 6. Pontos Pivot mensais 7. Forte suporte e resistência com base no padrão harmônico e volume. 8. Zonas de nível de banco. OFERTA POR TEMPO LIMITADO: O indicador de suporte e resistência
TPSpro RFI Levels MT5
Roman Podpora
4.55 (20)
Zonas de reversão / Volumes de pico / Zonas ativas de um grande player =       SISTEMA TS TPSPRO INSTRUÇÕES RUS       /       INSTRUÇÕES       ENG       /           Versão MT4        Cada comprador deste indicador recebe adicionalmente GRATUITAMENTE: 6 meses de acesso aos sinais de negociação do serviço RFI SIGNALS - pontos de entrada prontos de acordo com o algoritmo TPSproSYSTEM. Materiais de treinamento com atualizações regulares - mergulhe na estratégia e aumente seu nível profissional. Su
RelicusRoad Pro MT5
Relicus LLC
4.78 (18)
Agora US $ 147 (aumentando para US $ 499 após algumas atualizações) - Contas ilimitadas (PCs ou Macs) Manual do usuário do RelicusRoad + vídeos de treinamento + acesso ao grupo de discórdia privado + status VIP UMA NOVA FORMA DE OLHAR PARA O MERCADO O RelicusRoad é o indicador de negociação mais poderoso do mundo para forex, futuros, criptomoedas, ações e índices, oferecendo aos traders todas as informações e ferramentas necessárias para se manterem rentáveis. Fornecemos análises técnicas e
FX Volume MT5
Daniel Stein
4.82 (17)
FX Volume: Vivencie o Verdadeiro Sentimento de Mercado sob a Perspectiva de um Corretor Visão Geral Rápida Quer aprimorar sua abordagem de trading? FX Volume fornece insights em tempo real sobre como traders de varejo e corretores estão posicionados—bem antes de relatórios atrasados como o COT. Seja para buscar ganhos consistentes ou simplesmente ter uma vantagem mais clara no mercado, FX Volume ajuda você a detectar grandes desequilíbrios, confirmar rompimentos e aperfeiçoar sua gestão de ris
MetaForecast M5
Vahidreza Heidar Gholami
5 (3)
MetaForecast prevê e visualiza o futuro de qualquer mercado com base nas harmonias nos dados de preços. Embora o mercado nem sempre seja previsível, se houver um padrão nos preços, o MetaForecast pode prever o futuro com a maior precisão possível. Em comparação com outros produtos similares, o MetaForecast pode gerar resultados mais precisos ao analisar as tendências do mercado. Parâmetros de entrada Past size (Tamanho do passado) Especifica o número de barras que o MetaForecast usa para criar
Gold Stuff mt5
Vasiliy Strukov
4.93 (178)
Gold Stuff mt5-um indicador de tendência projetado especificamente para o ouro, também pode ser usado em qualquer instrumento financeiro. O indicador não é redesenhado ou atrasado. O timeframe recomendado é H1. Importante! Entre em contato comigo imediatamente após a compra para obter instruções e bônus!  Você pode obter uma cópia gratuita do nosso indicador Strong Support e Trend Scanner, envie uma mensagem privada. a mim! PARÂMETRO Draw Arrow-incl.desligado. desenhar setas no gráfico. Aler
FX Power MT5 NG
Daniel Stein
5 (15)
FX Power: Analise a Força das Moedas para Decisões de Negociação Mais Inteligentes Visão Geral FX Power é a sua ferramenta essencial para compreender a força real das principais moedas e do ouro em quaisquer condições de mercado. Identificando moedas fortes para comprar e fracas para vender, FX Power simplifica as decisões de negociação e revela oportunidades de alta probabilidade. Quer você prefira seguir tendências ou antecipar reversões usando valores extremos de Delta, esta ferramenta adap
Este painel mostra os últimos   padrões harmónicos   disponíveis para os símbolos seleccionados, pelo que poupará tempo e será mais eficiente /   versão MT4 . Indicador gratuito:   Basic Harmonic Pattern Colunas do indicador Symbol :   aparecem os símbolos seleccionados Trend :   de alta ou de baixa Pattern :   tipo de padrão (gartley, borboleta, morcego, caranguejo, tubarão, cifra ou ABCD) Entry :   preço de entrada SL:   preço de paragem de perda TP1:   preço do 1º take profit TP2:   preço
Quantum TrendPulse
Bogdan Ion Puscasu
5 (13)
Apresentando   Quantum TrendPulse   , a ferramenta de negociação definitiva que combina o poder do   SuperTrend   ,   RSI   e   Stochastic   em um indicador abrangente para maximizar seu potencial de negociação. Projetado para traders que buscam precisão e eficiência, este indicador ajuda você a identificar tendências de mercado, mudanças de momentum e pontos de entrada e saída ideais com confiança. Principais características: Integração SuperTrend:   siga facilmente a tendência predominante do
Matrix Arrow Indicator MT5
Juvenille Emperor Limited
5 (13)
O   Matrix Arrow Indicator MT5   é uma tendência única 10 em 1 seguindo um indicador multi-timeframe   100% sem repintura   que pode ser usado em todos os símbolos/instrumentos:   forex ,   commodities ,   criptomoedas ,   índices ,   ações .  O  Matrix Arrow Indicator MT5  determinará a tendência atual em seus estágios iniciais, reunindo informações e dados de até 10 indicadores padrão, que são: Índice de movimento direcional médio (ADX) Índice de canal de commodities (CCI) Velas clássicas de
TPSproTREND PrO MT5
Roman Podpora
4.72 (18)
VERSION MT4        —        ИНСТРУКЦИЯ RUS           —        INSTRUCTIONS  ENG Principais funções: Sinais de entrada precisos SEM RENDERIZAÇÃO! Se aparecer um sinal, ele permanece relevante! Esta é uma diferença importante em relação aos indicadores de redesenho, que podem fornecer um sinal e depois alterá-lo, o que pode levar à perda de fundos depositados. Agora você pode entrar no mercado com maior probabilidade e precisão. Também existe a função de colorir as velas após o aparecimento da set
MONEYTRON – ТВОЙ ЛИЧНЫЙ СИГНАЛ НА УСПЕХ! XAUUSD | AUDUSD | USDJPY | BTCUSD Поддержка таймфреймов: M5, M15, M30, H1 Почему трейдеры выбирают Moneytron? 82% успешных сделок — это не просто цифры, это результат продуманной логики, точного алгоритма и настоящей силы анализа. Автоматические сигналы на вход — не нужно гадать: когда покупать, когда продавать. 3 уровня Take Profit — ты сам выбираешь свой уровень прибыли: безопасный, уверенный или максимум. Четкий Stop Loss — контролируешь риск
Grabber System MT5
Ihor Otkydach
5 (5)
Apresento a você um excelente indicador técnico: Grabber, que funciona como uma estratégia de trading “tudo incluído”, pronta para usar. Em um único código estão integradas ferramentas poderosas de análise técnica de mercado, sinais de entrada (setas), funções de alertas e notificações push. Cada comprador deste indicador também recebe gratuitamente: Utilitário Grabber: ferramenta para gerenciamento automático de ordens abertas Vídeo tutorial passo a passo: como instalar, configurar e operar com
MTF Supply Demand Zones MT5
Georgios Kalomoiropoulos
5 (1)
Próxima geração de zonas automatizadas de oferta e demanda. Algoritmo novo e inovador que funciona em qualquer gráfico. Todas as zonas estão sendo criadas dinamicamente de acordo com a ação do preço do mercado. DOIS TIPOS DE ALERTAS --> 1) QUANDO O PREÇO ATINGE UMA ZONA 2) QUANDO UMA NOVA ZONA É FORMADA Você não recebe mais um indicador inútil. Você obtém uma estratégia de negociação completa com resultados comprovados.     Novas características:     Alertas quando o preço atinge a zona d
FxaccurateLS
Shiv Raj Kumawat
WHY IS OUR FXACCCURATE LS MT5 THE PROFITABLE ? PROTECT YOUR CAPITAL WITH RISK MANAGEMENT Gives entry, stop and target levels from time to time. It finds Trading opportunities by analyzing what the price is doing during established trends. POWERFUL INDICATOR FOR A RELIABLE STRATEGIES We have made these indicators with a lot of years of hard work. It is made at a very advanced level. Established trends provide dozens of trading opportunities, but most trend indicators completely ignore them! The
Este é um indicador para MT5 que fornece sinais precisos para entrar em uma negociação sem redesenhar. Ele pode ser aplicado a qualquer ativo financeiro: forex, criptomoedas, metais, ações, índices. Ele fornecerá estimativas bastante precisas e informará quando é melhor abrir e fechar um negócio. Assista o vídeo (6:22) com um exemplo de processamento de apenas um sinal que compensou o indicador! A maioria dos traders melhora seus resultados de negociação durante a primeira semana de negociação c
NOTE: CYCLEMAESTRO is distributed only on this website, there are no other distributors. Demo version is for reference only and is not supported. Full versione is perfectly functional and it is supported. CYCLEMAESTRO , the first and only indicator of Cyclic Analysis, useful for giving signals of TRADING, BUY, SELL, STOP LOSS, ADDING. Created on the logic of   Serghei Istrati   and programmed by   Stefano Frisetti ;   CYCLEMAESTRO   is not an indicator like the others, the challenge was to inter
ATrend
Zaha Feiz
4.77 (13)
ATREND: Como Funciona e Como Usá-lo #### Como Funciona O indicador "ATREND" para a plataforma MT5 é projetado para fornecer aos traders sinais robustos de compra e venda, utilizando uma combinação de metodologias de análise técnica. Este indicador aproveita principalmente o Intervalo Verdadeiro Médio (ATR) para medir a volatilidade, juntamente com algoritmos de detecção de tendências para identificar possíveis movimentos de mercado. Deixe uma mensagem após a compra e receba um brinde especial.
FX Levels MT5
Daniel Stein
5 (4)
FX Levels: Suporte e Resistência com Precisão Excepcional para Todos os Mercados Visão Geral Rápida Procurando um meio confiável de identificar níveis de suporte e resistência em qualquer mercado—incluindo pares de moedas, índices, ações ou commodities? FX Levels combina o método “Lighthouse” tradicional com uma abordagem dinâmica de vanguarda, fornecendo uma precisão quase universal. Baseado em nossa experiência real com corretores e em atualizações automáticas diárias mais as de tempo real,
Apresentando       Quantum Breakout PRO   , o inovador Indicador MQL5 que está transformando a maneira como você negocia Breakout Zones! Desenvolvido por uma equipe de traders experientes com experiência comercial de mais de 13 anos,       Quantum Breakout PRO       foi projetado para impulsionar sua jornada comercial a novos patamares com sua estratégia de zona de fuga inovadora e dinâmica. O Quantum Breakout Indicator lhe dará setas de sinal em zonas de breakout com 5 zonas-alvo de lucro e su
Procurando por um poderoso indicador de negociação forex que possa ajudá-lo a identificar oportunidades de negociação lucrativas com facilidade? Não procure mais do que o Beast Super Signal. Este indicador baseado em tendências fácil de usar monitora continuamente as condições do mercado, procurando por novas tendências em desenvolvimento ou aproveitando as já existentes. O Beast Super Signal dá um sinal de compra ou venda quando todas as estratégias internas se alinham e estão em 100% de conflu
Trend Hunter MT5
Andrey Tatarinov
5 (2)
Trend Hunter é um indicador de tendência para trabalhar nos mercados Forex, criptomoeda e CFD. Uma característica especial do indicador é que ele segue a tendência com confiança, sem alterar o sinal quando o preço ultrapassa ligeiramente a linha de tendência. O indicador não é redesenhado; um sinal para entrar no mercado aparece após o fechamento da barra. Ao avançar ao longo de uma tendência, o indicador mostra pontos de entrada adicionais na direção da tendência. Com base nesses sinais, você
Gold Trend 5
Sergei Linskii
3.5 (2)
Tendência do ouro - este é um bom indicador técnico de acções. O algoritmo do indicador analisa o movimento do preço de um ativo e reflecte a volatilidade e as potenciais zonas de entrada. Os melhores sinais do indicador: - Para VENDER = histograma vermelho + ponteiro SHORT vermelho + seta de sinal amarelo na mesma direção. - Para COMPRAR = histograma azul + ponteiro LONGO azul + seta de sinal aqua na mesma direção. Vantagens do indicador: 1. O indicador produz sinais com elevada precisão
IX Power MT5
Daniel Stein
4.86 (7)
IX Power: Descubra informações de mercado para índices, commodities, criptomoedas e forex Visão Geral IX Power é uma ferramenta versátil projetada para analisar a força de índices, commodities, criptomoedas e símbolos de forex. Enquanto o FX Power oferece a máxima precisão para pares de moedas ao utilizar dados de todos os pares disponíveis, o IX Power foca exclusivamente nos dados do mercado do símbolo subjacente. Isso torna o IX Power uma excelente escolha para mercados fora do forex e uma o
Easy Breakout MT5
Mohamed Hassan
4.6 (5)
After your purchase, feel free to contact me for more details on how to receive a bonus indicator called VFI, which pairs perfectly with Easy Breakout for enhanced confluence!     Easy Breakout MT5   is a powerful price action trading system built on one of the most popular and widely trusted strategies among traders: the   Breakout strategy ! This indicator delivers crystal-clear Buy and Sell signals based on breakouts from key support and resistance zones. Unlike typical breakout indicators
[ MT4 Version ]  [ Kill Zones ]  [ SMT Divergences ] How to trade using Order Blocks:  Click here User Interface Performance:  During testing in the strategy tester, the UI may experience lag. Rest assured, this issue is specific to the testing environment and does not affect the indicator's performance in live trading. Elevate your trading strategy with the  Order Blocks ICT Multi TF  indicator, a cutting-edge tool designed to enhance your trading decisions through advanced order block analysis
Mais do autor
WalkForwardOptimizer MT5
Stanislav Korotky
3.63 (8)
WalkForwardOptimizer library allows you to perform rolling and cluster walk-forward optimization of expert advisers (EA) in MetaTrader 5. To use the library include its header file WalkForwardOptimizer.mqh into your EA source code, add call provided functions as appropriate. Once the library is embedded into EA, you may start optimization according to the procedure described in the User guide . When it's finished, intermediate results are saved into a CSV file and some special global variables.
VolumeDeltaBars
Stanislav Korotky
This indicator is a conventional analytical tool for tick volumes changes. It calculates tick volumes for buys and sells separately, and their delta on every bar, and displays volumes by price clusters (cells) within a specified bar (usually the latest one). The algorithm used internally is the same as in the indicator VolumeDeltaMT5 , but results are shown as cumulative volume delta bars (candlesticks). Analogous indicator for MetaTrader 4 exists - CumulativeDeltaBars . This is a limited substi
RenkoFromRealTicks
Stanislav Korotky
4.5 (2)
This non-trading expert utilizes so called custom symbols feature ( available in MQL API as well) to build renko charts based on history of real ticks of selected standard symbol. RenkoFromRealTicks generates custom symbol quotes, thus you may open many charts to apply different EAs and indicators to the renko. It also transmits real ticks to update renko charts in real time. The generated renko chart uses M1 timeframe. It makes no sense to switch the renko chart to a timeframe other than M1. T
AutomaticZigZag
Stanislav Korotky
4.5 (2)
This is a non-parametric ZigZag providing 4 different methods of calculation. Upward edge continues on new bars while their `highs` are above highest `low` among previous bars, downward edge continues on next bars while their `lows` are below lowest `high` among previous; Gann swing: upward edge continues while `highs` and `lows` are higher than on the left adjacent bar, downward edge continues while `highs` and `lows` are lower than on the left adjacent bar. Inside bars (with lower `high` and
FREE
SuperIndices MT5
Stanislav Korotky
5 (1)
This cluster indicator is MT5 version of SuperIndices for MT4. It allows for processing mixed clusters, where symbols from various markets can be included. For example, it can handle Forex, indices, CFDs, spot at the same time. Number of visible lines increased to 16. An interactive ruler can be enabled to measure signals' strength on the history. The indicator creates a set of embedded cluster indicators (CCFpExtraIndices) with carefully selected periods and combines their results using smart w
CustomVolumeDelta
Stanislav Korotky
5 (1)
This indicator displays volume delta (of either tick volume or real volume) encoded in a custom symbol, generated by special expert advisers, such as RenkoFromRealTicks . MetaTrader does not allow negative values in the volumes, this is why we need to encode deltas in a special way, and then use CustomVolumeDelta indicator to decode and display the deltas. This indicator is applicable only for custom instruments generated in appropriate way (with signed volumes encoded). It makes no sense to ap
FREE
This non-trading expert utilizes so called custom symbols feature ( available in MQL API as well) to build custom charts based on history of real ticks of selected standard symbol. New charts imitate one of well-known graphic structures: Point-And-Figure (PnF) or Kagi. The result is not exactly PnF's X/O columns or rectangular waves of Kagi. Instead it consists of bars, calculated from and denoting stable unidirectional price moves (as multiples of the box size), which is equivalent to XO colum
This is a demo version of a non-trading expert , which utilizes so called the custom symbols feature ( available in MQL as well ) to build renko charts based on historical quotes of selected standard symbol and to refresh renko in real-time according to new ticks. Also it translates real ticks to the renko charts, which allows other EAs and indicators to trade and analyze renko. Place the EA on a chart of a working instrument. The lesser timeframe of the source chart is, the more precise resulti
FREE
Order Book, known also as Market Book, market depth, Level 2, - is a dynamically updated table with current volumes of orders to buy and to sell specific financial instument at price levels near Bid and Ask. MetaTrader 5 provides the means for receiving market book from your broker, but in real time only, without access to its history. This expert adviser OrderBook History Playback allows you to playback the market book events on the history using files, created by OrderBook Recorder . The exper
FREE
WalkForwardDemo MT5
Stanislav Korotky
WalkForwardDemo is an expert adviser (EA) demonstrating how the built-in library WalkForwardOptimizer (WFO) for walk-forward optimization works. It allows you to easily optimize, view and analyze your EA performance and robustness in unknown trading conditions of future. You may find more details about walk-forward optimization in Wikipedia . Once you have performed optimization using WFO, the library generates special global variables (saved in an "archived" file with GVF-extension) and a CSV-f
FREE
Comparator
Stanislav Korotky
4.75 (4)
This indicator compares the price changes during the specified period for the current symbol and other reference symbol. It allows to analyze the similar movements of highly correlated symbols, such as XAUUSD and XAGUSD, and find their occasional convergences and divergences for trading opportunities. The indicator displays the following buffers: light-green thick line - price changes of the current symbol for TimeGap bars; light-blue thin line - price changes of the reference symbol ( LeadSymbo
FREE
HZZM
Stanislav Korotky
4 (1)
This is an adaptive ZigZag based on modification of  HZZ indicator (original source code is available in this article ). Most important changes in this version: two additional indicator buffers added for zigzag evolution monitoring - they show cross signs at points where zigzag direction first changes; zigzag range (H) autodetection on day by day basis; time-dependent adjustment of zigzag range. Parameters: H - zigzag range in points; this parameter is similar to original HZZ, but it can take 0
FREE
OrderBook Utilities is a script, which performs several service operations on order book hob-files, created by OrderBook Recorder . The script processes a file for work symbol of the current chart. The file date is selected by means of the input parameter CustomDate (if it's filled in) or by the point where the script is dropped on the chart. Depending from the operation, useful information is written into the log, and optionally new file is created. The operation is selected by the input parame
FREE
This script allows performing a walk-forward analysis of trading experts based on the data collected by the WalkForwardLight MT5 library. The script builds a cluster walk forward report and rolling walk forward reports that refine it, in the form of a single HTML page. This script is optional, as the library automatically generates the report immediate after the optimization in the tester is complete. However, the script is convenient because it allows using the same collected data to rebuild th
FREE
Order Book, known also as Market Book, market depth, Level 2, - is a dynamically updated table with current volumes of orders to buy and to sell specific financial instument at price levels near Bid and Ask. MetaTrader 5 provides the means for receiving market book from your broker in real time. The expert OrderBook Recorder records market book changes and stores them in local files for further usage in indicators and expert adviser, including testing in the tester. The expert stores market book
FREE
PointsVsBars
Stanislav Korotky
This indicator provides a statistical analysis of price changes (in points) versus time delta (in bars). It calculates a matrix of full statistics about price changes during different time periods, and displays either distribution of returns in points for requested bar delta, or distribution of time deltas in bars for requested return. Please, note, that the indicator values are always a number of times corresponding price change vs bar delta occurred in history. Parameters: HistoryDepth - numbe
FREE
Order Book, known also as Market Book, market depth, Level 2, - is a dynamically updated table with current volumes of orders to buy and to sell specific financial instument at price levels near Bid and Ask. MetaTrader 5 provides the means for receiving market book from your broker, but in real time only, without access to its history. The indicator OrderBook Cumulative Indicator accumulates market book data online and visualizes them on the chart. In addition, the indicator can show the market
RenkoCharts
Stanislav Korotky
This non-trading expert utilizes so called custom symbols feature ( available in MQL as well ) to build renko charts based on historical quotes of selected standard symbol and to refresh renko in real-time according to new ticks. Also, it translates real ticks to the renko charts, which allows other EAs and indicators to trade and analyze renko. Place RenkoCharts on a chart of a work instrument. The lesser timeframe of the source chart is, the more precise resulting renko chart is, but the lesse
ReturnAutoScale
Stanislav Korotky
5 (2)
The indicator calculates running total of linear weighted returns. It transforms rates into integrated and difference-stationary time series with distinctive buy and sell zones. Buy zones are shown in blue, sell zones in red. Parameters: period - number of bars to use for linear weighted calculation; default value - 96; smoothing - period for EMA; default value - 5; mode - an integer value for choosing calculation mode: 0 - long term trading; 1 - medium term trading; 2 - short term trading; defa
FREE
Year2Year
Stanislav Korotky
This indicator shows price changes for the same days in past years. D1 timeframe is required. This is a predictor indicator that finds D1 bars for the same days in past 8 years and shows their relative price changes on the current chart. Parameters: LookForward - number of days (bars) to show "future" price changes; default is 5; Offset - number of days (bars) to shift back in history; default is 0; ShowAverage - mode switch; true - show mean value for all 8 years and deviation bounds; false - s
FREE
SOMFX1Builder
Stanislav Korotky
5 (1)
If you like trading by candle patterns and want to reinforce this approach by modern technologies, this script is for you. In fact, it is a part of a toolbox, that includes a neural network engine implementing Self-Organizing Map (SOM) for candle patterns recognition, prediction, and provides you with an option to explore input and resulting data. The toolbox contains: SOMFX1Builder  - this script for training neural networks; it builds a file with generalized data about most characteristic pric
FREE
Mirror
Stanislav Korotky
This indicator predicts rate changes based on the chart display principle. It uses the idea that the price fluctuations consist of "action" and "reaction" phases, and the "reaction" is comparable and similar to the "action", so mirroring can be used to predict it. The indicator has three parameters: predict - the number of bars for prediction (24 by default); depth - the number of past bars that will be used as mirror points; for all depth mirroring points an MA is calculated and drawn on the ch
If you like trading crosses (such as AUDJPY, CADJPY, EURCHF, and similar), you should take into account what happens with major currencies (especially, USD and EUR) against the work pair: for example, while trading AUDJPY, important levels from AUDUSD and USDJPY may have an implicit effect. This indicator allows you to view hidden levels, calculated from the major rates. It finds nearest extremums in major quotes for specified history depth, which most likely form resistence or support levels, a
EvoLevels
Stanislav Korotky
The indicator displays most prominent price levels and their changes in history. It dynamically detects regions where price movements form attractors and shows up to 8 of them. The attractors can serve as resistance or support levels and outer bounds for rates. Parameters: WindowSize - number of bars in the sliding window which is used for detection of attractors; default is 100; MaxBar - number of bars to process (for performance optimization); default is 1000; when the indicator is called from
This is an intraday indicator that uses conventional formulae for daily and weekly levels of pivot, resistance and support, but updates them dynamically bar by bar. It answers the question how pivot levels would behave if every bar were considered as the last bar of a day. At every point in time, it takes N latest bars into consideration, where N is either the number of bars in a day (round the clock, i.e. in 24h) or the number of bars in a week - for daily and weekly levels correspondingly. So,
Most of traders use resistance and support levels for trading, and many people draw these levels as lines that go through extremums on a chart. When someone does this manually, he normally does this his own way, and every trader finds different lines as important. How can one be sure that his vision is correct? This indicator helps to solve this problem. It builds a complete set of virtual lines of resistance and support around current price and calculates density function for spatial distributi
The indicator draws a histogram of important levels for several major currencies attached to the current cross rates. It is intended for using on charts of crosses. It displays a histogram calculated from levels of nearest extremums of related major currencies. For example, hidden levels for AUDJPY can be detected by analyzing extremums of AUD and JPY rates against USD, EUR, GBP, and CHF. All instruments built from these currencies must be available on the client. This is an extended version of
StatBars
Stanislav Korotky
The indicator provides a statistic histogram of estimated price movements for intraday bars. It builds a histogram of average price movements for every intraday bar in history, separately for each day of week. Bars with movements above standard deviation or with higher percentage of buys than sells, or vice versa, can be used as direct trading signals. The indicator looks up current symbol history and sums up returns on every single intraday bar on a specific day of week. For example, if current
This is an easy to use signal indicator which shows and alerts probability measures for buys and sells in near future. It is based on statistical data gathered on existing history and takes into account all observed price changes versus corresponding bar intervals in the past. The statistical calculations use the same matrix as another related indicator - PointsVsBars. Once the indicator is placed on a chart, it shows 2 labels with current estimation of signal probability and alerts when signal
CCFpExtra
Stanislav Korotky
CCFpExtra is an extended version of the classic cluster indicator - CCFp. This is the MT4 version of indicator  CCFpExt available for MT5. Despite the fact that MT5 version was published first, it is MT4 version which was initially developed and tested, long before MT4 market was launched. Main Features Arbitrary groups of tickers or currencies are supported: can be Forex, CFDs, futures, spot, indices; Time alignment of bars for different symbols with proper handling of possibly missing bars, in
Filtro:
Sem comentários
Responder ao comentário
Versão 1.2 2020.04.18
- Data refreshing is improved for cases when the terminal is just restarted with the indicator attached on a chart.
- Forex and CFD symbols can now be processed as well, using tick counters instead of (missing) real volumes.