Cycles Predictor
- Indicadores
- Martin Eshleman
- Versão: 1.200
- Atualizado: 26 junho 2024
- Ativações: 5
Cycles Predictor Indicator
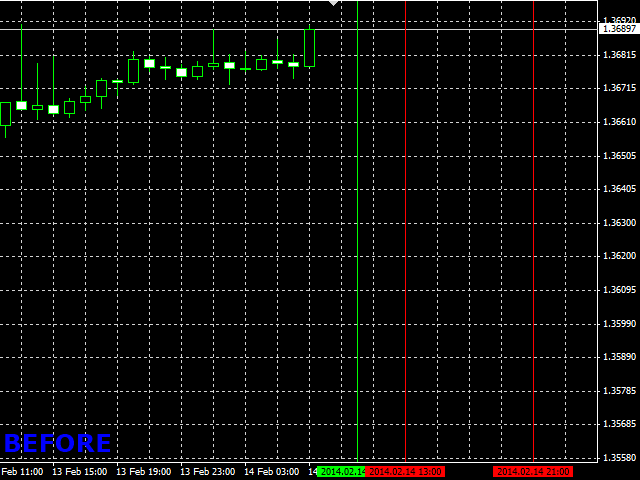
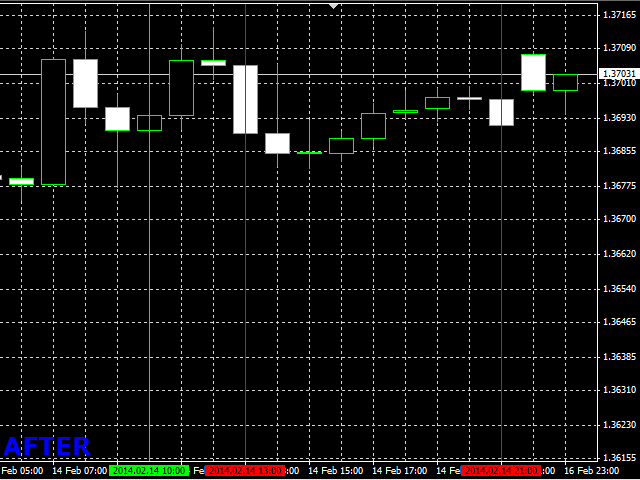
This indicator uses past market cycles to predict future price movements. The indicator scans through past data and considers combinations of cycles. When cycles coincide at the same future date/time then it is considered a valid future prediction. The predictions are drawn as vertical lines on the right side of the chart in the future. A prediction will often result in type of candle (ex. bull or bear) and/or a reversal point (ex. bottom or top) forming at this exact time. The lines are drawn well in advance which makes this a unique indicator.
- The indicator does not repaint, move, or delete lines! It also does not lag because the lines are drawn many bars in advance.
- It can be used for Forex trading and possibly for binary options trading.
- This indicator can be used for news trading strategies since the future times it plots often result in high volatility. So it's similar to news times which are known in advance too and which often result in high volatility.
- There is no need to constantly watch the chart since all lines are drawn ahead of time and the future times are clearly marked.
- Strength Factor - This controls the reliability and the number of predictions. The higher the number, the more reliable the future lines will be but the fewer lines will be drawn. And vice versa for a lower setting.
- Lookback Candles - This controls the number of past candles that the indicator will consider when looking for past cycles. The higher the number, the more cycles will be used and greater is the chance that future lines will be drawn, but the slower the indicator will be. And vice versa for a lower setting.
- Buy Line Color - This setting controls the color of the bullish vertical line drawn by the indicator.
- Sell Line Color - This setting controls the color of the bearish vertical line drawn by the indicator.
- The higher the number set for 'Strength Factor', the better. The lower the 'Lookback Candles', the better. If you see that too many lines are drawn on the chart, adjust the settings to be stricter until only a few lines are drawn. These will be stronger cycles then. So you should balance the 2 settings with this tip in mind.
- The indicator draws future buy and sell signals with different colors. The indicator uses past cycles to plot the future predictions. If the previous cycles used were bullish cycles then the indicator will plot a future buy signal. And vice versa. It's important to note that the direction of past cycles (bull or bear) do not always correlate with the future result. Sometimes, the future cycle just results in greater volatility. So the future lines are just colored based on what the past cycles were that were used to create the prediction, but the direction is not always accurate. What you should expect with near certainty though is that there will be a market reversal and/or greater volatility at the predicted times.
- This is an indicator based on cycles. If you don't like cycle lines or don't understand them then don't purchase. Complaining that this doesn't work is like saying cycles don't work.
- This indicator will work on any MT4 broker and chart.
- The examples below are taken from real live charts.
- IMPORTANT: Check out our site using the link in my profile to find FREE indicators and EAs!

















Not accurate at all