Statistical Auto Levels
- Utilitários
- Vladimir Tkach
- Versão: 1.0
- Ativações: 5
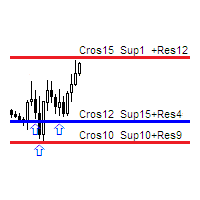
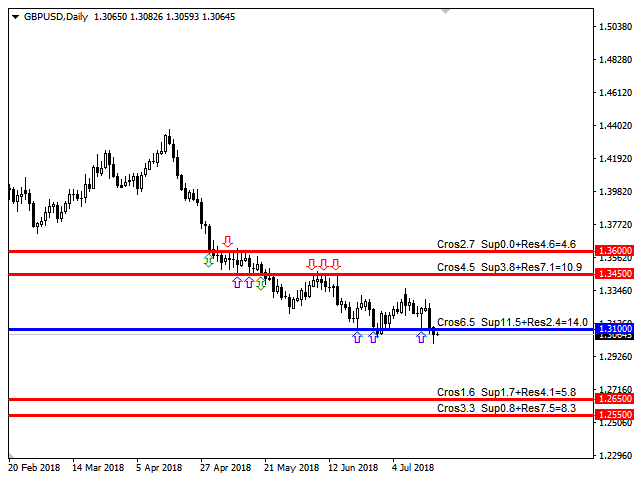
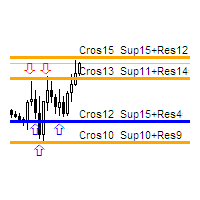
The indicator calculates the historic price statistics: the number of intersections of a level and the number of rollbacks. The levels are set as horizontal lines (the 'Horizontal lines' element on the Toolbar) manually, are are drawn automatically by the indicator with the specified step. Only strong levels are drawn in the automated mode. There are two options for the automated mode: 1. Strong levels of intersection and support/resistance; 2. Strong support/resistance levels.
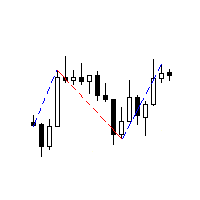
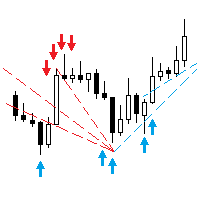
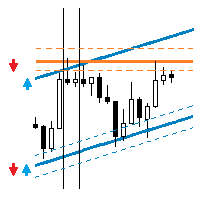
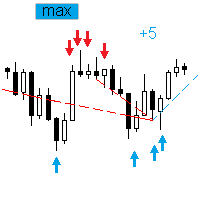
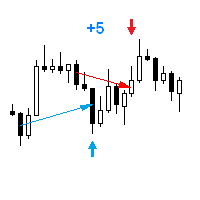
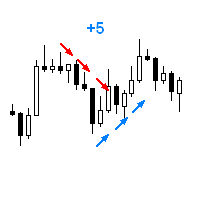
The indicator uses the specified tolerance of level touching for calculating intersection and rollback cases. The tolerance is sensitive to the time period of bars. For example: for the M5 period the tolerance should be about 10 pips, for M30 is should be 30 pips, for 1 day - 300 pips. The statistics of touches and intersections are displayed in the form of an information line at each level. In this line, the 'Cros' label means the number of intersections (green arrow), the 'Sup' label means the number of supports (blue arrow), 'Res' = the number of resistances (red arrow). Arrows in history show the areas of intersection and level touches.
If the indicator paints a level in red, then the level was historically acting mostly as a resistance level. Blue color means it worked as a support level. Orange color - the level acted as support and resistance almost the same number of times. The tolerance for this difference is specified as percentage in the Levels strength parameter.
Indicator Parameters
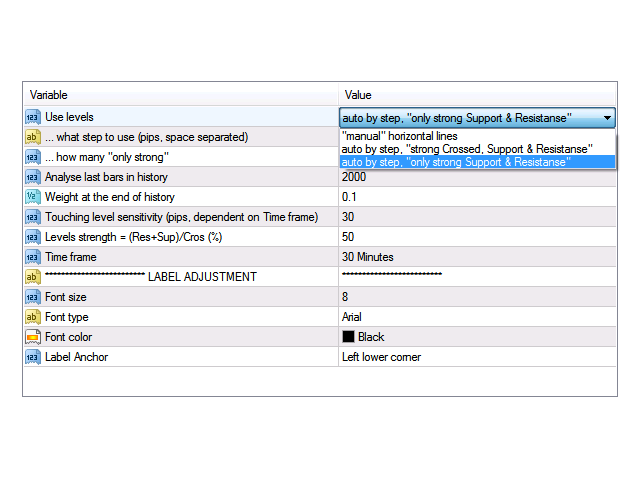
- Use levels - level drawing mode. You may select between manual and 2 automated modes.
- ... what step to use (pips, space separated) - price step for strong levels. You can specify several levels separating them with a coma.
- ... how many "only strong" - the number of strong levels above and below the price to search for.
- Weight at the end of history - the weight coefficient for the level touch strength at the end of the history. The coefficient varies linearly, starting from the specified coefficient at the end of the history to 1 at the current bar.
- Analyse last bars in history - analyzing the strength of the level on the specified number of historic bars.
- Touching level sensitivity (pips, dependent on Time frame) - tolerance for level touches. Sensitive to the Time frame parameter.
- Levels strength = (Res+Sup)/Cros (%) - level strength tolerance.
- Time frame - timeframe of analyzed bars.
- Font size - font size for the level information line.
- Font type - font type for the level information line.
- Font color - font color for the level information line.
- Label Anchor - location of the statistics data.
