• Visão global
  • Comentários (3)
  • Discussão (5)

Statistical Manual Levels

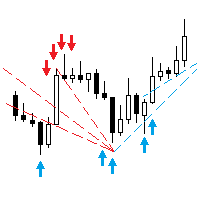
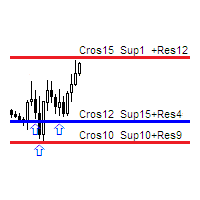
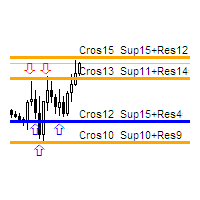
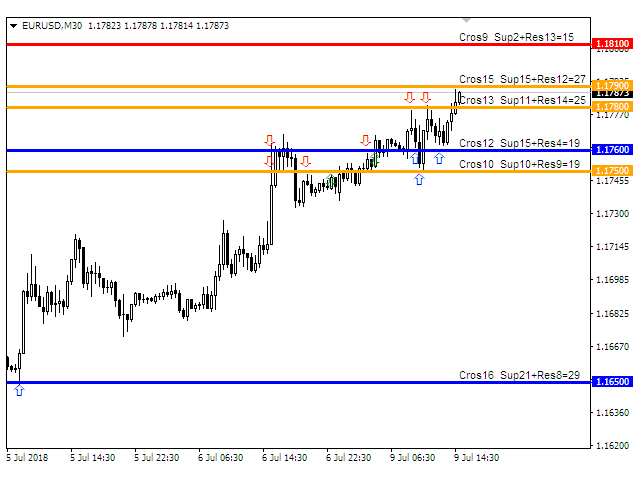
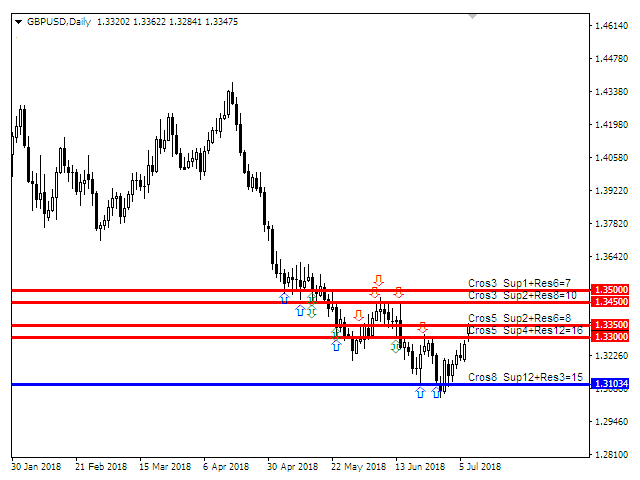
The indicator calculates the number of times the price crossed the levels and bounced off the levels in history. The levels are defined by horizontal lines (Horizontal lines element from the Toolbar). In the free version, the levels are set manually. To calculate the number of crosses and rebounds, the indicator uses the specified tolerance to touching a level. This tolerance is sensitive to the timeframe of the bars. For example: for M5 use a tolerance about 10 pips, for М30 - 30 pips, for D1 - 300 pips. The statistics on touches and intersections of the specified levels is displayed in the form of an information line at each level. In this line, the Cros label indicates the number of intersections (green arrow), the Sup label is the number of support levels (blue arrow), the Res label is the number of resistance levels (red arrow). The areas where the price had crossed and touched the levels in the history are shown as arrows.

In the indicator colors a level in red, then the levels has served as resistance in history more often. Blue - support level. Orange - the level serves both as support and resistance almost the same number of times. The tolerance for this difference is defined by the Levels strength percentage.


Indicator Parameters

  • Use levels - level plotting method. In the free version, only manual plotting is available.
  • Analyse last bars in history - analyze the level strength on the specified number of bars in history.
  • Touching levels sensitivity (pips) - tolerance for touching a level. The tolerance is sensitive to the Time frame parameter.
  • Levels strength = (Res+Sup)/Cros (%) - tolerance for level strength.
  • Time frame - timeframe of the analyzed bars.
  • Font size - font size of the information line of the level statistics.
  • Font type - font type of the information line of the level statistics.
  • Font color - font color of the information line of the level statistics.
  • Label Anchor - location of the information line of the level statistics.
Produtos recomendados
Trend Ray
Andriy Sydoruk
The indicator shows the potential trend direction by cyclical-wave dependence. Thus, all the rays of the intersection will be optimal rays, in the direction of which the price is expected to move, taking into account the indicator period. Rays can be used as a direction for potential market movement. But we must not forget that the approach must be comprehensive, the indicator signals require additional information to enter the market.
Owl smart levels
Sergey Ermolov
4.34 (35)
Versão MT5  |  FAQ O   Indicador Owl Smart Levels   é um sistema de negociação completo dentro de um indicador que inclui ferramentas populares de análise de mercado, como   fractais avançados de Bill Williams , Valable ZigZag que constrói a   estrutura de onda correta   do mercado e   níveis de Fibonacci que marcam os níveis exatos de entrada no mercado e lugares para obter lucros. Descrição detalhada da estratégia Instruções para trabalhar com o indicador Consultor de negociação Owl Helper Ch
Chart Patterns Detect 15 patterns (Ascending Triangle, Descending Triangle, Rising Wedge, Falling Wedge, Bullish Flag, Bearish Flag, Bullish Rectangle, Bearish Rectangle Symmetrical triangle, Head and Shoulders, Inverted Head and Shoulders, Triple top, Triple Bottom, Double Top, Double Bottom) Use historical data to calculate the probability of each pattern to succeed (possibility to filter notification according to the chance of success) gives graphic indication about the invalidation level and
YK-Fibo Pivot Indicator: Trade Smarter with Fibonacci Pivot Points The YK-Fibo Pivot Indicator is a powerful technical analysis tool that combines the precision of Fibonacci retracements with the insights of Pivot Points. Whether you're a novice or seasoned trader, this indicator empowers you to spot profitable opportunities in the market with ease. Why Choose YK-Fibo Pivot? Pinpoint Support & Resistance: By calculating Fibonacci levels based on the previous day's high, low, and close prices, y
Trendiness Index
Libertas LLC
5 (3)
"The trend is your friend" is one of the best known sayings in investing, because capturing large trendy price movements can be extremely profitable. However, trading with the trend is often easier said than done, because many indicators are based on price reversals not trends. These aren't very effective at identifying trendy periods, or predicting whether trends will continue. We developed the Trendiness Index to help address this problem by indicating the strength and direction of price trend
Super Reversal Pattern
Parfait Mujinga Ndalika
Super Reversal Pattern Indicator Unlock the power of advanced pattern recognition with our Super Reversal Pattern Indicator. Designed for traders seeking precision and reliability, this indicator identifies one of the most effective reversal patterns in technical analysis, offering a significant edge in your trading strategy. Key Features: Non-Repainting Accuracy: Enjoy the confidence of non-repainting technology. Once a Super Reversal Pattern is detected, it remains static, providing consis
The Penta-O is a 6-point retracement harmonacci pattern which usually precedes big market movements. Penta-O patterns can expand and repaint quite a bit. To make things easier this indicator implements a twist: it waits for a donchian breakout in the right direction before signaling the trade. The end result is an otherwise repainting indicator with a very reliable trading signal. The donchian breakout period is entered as an input. [ Installation Guide | Update Guide | Troubleshooting | FAQ | A
FreqoMaster
Stanislav Korotky
The main idea of this indicator is rates analysis and prediction by Fourier transform. The indicator decomposes exchange rates into main harmonics and calculates their product in future. The indicator shows 2 price marks in history, depicting price range in the past, and 2 price marks in future with price movement forecast. Buy or sell decision and take profit size are displayed in a text label in the indicator window. The indicator uses another indicator as an engine for calculations - FreqoMet
Gold Bricks FX USES THE TREND WAVE INDICATOR AND IT CAN IDENTIFY THE BEGINNING AND THE END OF A NEW WAVE TREND MOVEMENT. AS AN OSCILLATOR, THE INDICATOR IDENTIFIES THE OVERBOUGHT AND OVERSOLD ZONES. IT WORKS GREAT TO CATCH THE SHORT TERM PRICE REVERSALS AND USES A MARTINGALE STRATEGY TO CLOSE ALL TRADES IN PROFIT. USE DEFAULT SETTINGS ON H1 OR HIGHER TIME FRAME ON ANY PAIR FOR MORE ACCURATE TRADES WHY THIS EA : Smart entries calculated by 4 great strategies The EA can be run on even a
This scanner is a tool used to support trading. Scanner searches on a wide market, in real time setups, created by mutual arrangements of candles (candles pattern). Its basic features are:  8 implemented trading setups (it is possible to add further setups, additional versions of the scanner),  the possibility of simultaneous scanning, all financial instruments available on the platform,  the possibility of simultaneous scanning, in all timeframes available on the platform,  the ability to manua
Intraday Levels shows intraday levels grid for intraday trading Shows a grid for the day levels, gives you a guide to know the trend and to measure intraday trades (stop-loss and take-profit). Parameters are: Levels Mode: Basic mode: Shows highest, lowest and middle levels. Advanced mode: Shows highest, lowest, middle and intermediate levels. Fibonacci mode: Shows session Fibonacci retracements levels. Momentum mode: Shows delayed Advanced levels to identify momentum. Smooth Period (Momentum
Atomic Analyst
Issam Kassas
5 (2)
Primeiramente, vale ressaltar que este Indicador de Negociação não repinta, não redesenha e não apresenta atrasos, tornando-o ideal tanto para negociação manual quanto automatizada. Manual do utilizador: configurações, entradas e estratégia. O Analista Atômico é um Indicador de Ação de Preço PA que utiliza a força e o momentum do preço para encontrar uma vantagem melhor no mercado. Equipado com filtros avançados que ajudam a remover ruídos e sinais falsos, e aumentam o potencial de negociação.
Noize Absorption Index MT4
Ekaterina Saltykova
5 (1)
Noize Absorption Index - is the manual trading system that measures the difference of pressure between bears forces and bulls forces. Green line - is a noize free index that showing curent situation. Zero value of index shows totally choppy/flat market.Values above zero level shows how powerfull bullish wave is and values below zero measures bearish forces.Up arrow appears on bearish market when it's ready to reverse, dn arrow appears on weak bullish market, as a result of reverse expectation. S
Royal Dutch Skunk
Sayan Vandenhout
ROYAL DUTCH SKUNK USES THE TREND WAVE INDICATOR AND IT CAN IDENTIFY THE BEGINNING AND THE END OF A NEW WAVE TREND MOVEMENT. AS AN OSCILLATOR, THE INDICATOR IDENTIFIES THE OVERBOUGHT AND OVERSOLD ZONES. IT WORKS GREAT TO CATCH THE SHORT TERM PRICE REVERSALS AND USES A MARTINGALE STRATEGY TO CLOSE ALL TRADES IN PROFIT. USE DEFAULT SETTINGS ON H1 OR HIGHER TIME FRAME ON ANY PAIR FOR MORE ACCURATE TRADES WHY THIS EA : Smart entries calculated by 6 great strategies The EA can be run on even a $20000
In the stock market technical analysis, support and resistance is a concept that the movement of the price of a security will tend to stop and reverse at certain predetermined price levels. Support and resistance levels can be identified on any timeframe. However, the most significant ones are found on the higher time frames, such as daily, weekly, and monthly. This indicator using the weekly OHLC data to identify the relevant levels. This is a support and resistance indicator and providing majo
The Th3Eng PipFinite indicator is based on a very excellent analysis of the right trend direction with perfect custom algorithms. It show the true direction and the best point to start trading. With StopLoss point and Three Take Profit points. Also it show the right pivot of the price and small points to order to replace the dynamic support and resistance channel, Which surrounds the price. And Finally it draws a very helpful Box on the left side on the chart includes (take profits and Stop loss
Trend Scanner
Vladimir Kalendzhyan
4.33 (6)
By purchasing this indicator, you have the right to receive a free copy of one of   my other indicator's or advisor’s!  (All future updates are included. No limits) . To get it , please contact me by  mql5 message ! The Trend Scanner trend line indicator displays the trend direction and its changes. The indicator works on all currency pairs and  timeframes. The indicator simultaneously displays multiple readings on the price chart: the support and resistance lines of the currency pair, the exist
This indicator displays pivot points in the chart, including historical vales, and supports many calculation modes for Pivot Points and S/R levels. [ Installation Guide | Update Guide | Troubleshooting | FAQ | All Products ] It plots historical levels for backtesting purposes It allows you to select the reference timeframe It implements different Pivot Point calculation modes It implements different SR calculation modes It implements customizable colors and sizes Calculation Modes The indic
The indicator displays the data of the Stochastic oscillator from a higher timeframe on the chart. The main and signal lines are displayed in a separate window. The stepped response is not smoothed. The indicator is useful for practicing "manual" forex trading strategies, which use the data from several screens with different timeframes of a single symbol. The indicator uses the settings that are identical to the standard ones, and a drop-down list for selecting the timeframe. Indicator Parame
Este é um indicador MTF dos níveis de suporte e resistência com base nos   extremos do indicador Advanced ZigZag Dynamic   e / ou   Extended Fractals   com etiquetas de preço (pode ser desativado). TFs mais altos podem ser selecionados para o modo MTF. Por padrão, os níveis são gerados com base nos pontos do indicador ZigZag. Os pontos indicadores fractais também podem ser usados em conjunto com o ZigZag ou em vez dele. Para simplificar o uso e economizar tempo de CPU, o cálculo é realizado uma
Trade with Gann on your side!! MASTER CIRCLE 360 CIRCLE CHART, originally created by Gann admitted that this is “The Mother of all charts”. It is one of the last studies that this great trader left for us. The numeric tab le is apparently quite simple like all the tables and is based on square numbers, the SQUARE OF 12 and is by evolution, one of the most important square numbers. Here we can find CYCLE, PRICE AND TIME thanks to angles and grades, to show past and future support and resistance.
Daily FIBO Pro
Mark Thimoty Evangelista
Libere Seu Potencial de Trading com o BERG Daily FIBO Pro O   BERG Daily FIBO Pro   é um poderoso e personalizável indicador de retração de Fibonacci, projetado exclusivamente para a plataforma MetaTrader 4 (MT4). Seja você um trader experiente ou esteja apenas começando, este indicador é sua ferramenta ideal para identificar níveis-chave de suporte e resistência, aprimorar sua análise de mercado e otimizar sua estratégia de trading. Por Que Escolher o BERG Daily FIBO Pro?   Precisão na Análi
Trailinator Pro MT4
Christian Opperskalski
TRAILINATOR  is a unique Solution to use different   Trailing-Stop   Variants and change your   Tradesetup   via Remotecontrol. You configure your Tradesetup for a specified Symbol only once. This setting will be used for all your Positions of the same Symbol. Currently we support these Features: different Trailing-Stops: Standard: works like you use in Metatrader Terminal, starts trailing if your profit is greater than trailing stop Start after points: trailing stop will start after your defi
Indicador. "Onda indicadora ou Indicador Ma". Usando 23 indicadores padrão e o algoritmo do autor, os níveis de compras (de 0 a +100) e vendas (de 0 a -100) são calculados. Em seguida, usando os níveis calculados, o "Indicador de onda" desenha uma onda com 21 médias móveis. O número da onda é igual ao período médio dos níveis calculados. Ondas # 1 - 7 médias móveis rápidas Ondas das médias móveis 8 -14 médias Ondas das médias móveis lentas nº 15-21 Olhando para os números desenhados
Trend Master Chart MT4
Frederic Jacques Collomb
Trend Master Chart é o indicador de tendência que você precisa. Ele se sobrepõe ao gráfico e usa codificação de cores para definir diferentes tendências/movimentos do mercado. Ele usa um algoritmo que combina duas médias móveis e osciladores diferentes. Os períodos desses três elementos são modificáveis. Funciona em qualquer período de tempo e em qualquer par. Num relance você será capaz de identificar uma tendência ascendente ou descendente e os diferentes pontos de entrada nesta tendência.
Like you when I first started trading, It was overwhelming...learning about indicators, about lotsize, leverage and many more things. Its been almost 3 years. I am more knowledgeable in trading. My trading continues to improve as I work on my strategy, technical analysis, trading psychology and trade management. One thing I am not worried about though is being able to close my trades quicky if a trade goes against me or if the trade has reached my take profit level with the help of my Close Tr
The Infinity Expert Advisor is a scalper. When the resistance and support levels are broken, trades are opened in the direction of the price movement. Open positions are managed by several algorithms based on the current market situation (fixed stop loss and take profit, trailing stop, holding positions in case of trend indication, etc.). Requirements for the broker The EA is sensitive to spread, slippages and execution quality. It is strongly recommended not to use the EA for currencies with
The main function of the indicator is to draw the target lines (support and resistance lines). The lines are plotted according to a special fractal algorithm. The lines are calculated with consideration of the zero bar. A different, more complicated calculation algorithm is used on the zero bar, in contrast to the other bars. This allows reacting to the market situation in real time, but on the other hand, redrawing is possible on the zero bar. If necessary, the zero bar can be omitted from calc
The indicator detects and displays 3 Drives harmonic pattern (see the screenshot). The pattern is plotted by the extreme values of the ZigZag indicator (included in the resources, no need to install). After detecting the pattern, the indicator notifies of that by a pop-up window, a mobile notification and an email. The indicator highlights the process of the pattern formation and not just the complete pattern. In the former case, it is displayed in the contour triangles. After the pattern is com
The Trendline Trade Panel was created to make it easier to train forex trading skills in backtester and at the same time make it easier to live trade using trendlines with the push of a button. This ea is perfect for beginners who want to learn to trade manually because all of its features are equipped with basic tools for trading forex. Other uses for Trendline Trade Panel: + Can be used to perform recovering loss positions made by other EA or positions that open manually. Fill in magic number
Os compradores deste produto também adquirem
Trade Assistant MT4
Evgeniy Kravchenko
4.43 (180)
Ajuda a calcular o risco por comércio, a fácil instalação de uma nova encomenda, gestão de encomendas com funções de fecho parcial, trailing stop de 7 tipos e outras funções úteis. Atenção, o aplicativo não funciona no testador de estratégia. Manual, Description, Download demo Função de linha Mostra no gráfico a linha de Abertura, Stop Loss, Take Profit. Com esta função é fácil definir uma nova ordem e ver as suas características adicionais antes da abertura.   Gestão de risco A função de cá
Custom Alerts é uma ferramenta versátil de monitorização de vários mercados que identifica configurações promissoras em todas as oito principais moedas (USD, CAD, GBP, EUR, CHF, JPY, AUD e NZD), bem como GOLD (XAU), todos os 28 pares de Forex e GOLD baseados nestas moedas e até sete índices como US30, UK100, WTI, Bitcoin, etc. É totalmente personalizável. A ferramenta reúne dados dos nossos indicadores FX Power, FX Volume e IX Power e notifica-o de eventos significativos.   Antes de começar,
Você acha que em mercados onde o preço pode mudar em uma fração de segundo, colocar os pedidos deve ser o mais simples possível? No Metatrader, cada vez que você deseja abrir uma ordem, você deve abrir uma janela onde você insere o preço de abertura, stop loss e take profit, bem como o tamanho da negociação. Ao negociar nos mercados financeiros, a gestão de capital é essencial para manter seu depósito inicial e multiplicá-lo. Portanto, quando você deseja fazer um pedido, provavelmente se pergunt
Local Trade Copier EA MT4
Juvenille Emperor Limited
5 (81)
Experimente uma cópia de negociação excepcionalmente rápida com o Local Trade Copier EA MT4 . Com sua fácil configuração de 1 minuto, este copiador de negociações permite que você copie negociações entre vários terminais MetaTrader no mesmo computador Windows ou em um Windows VPS com velocidades de cópia ultra rápidas de menos de 0.5 segundos. Seja você um trader iniciante ou profissional, o Local Trade Copier EA MT4 oferece uma ampla gama de opções para personalizá-lo de acordo com suas necess
Exp COPYLOT CLIENT for MT4
Vladislav Andruschenko
4.7 (61)
Copiadora comercial para MetaTrader 4. Ele copia negociações, posições e pedidos em forex de qualquer conta. É uma das melhores copiadoras comerciais  MT4 - MT4, MT5 - MT4 para a versão COPYLOT MT4  (ou MT4 - MT5 MT5 - MT5 para a versão COPYLOT MT5 ). Versão MT5 Descrição completa +DEMO +PDF Como comprar Como instalar    Como obter arquivos de log    Como testar e otimizar    Todos os produtos da Expforex Versão da copiadora para o terminal MetaTrader 5 ( МТ5 - МТ5, МТ4 - МТ5 ) -  Copylot
Trade Dashboard MT4
Fatemeh Ameri
5 (38)
Tired of complex order placement and manual calculations? Trade Dashboard is your solution. With its user-friendly interface, placing orders becomes effortless, by a single click, you can open trades, set stop loss and take profit levels, manage trade lot size, and calculate risk to reward ratios, allowing you to only focus on your strategy. Say goodbye to manual calculations and streamline your trading experience with Trade Dashboard. Download  Demo Version  right now. You can find  Details
TradePanel MT4
Alfiya Fazylova
4.91 (86)
Trade Panel é um assistente comercial multifuncional. O aplicativo contém mais de 50 funções para negociação manual e permite automatizar a maioria das ações de negociação. Antes de comprar, você pode testar a versão Demo em uma conta demo. Demonstração aqui . Instruções completas aqui . O aplicativo foi concebido como um conjunto de painéis interconectados: Painel para comércio. Projetado para realizar operações comerciais básicas: Abertura de ordens e posições pendentes. Abertura da grade de o
Trade Manager MT4 DaneTrades
Levi Dane Benjamin
4.33 (9)
Trade Manager para ajudá-lo a entrar e sair rapidamente de negociações enquanto calcula automaticamente seu risco. Incluindo recursos para ajudar a evitar negociações excessivas, negociações de vingança e negociações emocionais. As negociações podem ser gerenciadas automaticamente e as métricas de desempenho da conta podem ser visualizadas em um gráfico. Esses recursos tornam este painel ideal para todos os traders manuais e ajudam a aprimorar a plataforma MetaTrader 4. Suporte multilíngue. Vers
O MT4 para Telegram Signal Provider é uma ferramenta fácil de usar e totalmente personalizável que permite o envio de sinais para o Telegram, transformando sua conta em um provedor de sinais. O formato das mensagens é totalmente personalizável! No entanto, para uso simples, você também pode optar por um modelo predefinido e habilitar ou desabilitar partes específicas da mensagem. [ Demonstração ]   [ Manual ] [ Versão MT5 ] [ Versão Discord ] [ Canal do Telegram ] Configuração Um guia do usuá
The product will copy all telegram signal to MT4   ( which you are member  ) , also it can work as remote copier.  Easy to set up, copy order instant, can work with almost signal formats, image signal, s upport to translate other language to English Work with all type of channel or group, even channel have "Restrict Saving Content", work with  multi channel, multi MT5 Work as remote copier: with signal have ticket number, it will copy exactly via ticket number. Support to backtest signal. How to
Unlimited Trade Copier Pro is a tool to copy trade remotely to multiple MT4, MT5 and cTrader accounts at different computers/locations over internet. This is an ideal solution for you if you are a signal provider and want to copy your trades to other receivers globally on your own rules. One provider can copy trades to multiple receivers and one receiver can get trade from multiple providers as well. The provider can even set the subscription expiry for each receiver, so that receiver will not b
Custom Ultimate Sniper Dashboard
Hispraise Chinedum Abraham
5 (2)
Este painel de atiradores personalizados Ultimate Sniper Dashboard é uma actualização EA para o indicador original Ultimate Sniper Dashboard. Trabalha com até 98 algoritmos diferentes para assegurar que capta a verdadeira natureza de uma tendência numa classe de activos com que se trabalha. É uma resposta directa a muitas das sugestões e conselhos que recebemos da maioria dos nossos clientes ao longo de vários meses.   Esta versão personalizada é totalmente personalizável. Alimentada por 98
O MT4 to Discord Signal Provider é uma ferramenta fácil de usar e totalmente personalizável, projetada para enviar sinais de negociação diretamente para o Discord. Esta ferramenta transforma sua conta de negociação em um provedor de sinais eficiente. Personalize os formatos de mensagens para se adequar ao seu estilo! Para facilitar o uso, selecione entre modelos pré-desenhados e escolha quais elementos da mensagem incluir ou excluir. [ Demo ] [ Manual ] [ Versão MT5 ] [ Versão Telegram ] Confi
TPSpro Trade PRO
Roman Podpora
5 (4)
BAIXAR VERSÃO DEMO INSTRUÇÕES -       https://www.mql5.com/ru/blogs/post/758419 EM MODO DE TESTE             (no testador) funcionalidade do painel             NÃO ATIVO       . Fornecemos apenas uma exibição visual do painel em si. Uma ferramenta que pode calcular instantaneamente o tamanho da posição ou risco com base em um determinado nível de stop loss é essencial para traders profissionais e novatos. O utilitário de negociação TRADE PRO fornece cálculos rápidos e precisos, ajudando você
The News Filter
Leolouiski Gan
5 (21)
Este produto filtra todos os consultores especializados e gráficos manuais durante o horário das notícias, para que você não precise se preocupar com picos de preços repentinos que possam destruir suas configurações de negociação manuais ou negociações realizadas por outros consultores especializados. Este produto também vem com um sistema de gerenciamento de pedidos completo que pode lidar com suas posições abertas e ordens pendentes antes do lançamento de qualquer notícia. Depois de comprar o
Grid Manual MT4
Alfiya Fazylova
4.72 (18)
"Grid Manual" é um painel comercial para trabalhar com uma grade de ordens. O utilitário é universal, possui configurações flexíveis e uma interface intuitiva. Ele trabalha com uma grade de pedidos não apenas na direção da média das perdas, mas também na direção do aumento dos lucros. O trader não precisa criar e manter uma grade de pedidos, tudo será feito pelo ""Grid Manual". Basta abrir um pedido e o "Grid manual" criará automaticamente uma grade de pedidos para ele e trabalhará com ele até q
Summer 40% discount ($149 -> $88) Everything for chart Technical Analysis indicator mt4 in one tool Draw your supply demand zone with rectangle and support resistance with trendline and get alerts to mobile phone or email alert -  Risk reward indicator Video tutorials, manuals, DEMO download   here .  Find contacts on my   profile . 1.   Extended rectangles and trendlines Object will be extended to the right edge of the chart when price will draw new candles on chart. This is rectangle extend
Crosshair é uma ferramenta fantástica que simplifica a nossa análise gráfica trazendo as velas de preço perfeitamente de acordo com os valores indicadores nas subjanelas. Pode activá-lo e desactivá-lo através de uma única pressão no "C" do seu teclado, e fornece um modo de régua para medições precisas que podem ser activadas e desactivadas através da tecla "R" do seu teclado. Por favor, veja o nosso pequeno vídeo tutorial incorporado abaixo para ver como funciona.
This tool will allow you to export MetaTrader indicators data (Buffers) for any financial instrument present in your MetaTrader 4. You can download multiple Symbols and Timeframes in the same csv file. Also, you can schedule the frequency of download (every minute, 5 minutes, 60 minutes, etc.). No need to open a lot of charts in order to get the last data, the tool will download the data directly. The CSV File will be stored in the folder:   \MQL4\Files . How it works Report Tab : Select
Summer 50% discount ($199 -> $99) Advanced trading tool: One click smart orders that execute under your conditions Developed by trader for trading community:  position size calculator (lot size), open position after price action, strategy builder, set and forget trading, mobile notifications... Risk Management -  Risk percentage position size calculator, gain percentage, target risk reward ratio, spread and commissions are included in calculations 7 Advanced order types   - Set and forget tra
DrawDown Limiter MT4
Haidar, Lionel Haj Ali
5 (8)
Drawdown Limiter EA You are in the right place if you were searching for Drawdown control, Drawdown limiter, Balance protection, Equity Protection or Daily Drawdown Limit related to Prop Firm, FTMO, or Funded account trading, or if you want to protect your trading account. Have you suffered from controlling your drawdown when trading funded accounts? This EA is meant for you. Prop firms usually set a rule called “Trader Daily Drawdown”, and if it is not respected, you are disqualified.  I am an
Telegram To MT4 Receiver
Levi Dane Benjamin
5 (3)
Copie sinais de qualquer canal do qual seja membro (incluindo privados e restritos) diretamente para o seu MT4.  Esta ferramenta foi projetada com o usuário em mente, oferecendo muitos recursos que você precisa para gerenciar e monitorar as negociações. Este produto é apresentado em uma interface gráfica fácil de usar e visualmente atraente. Personalize suas configurações e comece a usar o produto em minutos! Guia do Usuário + Demonstração  | Versão MT5 | Versão Discord Se você quiser experim
Exp SafetyLock PRO
Vladislav Andruschenko
4.68 (25)
O SAFETYLOCK é a ferramenta essencial para traders que desejam proteger suas operações contra bruscas reversões de mercado. Ele automaticamente define uma ordem oposta para cada posição já aberta, criando uma camada adicional de segurança para sua estratégia. Quando um trader ou um Expert Advisor (EA) abre uma posição, o SAFETYLOCK gera uma ordem pendente oposta (hedge). Caso a posição entre em território negativo, essa ordem pendente é ativada, criando um bloqueio eficaz e minimizando possív
Trade copier MT4
Alfiya Fazylova
4.52 (29)
Trade Copier é um utilitário profissional projetado para copiar e sincronizar negociações entre contas de negociação. A cópia ocorre da conta / terminal do fornecedor para a conta / terminal do destinatário, instalada no mesmo computador ou vps. Antes de comprar, você pode testar a versão demo em uma conta demo. Versão de demonstração aqui . Instruções completas aqui . Principais funcionalidades e benefícios: Suporta a cópia de MT4> MT4, MT4> MT5, MT5> MT4, incluindo contas "MT5 netting". Os mod
RSI Divergence Scanner is a multi-timeframe and multi-symbol dashboard and alert that checks all timeframes and symbols to find divergences between price chart and RSI indicator. This divergence scanner is integrated with support and resistance zones so you can check the RSI divergences in the most important areas of the chart to find trend reversals in the price chart. Download demo version   (works on M 1,M5,M30,W1 timeframes) Full description of scanner parameters ->   click here . How to get
Layer Master Toolbox
Peter Andrew Thomas
5 (3)
GRID TRADING - Layer Master tool kit is the ultimate, easy to use trading toolkit makes it simple to layer grids of Orders over any entry level. This toolkit will make it simple and fast to Open / Enter and Manage your grid trades on MT4. Every function is simple - but clicking and dragging the order zone - you define an area you want your orders, then you can quickly drag the SL and TP levels to where you want them. Hit one button and your orders are sent!!!  Features: It is capable to send h
The top-selling EAs on the market cost a lot and one day they are suddenly gone. This is because one strategy will not work in the forex market all the time. Our product is unique from all others in the MQL Marketplace because our EA comes with 34+ built-in indicators that allow adding more strategies every time.  You build your strategy and keep updating it. If one strategy does not work, simply build another all using only one EA. This is All-In-One EA in this market place. You can use as trad
LineSyncMirrorChart
Vitaly Muzichenko
5 (2)
O indicador de correlação e divergência de pares de moedas - todos os pares na mesma tabela de preços. Exibe todos os pares que estão abertos no terminal. Versão MT5 Vantagens Os negociantes que usam estratégias de negociação em várias moedas podem observar visualmente o movimento dos preços de pares selecionados no mesmo gráfico de preços, a fim de comparar os parâmetros de seus movimentos. Esta é uma versão avançada e estendida do indicador OverLay Chart É um assistente bastante efi
RedFox Copier Pro
Rui Manh Tien
4.73 (11)
FREE SIGNAL CHANEL:  https://t.me/redfox_daily_forex_signals Time saving and fast execution Whether you’re traveling or sleeping, always know that Telegram To Mt4 performs the trades for you. In other words, Our   Telegram MT4 Signal Trader  will analyze the trading signals you receive on your selected Telegram channels and execute them to your Telegram to MT4 account. Reduce The Risk Telegram To Mt4   defines the whole experience of copying signals from   Telegram signal copier to mt4  p
VirtualTradePad mt4 Extra
Vladislav Andruschenko
4.88 (57)
Painel de negociação para negociação em 1 clique.  Trabalhando com posições e pedidos!  Negociar a partir do gráfico ou do teclado. Usando nosso painel de negociação, você pode negociar com um clique no gráfico e realizar operações de negociação 30 vezes mais rápido do que o controle MetaTrader padrão. Cálculos automáticos de parâmetros e funções que tornam a vida mais fácil para um trader e ajudam-no a conduzir suas atividades de trading com muito mais rapidez e conveniência. Dicas gráficas e
Mais do autor
Copier4Fee Advanced
Vladimir Tkach
4.78 (18)
The utility copies trades from the signal provider accounts (master accounts, one or multiple providers) to unlimited number of receiver accounts (slave accounts).  Attention! Y ou need to use identifiers (Provider number) of the same length if you use several master copiers. For example. 1, 2, 3 or 11, 13, 22. The copying can be set in the opposite direction. The comments with all the recently performed actions are displayed on the screen to monitor the utility actions in slave mode. To avoid p
The utility copies trades from the signal provider accounts (master accounts, one or multiple providers) to unlimited number of receiver accounts (slave accounts). The provider is defined by the 'provider' parameter (any combination of numbers and letters). For example, there are two providers. Run the utility in master mode on them, and set different values to the provider parameter. On the account designated for copying these signals, run two utilities in slave mode in different windows, setti
LossLess Neuron
Vladimir Tkach
4 (7)
The Expert Advisor receives signals from an artificial neural network that uses the RSI indicator. Trades are closed by the opposite signals. Presence of a signal is checked at the closing of the bar. The EA also has the following functions: changing a position volume in proportion to the change in balance (function for the tester); transfer of unprofitable trades into breakeven; Parameters Start with lot - initial position volume increased in proportion to the balance change; Lotsize by balan
FREE
The indicator analyzes the change in the minimum and maximum prices of the previous bars fixing the entrance of the big players. If the change (delta) increases, a signal is displayed on the graph in the form of an arrow. At the same time, virtual trade on history is carried out. In the free version, virtual trade is performed without refills in case of a repeat of the signal. The results of virtual trading in the form of losses / losses, profitability, drawdown and transaction lines are display
FREE
Plot results
Vladimir Tkach
4 (4)
The indicator displays on a chart trading results. You can configure the color and font of displayed results, as well as filter trades based on the magic number. If multiple trades were closed within one bar of the current timeframe, the result is summed and output in one value. Utility parameters Plot profit in - the format of output results: wither in deposit currency taking onto account commission and swap, or in points. Start from - start processing data at the specified time. Plot last de
FREE
The Expert Advisor trades the signals from an artificial neural network. Network with one hidden layer. Presence of a signal is checked at the closing of the specified period, which significantly increases the optimization and testing speed. It differs from the previous version by a number of additional features: works with pending orders; subsequent trades are opened with a lot increased by the specified step; moves the trade to breakeven a specified time after it was opened; closes trades at t
The utility searches the price history looking for the pattern similar to the one within a specified interval. The length of a pattern and a specified interval is the same and set in bars. Similarity is estimated by comparing the bars' body colors, size and shadows. The subsequent price movement is displayed as lines for all detected patterns. The color of the lines defines the degree of similarity. The movement length is set as a number of bars. Search for patterns and visualization are perform
FREE
Plot Spread
Vladimir Tkach
The indicator reads the current spread and displays it on the chart. The maximum value, the minimum value, the value at the time of opening the bar and the maximum value divided by 10 are displayed separately.  The indicator does not remember these values so the data will be lost if there is a change in the timeframe. The indicator is useful for analyzing market volatility, comparing the spread between brokers and different types of accounts. By default: Red line - maximum spread; Green bar
FREE
The indicator displays the trading statistics of the analyzed Market signal on the chart. Signal transaction data is presented in an excel (csv) file and can be taken from the Signal>Trading history ( Export to CSV:  History ). The copied file must be saved to the directory MT4>File>Open Data Folder>MQL4>Files.  Available color management and font output.  If the currency names are different on the Signal and User accounts, use the Prefix and Suffix parameters. Utility options Prefix at Signal -
FREE
Levels Work
Vladimir Tkach
This EA trades support/resistance levels which were placed by a trader (Trend Line from toolbar). The direction of a trade is set graphically by arrows: ↑ - buy; ↓ - sell; - buy or sell in case of crossing support/resistance level. The level is off if inconsistent directions were set, like: ↑↓, ↑, or ↓. If the price is lower than a level it is a resistance level. And opposite is true for support level. There are a few methods available for levels defining, for testing with visualization as
The Expert Advisor trades the signals from an artificial neural network with one hidden layer. Presence of a signal is checked at the closing of the specified period. MAIN PARAMETERS Net option - setting the order grid. When placing a market (not pending, Pending order offset=0 ) order according to a signal, the grid order is set. The following direction are available: follow the trend , against the treand and both directions . The number of placed orders is taken from the ...maximum deals with
This utility searches the history for price patterns, which are similar to those present in the intervals selected by trader (there are several intervals, see the screenshot). The length of the pattern and selected intervals is the same and is given by the number of bars. The similarity is estimated by comparing the colors of bar bodies, sizes of bars' bodies and wicks. For all identified patterns, further movement of the price is visualized as lines. The color of lines determines the degree of
Follow Move
Vladimir Tkach
The Expert Advisor opens a trade in the direction of the previous price movement or in the opposite direction (selectable). The previous direction is determined based on the chosen time interval. The interval can be set to trading session hours and thus to check the theory that the price is inactive after session close. Multiple trades can be open at a time depending on input parameters. The Expert Advisor trails the stop loss order, and is provided with multiple breakeven and trade closing func
Trend Chaser
Vladimir Tkach
The Expert Advisor opens a trade in the specified direction at the specified time. If the price moves in the profit direction, additional trades are opened after a preset step. Trade are closed by a Stop Loss or upon reaching a target profit. The Expert Advisor trails the stop loss order, and is provided with multiple breakeven and trade closing functions (See the description of the parameters). Test and optimize the EA in the Tester using M1 open prices. The EA parameters can be controlled via
The indicator calculates the historic price statistics: the number of intersections of a level and the number of rollbacks. The levels are set as horizontal lines (the 'Horizontal lines' element on the Toolbar) manually, are are drawn automatically by the indicator with the specified step. Only strong levels are drawn in the automated mode. There are two options for the automated mode: 1. Strong levels of intersection and support/resistance; 2. Strong support/resistance levels. The indicator use
The indicator analyzes the change in the minimum and maximum prices of the previous bars fixing the entrance of the big players. If the change (delta) increases, a signal is displayed on the graph in the form of an arrow. At the same time, virtual trade on history is carried out. In case of a repeat of the signal, the positions are increased (refilling). Thus the lot of positions can differ. The results of virtual trading in the form of losses / losses, profitability, drawdown and transaction li
Lucky Shot
Vladimir Tkach
The cut release of Top Signals Strategy EA for less price. With default parameters EA works in Assian session and scalps market. EA opens trades by RSI indicator signals in a specified time interval. In the case of a repetition of the signal opens a unidirectional transaction. The number of transactions per day can be limited. Revolves trades on the opposite signal. Displays information on trade and its results. Also you can set virtual stop loss and take profit. Telegram channel for discation p
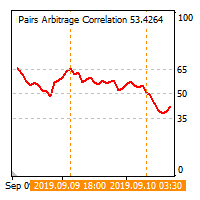
The cross-correlation indicator calculates the relationship between the specified pairs for the previous period. Automatically selects the instruments with the highest and the lowest correlation, and then simulates trading on the selected pairs on the same test period. Then indicator displays the pairs that have shown the best trading results. Visualizes the PAC (Pairs Arbitrage Correlation) criterion for the pairs selected by the trader. The signal to open trades is set by the PAC levels. When
PAC man
Vladimir Tkach
EA trades pairs selected by correlation criterion. The choice is made in such a way that there are pairs with negative and neutral correlation to the main pair. The PAC indicator is used to automate the selection of pairs  https://www.mql5.com/en/market/product/41985 Expert is multycurrency, thus it is no use to test it in the MT4 terminal. So, watch for real signal and joing to telegram channel. After setting the pairs, the expert Advisor simulates trading for the previous period with visualiz
Junior PAC man
Vladimir Tkach
Simplified release of PACman EA. Expert is multycurrency, thus it is no use to test it in the MT4 terminal. So, watch for real signal and joing to telegram channel. After setting the pairs, the expert Advisor simulates trading for the previous period with visualization of the results. The user can interactively change the signal levels and observe their impact on the simulation result. In this way, you can select the optimal level values. By manually moving the vertical boundary lines to the ri
Dublicator
Vladimir Tkach
Simple and fast trade duplicator that copies trades on the same account with the reverse function. The reverse can be used for locking. You can choose to duplicate transactions for the current or all instruments.  Parameters Duplicate in reverse - the direction of duplication; Duplicate symbol - duplicate the selected tool; Manual lot size - hand size of the volume; Do not duplicate if spread > - do not duplicate a trade if the current spread is larger; List of magic to be duplicated - fi
Indicator shows the price history. The history is read for vertical lines and output for the main line. Those lines are the time cursors. You can use the indicator to analyze the price cycle over time, thereby predicting its movement. The duration of the forecast and the number of time cursors can be set in the indicator parameters. Additionally, you can link the main line to a new bar. Lines can be moved manually. Analyze the cyclical nature of the market using this indicator. Indicator pa
What If
Vladimir Tkach
This expert Advisor uses the saved trading history to repeat trades in the strategy tester. Meanwhile you can set other values for take profit, stop loss, and closing time. Thus, you can check how the results of trading with other parameters would look like. The best set of parameters can be obtained using the strategy optimizer in the MT4 terminal. In addition, you can find out how the results of trading would be affected by the later opening of trades when the price went to the loss side. You
Filtro:
makita
414
makita 2020.10.21 00:56 
 

O usuário não deixou nenhum comentário para sua avaliação

Leticia Tizon Monsalve
275
Leticia Tizon Monsalve 2018.12.12 14:43 
 

O usuário não deixou nenhum comentário para sua avaliação

Erdinç Yıldız
539
Erdinç Yıldız 2018.07.20 19:54 
 

O usuário não deixou nenhum comentário para sua avaliação

Responder ao comentário