Three simple lines
- Utilitários
- Valeriy Medvedev
- Versão: 1.1
- Atualizado: 23 março 2018
- Ativações: 5
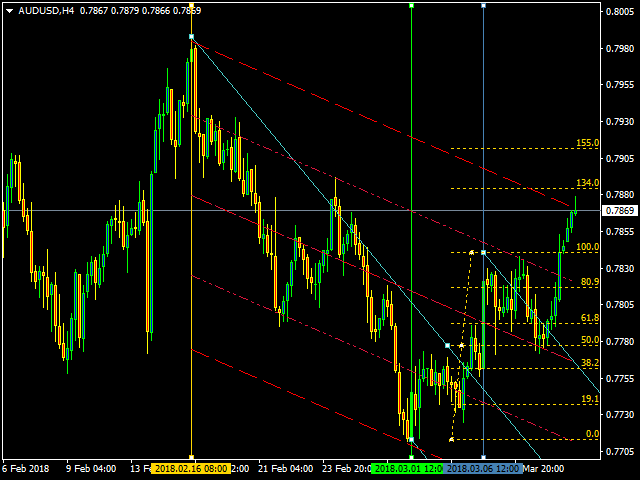
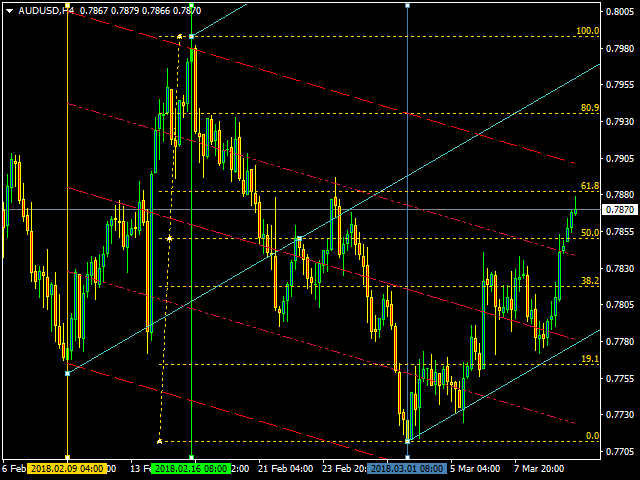
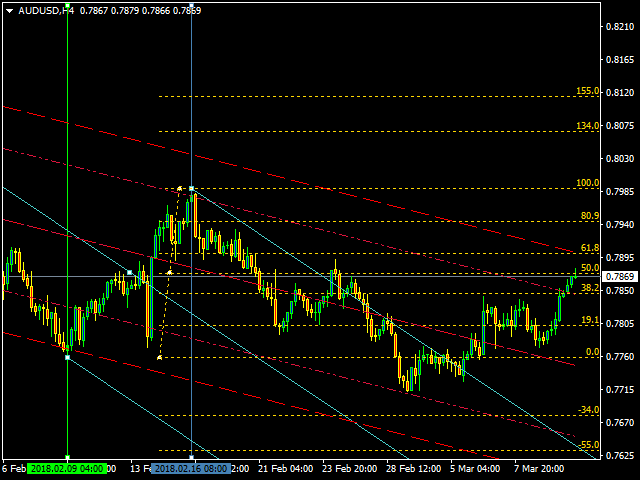
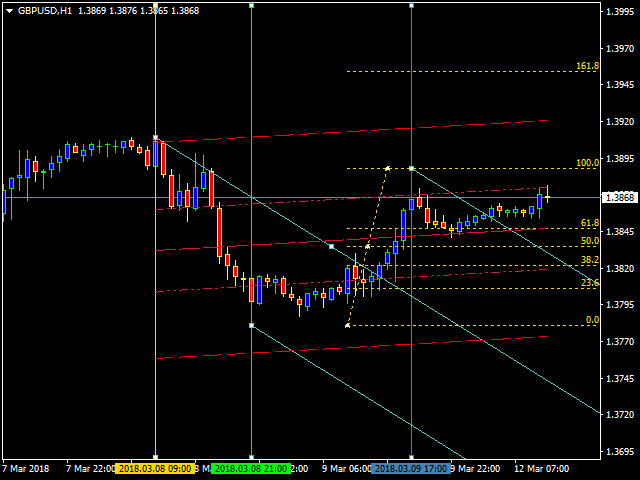
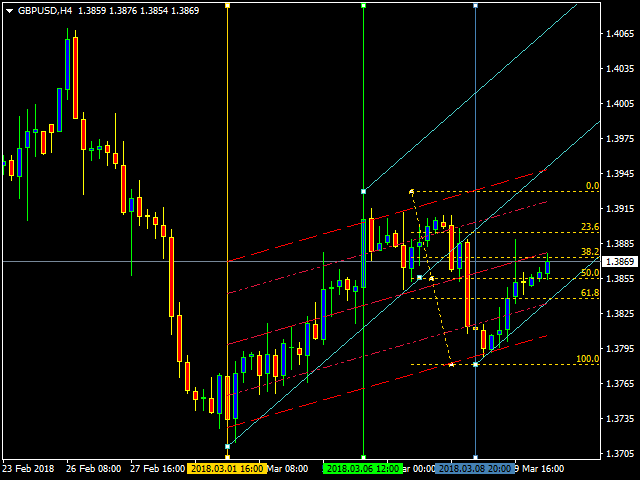
This is an individual tool for analyzing the market situation. It is very simple to use. After attaching the indicator to the chart, you will see three vertical lines named "VLine 1", "VLine 2" and "VLine 3", following in this order from left to right. For the utility to operate correctly, this sequence should always be observed. Please note: at the first start, the lines are not bound to specific price levels on the chart. This should be done by user in accordance with the following rule: if line 1 is set to identify a bottom, the line 2 should be set at the top, and line 3 should be placed similar to the first one, at the bottom. This is similar to a LOW-HIGH-LOW zigzag. In case a top at the line 1 is selected as the start, the sequence should be: HIGH-LOW-HIGH. The advantage of this approach is that users define the tops and bottoms for analyzing the market situation themselves. The indicator is equipped with the ability to plot such graphical tools as Andrews pitchforks, two types of Fibonacci levels, as well as linear regression and standard deviation channels. Each section of indicator parameters has a corresponding label, and the settings are reduced to the minimum required for their display.
Parameters
- ___| Line — vertical line display section:
- Line 1 Color — color of line 1.
- Line 2 Color — color of line 2.
- Line 3 Color — color of line 3.
- Line Style — line display style.
- Line Thickness — line width.
- Delete lines? — delete the lines when the timeframe is changed or when the indicator is removed.
- ___| Pitchfork — Andrews' Pitchfork display section:
- Fitting Pitchfork — plot Andrews' Pitchfork, enabled by default.
- Color Pitchfork — color of Andrews' Pitchfork.
- ___| Fibo — Fibonacci level display section:
- Inclusion levels Fibo — plot Fibonacci levels, enabled by default.
- Installing Fibo levels — plot type: standard (default) or Bobokus.
- Distance pips to turn Fibo levels — the minimum profit in pips required for plotting, default is 60.
- Color Fibo Levels — color of Fibonacci levels.
- ___| Linear Regression Channel — linear regression channel display section:
- Inclusion Linear Regression Channel — plot linear regression channel, enabled by default.
- Channel color — channel line color.
- Style of channel lines — channel line style.
- Width of channel lines — channel line width.
- Channel's continuation to the right — extend the channel to the right, disabled by default.
- ___| Standard Deviation Channel — standard deviation channel display section:
- Standard Deviation Channel - plot standard deviation channel, enabled by default.
- Deviation — deviation, default is 1.0;
- Channel color — channel line color.
- Style of channel lines — channel line style.
- Width of channel lines — channel line width.
- Channel's continuation to the right — extend the channel to the right, disabled by default.



















O usuário não deixou nenhum comentário para sua avaliação