TickDelta
- Indicadores
- Andrey Gladyshev
- Versão: 1.3
- Atualizado: 19 setembro 2021
- Ativações: 5
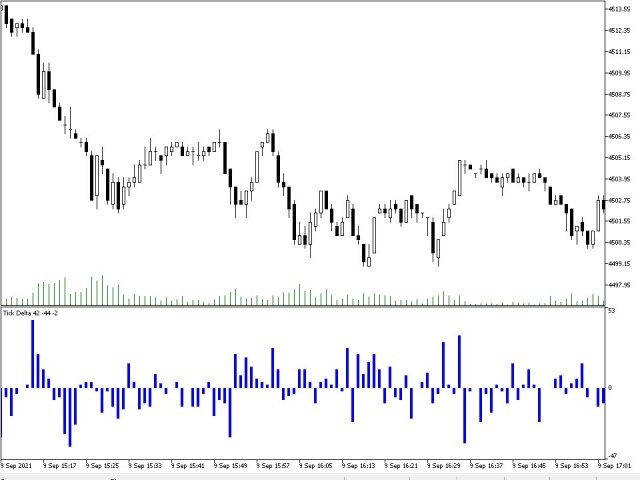
The TickDelta indicator shows the difference in the number of oscillations of the best prices per unit of time. In this case, the unit of time is the specified timeframe (M1, M2, M5, M15, etc.). This value indirectly shows the market "sentiment". Due to the "tick-wise" nature, the indicator is more appropriate for use in scalping strategies. When applied in conjunction with real volumes and monitoring of various instrument charts, it is possible to identify certain reversal setups. In some cases, the indicator will point at trend continuation. The indicator can be applied for autotrading or for automated search for market regularities at the initial stage, using it in a custom program for analysis.
The tick delta can also be applied in conjunction with other indicators for filtering the market entry signals. It all depends on the way the indicator application is considered and how a trader uses it.
The indicator settings are simple and consist of selecting the histogram color and column width selection. The first version has a limitation. It does not save the tick history. Therefore, when switching timeframes or modifying the indicator settings, the countdown will start anew. This shortcoming will be fixed in the next version.
Do not confuse the indicator values with the real delta, which is related to the performed buy and sell deals.

