• Visão global
  • Comentários (8)
  • Discussão (12)
  • O que há de novo

Dashboard RSI Multicurrency for MT5

4.83
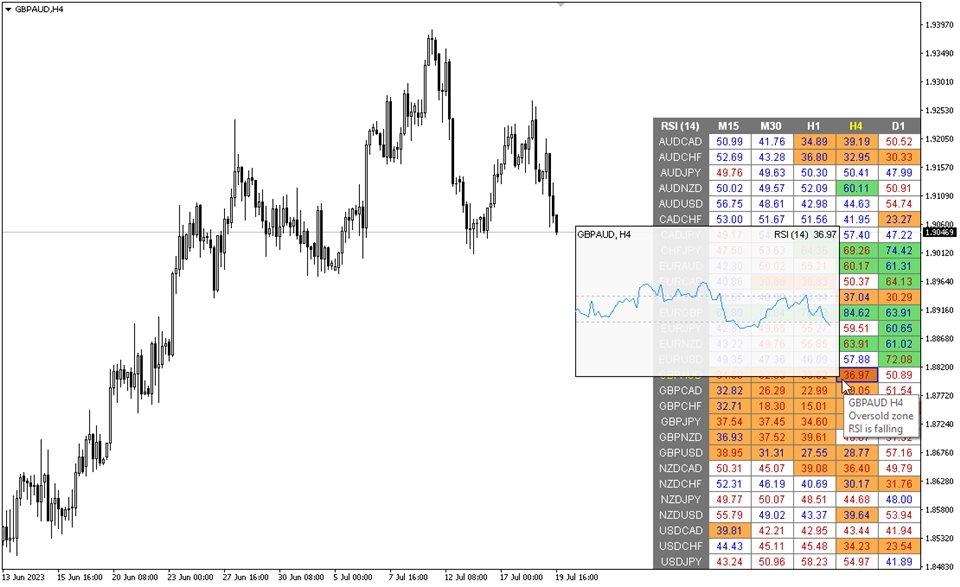
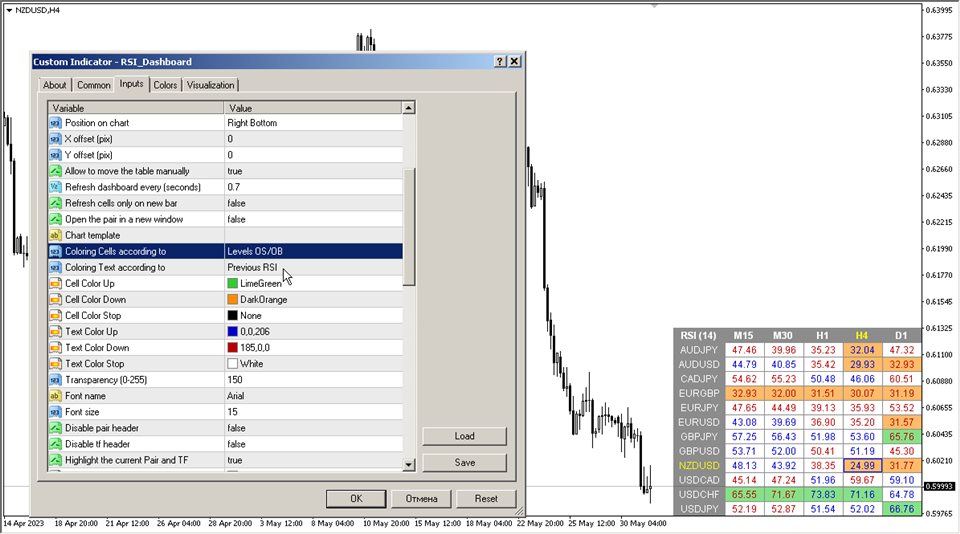
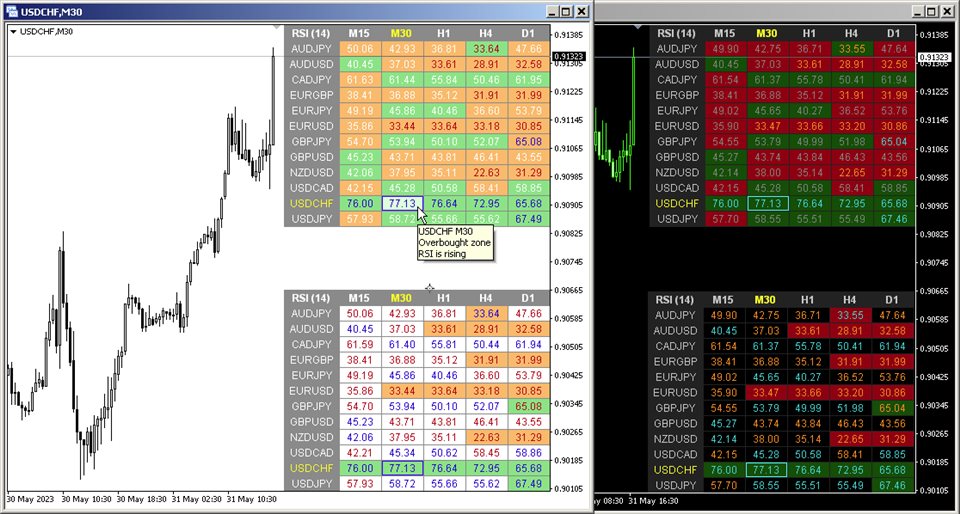
Modificação multimoeda e multitimeframe do indicador Índice de Força Relativa (RSI). Você pode especificar quaisquer moedas e prazos desejados nos parâmetros. Além disso, o painel pode enviar notificações ao cruzar níveis de sobrecompra e sobrevenda. Ao clicar em uma célula com ponto final, este símbolo e ponto final serão abertos. Este é o scanner MTF.

A chave para ocultar o painel do gráfico é “D” por padrão.

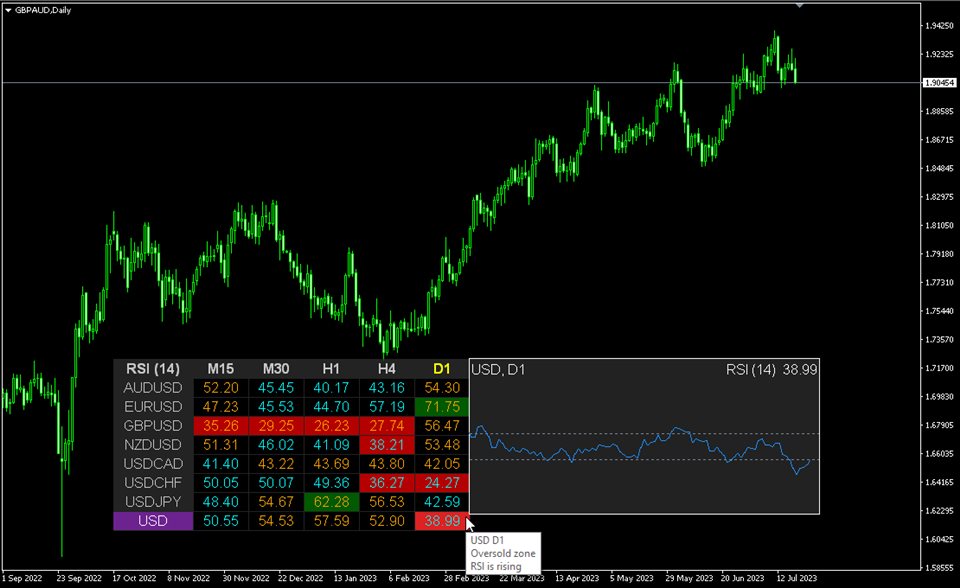
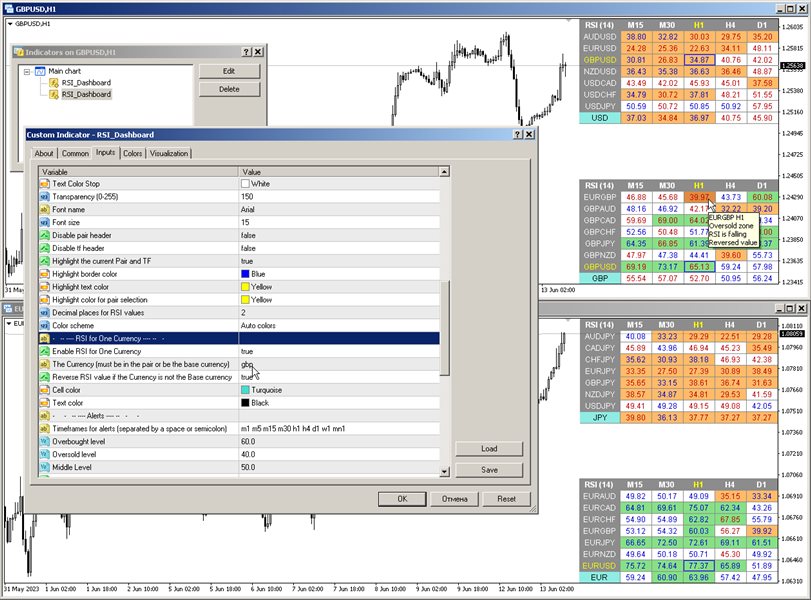
Semelhante ao Medidor de Força da Moeda, o Painel pode selecionar automaticamente pares que contenham uma moeda específica ou aqueles pares que tenham essa moeda como moeda base. O indicador procura Moeda em todos os pares especificados no “Conjunto de Pares”; outros pares são ignorados. E com base nesses pares, o RSI total para esta moeda é calculado. E você pode ver quão forte ou fraca é essa moeda.


Parâmetros

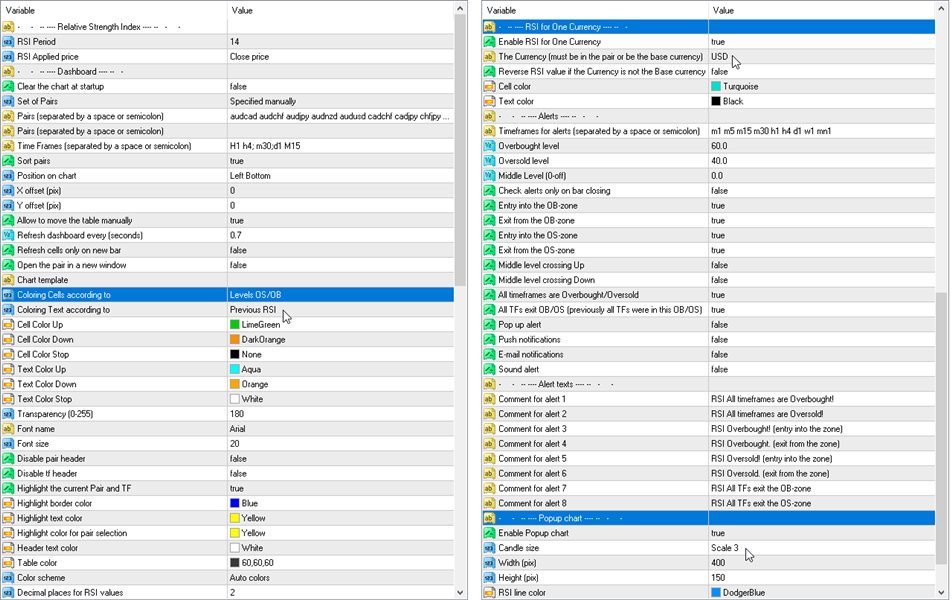
RSI Period — período médio.
RSI Applied price — tipo de preço.
Clear the chart at startup — limpe o gráfico na inicialização.
Set of Pairs — conjunto de símbolos
— Market Watch — pares do "Market Watch".
— Specified manually — pares especificados manualmente, nos parâmetros "Pares".
— Current pair — mostra apenas o par atual.
Pairs (separated by a space or semicolon) — lista de símbolos separados por espaço ou ponto e vírgula. Os nomes das moedas devem ser escritos exatamente como os da corretora, mantendo a caixa e o prefixo/sufixo.
Time Frames (separated by a space or semicolon) — lista de prazos separados por espaços ou ponto e vírgula (vários prazos).
Sort pairs — classificando a lista de pares.
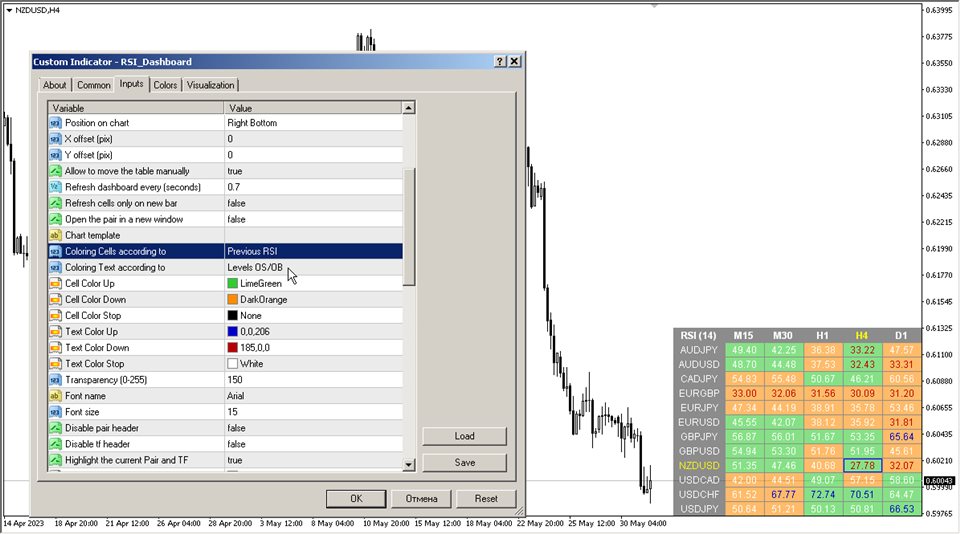
Position on chart — canto para exibir o painel no gráfico.
X offset (pix) — desloca o painel ao longo do eixo X;
Y offset (pix) — desloca o painel ao longo do eixo Y;
Refresh dashboard every (seconds) — período de atualização para todos os pares e intervalos de tempo.
Refresh cells only on new bar — as atualizações (e alertas) das células só ocorrerão quando uma nova barra aparecer.
Open the pair in a new window — abra um símbolo em uma nova janela do gráfico clicando.
Chart template — o nome do modelo do gráfico, se o gráfico for aberto em uma nova janela.
Coloring the cells according to the — pinte as células da tabela de acordo com os níveis de sobrecompra/sobrevenda ou de acordo com a direção da vela anterior.
Color Up — cor da célula se o indicador aumentar.
Color Down — cor da célula se o indicador diminuir.
Color Stop — cor da célula se o indicador não mudar.
Transparency (0-255) — transparência do painel.
Font name — nome da fonte.
Font size — tamanho da fonte.

Alertas
Timeframes for alerts (separated by a space or semicolon) — lista de períodos para os quais o alerta será enviado (separados por espaço ou ponto e vírgula).
Overbought level — nível de sobrecompra para alertas.
Oversold level — nível de sobrevenda para alertas.
Middle Level — Nível médio
Check alerts only on bar closing — verifique a passagem de nível somente após o fechamento da barra.
Entry into the OB-zone — Entrada na zona OB
Exit from the OB-zone — Sair da zona OB
Entry into the OS-zone — Entrada na zona do sistema operacional
Exit from the OS-zone — Sair da zona do sistema operacional
Middle level crossing Up — Passagem de nível médio para cima
Middle level crossing Down — Passagem de nível médio para baixo
Alert when RSI direction changes — Alerta quando a direção do RSI muda
All timeframes are Overbought/Oversold — Todos os prazos estão sobrecomprados/sobrevendidos
All TFs exit OB/OS (previously all TFs were in this OB/OS) — Todos os TFs saem do OB/OS (anteriormente todos os TFs estavam neste OB/OS)
Pop up alert — alerta pop-up.
Push notifications — notificação push.
E-mail notifications — notificação por e-mail.
Sound alert — sound alert — alerta sonoro.


Comentários 8
Adz trading
139
Adz trading 2024.02.16 12:08 
 

Ajout des alertes du changement de direction du Rsi c est le top en plus du monitoring, multi symbol, multi times frime ❤️

Mike Louw
294
Mike Louw 2022.10.12 15:54 
 

Multi currency RSI dash is a great indicator to find extended market conditions, all in one place. I also use it as a mini operating system which is compact and can be nestled into a corner of a chart. Instead of having to drag symbols manually from the Market Watch window or switch between profiles, just click on any pair in the dash and the symbol changes instantly. With multiple timeframe windows, add a free ChartSync indicator and all change simultaneously. Parameter settings are extensive and the author is very accommodating. With version 3.2, I can highlight the name of a pair/s and make my own watch list. No more fumbling around...Thank you!

Multi Disipliner
352
Multi Disipliner 2022.02.21 21:26 
 

very nice. thanks

Produtos recomendados
Noize Absorption Index - is the manual trading system that measures the difference of pressure between bears forces and bulls forces. Green line - is a noize free index that showing curent situation. Zero value of index shows totally choppy/flat market.Values above zero level shows how powerfull bullish wave is and values below zero measures bearish forces.Up arrow appears on bearish market when it's ready to reverse, dn arrow appears on weak bullish market, as a result of reverse expectation.
KopierMaschine - локальный копировщик сделок между различными счетами MetaTrader 4 и MetaTrader 5 в любом направлении расположенных на одном компьютере с интуитивно понятным интерфейсом. Направления копирования: MT4 --> MT5 MT4 --> MT4 MT5 --> MT5 MT5 --> MT4 для копирования между терминалами MetaTrader 4 и   MetaTrader   5 необходимо приобрести версию продукта   KopierMaschine  для    MetaTrader  4 Особенности Программа работает в двух режимах Master и Slave На один подчиненный счет можно коп
O nível Premium é um indicador único com mais de 80% de precisão nas previsões corretas! Este indicador foi testado pelos melhores Especialistas em Negociação por mais de dois meses! O indicador do autor você não encontrará em nenhum outro lugar! A partir das imagens você pode ver por si mesmo a precisão desta ferramenta! 1 é ótimo para negociar opções binárias com um tempo de expiração de 1 vela. 2 funciona em todos os pares de moedas, ações, commodities, criptomoedas Instruções:
Magic Finger can help you identify trends and trading opportunities clearly. The finger points to the open position signal, and the discoloration line is confirmed by the trend. If you are a day trader, you can choose to trade during a period of active trading, referring to the discoloration line as the basis for the next order, finger signal as a filter. If you are a trend trader, you can choose a period above H1, wait for the appearance of the finger signal in the key price area, and enter t
Owl Smart Levels MT5
Sergey Ermolov
4.07 (28)
Versão MT4  |  FAQ O Indicador Owl Smart Levels é um sistema de negociação completo dentro de um indicador que inclui ferramentas populares de análise de mercado, como fractais avançados de Bill Williams , Valable ZigZag que constrói a estrutura de onda correta do mercado e níveis de Fibonacci que marcam os níveis exatos de entrada no mercado e lugares para obter lucros. Descrição detalhada da estratégia Instruções para trabalhar com o indicador Consultor de negociação Owl Helper Chat privado d
PipFinite Exit EDGE MT5
Karlo Wilson Vendiola
4.86 (29)
Did You Have A Profitable Trade But Suddenly Reversed? In a solid strategy, exiting a trade is equally important as entering. Exit EDGE helps maximize your current trade profit and avoid turning winning trades to losers. Never Miss An Exit Signal Again Monitor all pairs and timeframes in just 1 chart www.mql5.com/en/blogs/post/726558 How To Trade You can close your open trades as soon as you receive a signal Close your Buy orders if you receive an Exit Buy Signal. Close your Sell orde
Crash 1000 Scalping Indicator for the Crash 1000 Deriv Synthetic Index. Introduction The Crash 1000 Scalping Indicator is a specialized tool designed for the Crash 1000 index on the Deriv Synthetic market. This indicator is particularly useful for scalping on the M1 timeframe, helping traders to identify precise entry and exit points for buy positions. It is designed to be non-repainting, providing clear signals with audible alerts and push notifications, and is compatible with mobile devices th
An indicator of pattern #31 ("Long Island") from Encyclopedia of Chart Patterns by Thomas N. Bulkowski. The second gap is in the opposite direction. Parameters: Alerts - show alert when an arrow appears   Push - send a push notification when an arrow appears (requires configuration in the terminal) GapSize - minimum gap size in points ArrowType - a symbol from 1 to 17 ArrowVShift - vertical shift of arrows in points   ShowLevels - show levels ColUp - color of an upward line ColDn - color of a
Volality Index Scalper
Lesedi Oliver Seilane
5 (1)
Volality Index scalper indicator  Meant for Volality pairs such as Volality 10, 25, 50, 75 and 100 The indicator works on all timeframes from the 1 minute to the monthly timeframe the indicator is non repaint the indicator has 3 entry settings 1 color change on zero cross 2 color change on slope change 3 color change on signal line cross Orange line is your sell signal Blue line is your buy signal.
Wave Trend MT5
Diego Arribas Lopez
MT4 Version Wave Trend MT5 Wave Trend is an oscillator, which helps identifing in a extremely accurate manner market reversals. The Oscillator being obove the overbought level and a cross down of the fast into the slow MA usually indicates a good SELL signal. If the oscillators is below the oversold level and the fast MA crosses over the slower MA usually highlights a good BUY signal. The Wave Trend indicator can be also used when divergences appear against the price, indicating the current move
To get access to MT4 version please click here . - This is the exact conversion from TradingView: "Stochastic Momentum Index" By "UCSgears". - This is a popular version of stochastic oscillator on tradingview. - This is a light-load processing and non-repaint indicator. - Buffers are available for the lines on chart. - You can message in private chat for further changes you need. Thanks for downloading
SSL Indicator
Tiago Azevedo Amorim Martins
SSL Indicator for MetaTrader 5 - Powerful Trend-Following Tool The SSL Indicator is a highly efficient and reliable trend-following tool designed to help traders identify market trends with ease and precision. Based on moving averages, the SSL (Step Stop Line) Indicator changes color and provides clear visual cues when there is a potential trend reversal. This tool is excellent for traders looking to capitalize on strong market trends while avoiding false signals commonly found in ranging market
Supply and Demand Pro
Godbless C Nygu
4 (1)
Join Deriv link on profile>>> GET THIS FULL COPY AND GET ANOTHER FREE INDICATOR ONE OF THE BEST AND USEFULL INDICATORS IN THE WORLD ..This is the one of the best usefull indicators which has chosen to be used by top traders in the world. AUTOMATIC SUPPORT AND RESISTANCE This way of trading is also called Supply and demand, On this way of trading you can see auto colours appear where the market changes direction buying or selling Direction. ALL KIND OF PAIRS METALS AND INDICIES ARE INCLUDE
Cumulative delta indicator As most traders believe, the price moves under the pressure of market buying or selling. When someone redeems an offer standing in the cup, the deal is a "buy". If someone pours into the bid standing in the cup - the deal goes with the direction of "sale". The delta is the difference between purchases and sales. A cumulative delta - the difference between the cumulative sum of purchases and sales for a certain period of time. It allows you to see who is currently contr
Fibo Channels
Jeffrey Quiatchon
Fibo Daily Channel Indicator The  Indicator is a powerful tool for traders, providing precise daily support and resistance levels based on Fibonacci retracement and extension calculations. This indicator automatically draws key pivot points (PP, R1, R2, S1, S2) as well as additional extension levels (R3, R4, S3, S4), helping traders identify potential reversal and breakout zones with ease. It includes customizable alerts and push notifications, allowing traders to receive updates whenever the pr
Trading Utility for Forex Currency Pairs Only not for Gold  Functions Auto Lot Calculation based on Risk Auto stoploss  Auto TakeProfit Breakeven Auto Close Half % Close in percentage with respect to the PIPs Pending Orders BuyLimit Sell Limit with distances BuyStop Sell Stop    with distances Trading Informations Risk in percentage For Multiple trades Combine Takeprofit and Combine Stoplosses
Laguerre SuperTrend Clouds   adds an Adaptive Laguerre averaging algorithm and alerts to the widely popular SuperTrend indicator. As the name suggests,   Laguerre SuperTrend Clouds (LSC)   is a trending indicator which works best in trendy (not choppy) markets. The SuperTrend is an extremely popular indicator for intraday and daily trading, and can be used on any timeframe. Incorporating Laguerre's equation to this can facilitate more robust trend detection and smoother filters. The LSC uses the
Atomic Analyst MT5
Issam Kassas
4.28 (18)
Primeiramente, vale ressaltar que este Indicador de Negociação não repinta, não redesenha e não apresenta atrasos, tornando-o ideal tanto para negociação manual quanto automatizada. Manual do utilizador: configurações, entradas e estratégia. O Analista Atômico é um Indicador de Ação de Preço PA que utiliza a força e o momentum do preço para encontrar uma vantagem melhor no mercado. Equipado com filtros avançados que ajudam a remover ruídos e sinais falsos, e aumentam o potencial de negociação.
Introducing the Power Trade Plus indicator designed by a small group of traders with a few years of experience trading the market profitably.  The Power Trade Plus is derived from the Power Trade indicator,  the indicator strive in powerful sniper entries and take profit levels,  with an algorithm that's can determine the markets volatility and Provides entries based on the current market volatility. This indicator is much more effective in stock ,currencies and indices.
Was: $249  Now: $99   Market Profile defines a number of day types that can help the trader to determine market behaviour. A key feature is the Value Area, representing the range of price action where 70% of trading took place. Understanding the Value Area can give traders valuable insight into market direction and establish the higher odds trade. It is an excellent addition to any system you may be using. Inspired by Jim Dalton’s book “Mind Over Markets”, this indicator is designed to suit the
Elder SafeZone Long
Financial Trading Seminars Inc.
SafeZone is a method for setting stops on the basis of recent volatility, outside the level of market noise. It is described in "Come into my Trading Room" book. In an uptrend, SafeZone defines noise as that portion of the current bar that extends below the low of the previous bar, going against the prevailing trend. It averages the noise level over a period of time and multiplies it by a trader-selected factor. For long trades, SafeZone subtracts the average noise level, multiplied by a facto
A Gann Box (ou Gann Square) é um método de análise de mercado baseado no artigo "Fórmula matemática para previsões de mercado" de WD Gann. Este indicador pode representar três modelos de Quadrados: 90, 52(104), 144. Existem seis variantes de grades e duas variantes de arcos. Você pode plotar vários quadrados em um gráfico simultaneamente. Parâmetros Square — seleção de um modelo quadrado: 90 — quadrado de 90 (ou quadrado de nove); 52 (104) — quadrado de 52 (ou 104); 144 — quadrado universal
HMA Trend Professional MT5
Pavel Zamoshnikov
4.25 (4)
Improved version of the free HMA Trend indicator (for MetaTrader 4) with statistical analysis. HMA Trend is a trend indicator based on the Hull Moving Average (HMA) with two periods. HMA with a slow period identifies the trend, while HMA with a fast period determines the short-term movements and signals in the trend direction. The main differences from the free version: Ability to predict the probability of a trend reversal using analysis of history data. Plotting statistical charts for analyz
O indicador cria cotações atuais, que podem ser comparadas com as históricas e, com base nisso, fazer uma previsão do movimento dos preços. O indicador possui um campo de texto para navegação rápida até a data desejada. Opções: Símbolo - seleção do símbolo que o indicador exibirá; SymbolPeriod - seleção do período do qual o indicador coletará dados; IndicatorColor - cor do indicador; HorisontalShift - deslocamento das cotações desenhadas pelo indicador pelo número especificado de
Super Magic NASDAQ100
Benyamin Naser Mokhtari Karchegani
O indicador que você tem em mãos é, sem dúvida, uma das melhores ferramentas para operar no mercado do NASDAQ 100 em intervalos de tempo de 1 minuto e 5 minutos. Este indicador também funciona em outros intervalos de tempo, mas foi projetado especificamente para esses dois. Ele foi desenvolvido com alta precisão e não requer configurações iniciais. Basta executar o indicador e confiar em seus sinais. Precisão e Eficiência Esta ferramenta foi rigorosamente calibrada, combinando múltiplos indicado
BB Premium
Ignacio Agustin Mene Franco
BB Premium, It is a new technique of bollinger bands, but this is the 2.0 where it marks sales rebounds, purchase rebounds, and breakouts, where in the middle it touches the golden line, and shows a sell signal, marks the red spot as there is a downtrend, where it bounces off the floor that goes out of the band, marks a buy signal and marks the gray spot very easy to use and easy to hunt scalps or long trends suitable for all seasons and Forex markets and synthetic indices! Good profit!
Antes de mais nada, vale ressaltar que este Sistema de Negociação é um Indicador Não Repintado, Não Redesenhado e sem Atrasos, o que o torna ideal para negociações profissionais. Curso online, manual do utilizador e demonstração. O "Sistema de Negociação de Suporte e Resistência Inteligente" é um indicador avançado projetado para traders novos e experientes. Empodera os traders com precisão e confiança no mercado forex. Este sistema abrangente combina mais de 7 estratégias, 10 indicadores e vár
Elder SafeZone Short
Financial Trading Seminars Inc.
SafeZone is a method for setting stops on the basis of recent volatility, outside the level of market noise. It is described in "Come into my Trading Room" book. In a downtrend, SafeZone defines noise as the portion of the current bar that extends above the high of the previous bar, against the downtrend. It averages the noise level over a period of time and multiplies it by a trader-selected factor. For short trades, it adds the average noise level, multiplied by a factor, to the latest high
Rainbow EA MT5
Jamal El Alama
Description : Rainbow EA MT5 is a simple Expert advisor based on   Rainbow MT5 indicator witch is based on Moving average with period 34. The indicator is incorporated in the EA, therefore, it is not required for the EA to operate, but if you wish, you can download it from   my product page . The Expert Advisor settings are as follows : Suitable for Timeframes up to H1 The parameters below can be set according to your trading rules. StopLoss ( Stop Loss in pips) TakeProfit ( Take Profit in pi
Moving Average RAINBOW
Kourosh Hossein Davallou
Moving Average RAINBOW Forex traders use moving averages for different reasons. Some use them as their primary analytical tool, while others simply use them as a confidence builder to back up their investment decisions. In this section, we'll present a few different types of strategies - incorporating them into your trading style is up to you! A technique used in technical analysis to identify changing trends. It is created by placing a large number of moving averages onto the same chart. When a
Os compradores deste produto também adquirem
TPSproTREND PrO MT5
Roman Podpora
4.83 (12)
TPSpro TREND PRO  - is a trend indicator that automatically analyzes the market and provides information about the trend and each of its changes, as well as giving signals for entering trades without redrawing! The indicator uses each candle, analyzing them separately. referring to different impulses - up or down impulse. Exact entry points into transactions for currencies, crypto, metals, stocks, indices!  Version MT4               DETAILED DESCRIPTION               R ecommended to use with an
INSTRUÇÕES         Russo   -        ENG       R   ecomendado para uso com um indicador       -       TPSpro   TREND PRO -   Versão MT4         Um elemento-chave na negociação são as zonas ou níveis a partir dos quais as decisões de comprar ou vender um instrumento de negociação são tomadas. Apesar das tentativas dos principais participantes de esconder sua presença no mercado, eles inevitavelmente deixam rastros. Nossa tarefa era aprender como identificar esses rastros e interpretá-los corretame
Trend Screener Pro MT5
STE S.S.COMPANY
4.88 (67)
Desbloqueie o poder da negociação de tendências com o indicador Trend Screener: sua solução definitiva de negociação de tendências, alimentada por lógica difusa e sistema de múltiplas moedas! Eleve sua negociação de tendências com o Trend Screener, o revolucionário indicador de tendências alimentado por lógica difusa. É um poderoso indicador de acompanhamento de tendências que combina mais de 13 ferramentas e recursos premium e 3 estratégias de negociação, tornando-o uma escolha versátil para to
FX Power MT5 NG
Daniel Stein
4.75 (8)
Desbloquear todo o poder do FX Power NG: o derradeiro medidor de força da moeda Durante mais de oito anos, o FX Power capacitou os operadores de todo o mundo com uma análise fiável e precisa da força da moeda. Agora, o FX Power NG leva esta ferramenta de confiança para o próximo nível, oferecendo funcionalidades avançadas que proporcionam uma precisão, personalização e conhecimentos inigualáveis à sua negociação. O que faz do FX Power NG uma ferramenta indispensável para os operadores sérios
Primeiramente, vale ressaltar que este Sistema de Trading é um Indicador Não Repintado, Não Redesenho e Não Atrasado, o que o torna ideal tanto para o trading manual quanto para o automatizado. Curso online, manual e download de predefinições. O "Sistema de Trading Inteligente MT5" é uma solução completa de trading projetada para traders novos e experientes. Ele combina mais de 10 indicadores premium e apresenta mais de 7 estratégias de trading robustas, tornando-o uma escolha versátil para dive
FX Volume MT5
Daniel Stein
4.93 (14)
Ganhe uma verdadeira vantagem no Forex com o Volume FX: O melhor indicador de volume O FX Volume é o primeiro e único indicador de volume a revelar o sentimento genuíno do mercado a partir de uma perspetiva interna. Ao fornecer informações exclusivas sobre como os participantes do mercado institucional e os corretores estão posicionados, o FX Volume permite que você negocie com a previsão geralmente reservada para os principais participantes. Diga adeus aos atrasos dos relatórios COT - o FX Vo
Atbot
Zaha Feiz
4.75 (44)
AtBot: Como funciona e como usá-lo ### Como funciona O indicador "AtBot" para a plataforma MT5 gera sinais de compra e venda usando uma combinação de ferramentas de análise técnica. Ele integra a Média Móvel Simples (SMA), a Média Móvel Exponencial (EMA) e o índice de Faixa Verdadeira Média (ATR) para identificar oportunidades de negociação. Além disso, pode utilizar velas Heikin Ashi para melhorar a precisão dos sinais. Deixe uma avaliação após a compra e receba um presente especial. ### Princ
IVISTscalp5
Vadym Zhukovskyi
5 (6)
Apresentamos a você o indicador iVISTscalp5, que não é apenas único, mas também eficaz em operações de negociação. Este indicador é baseado em dados de tempo e é o resultado de muitos anos de experiência e análise aprofundada dos mercados financeiros. O indicador iVISTscalp5 é uma excelente ferramenta para negociação manual. Conveniência, simplicidade e visualização - toda a complexidade está escondida dentro dele. Simplificamos as configurações e o uso do indicador iVISTscalp5 ao máximo. O indi
Gold Stuff mt5
Vasiliy Strukov
4.92 (171)
Gold Stuff mt5-um indicador de tendência projetado especificamente para o ouro, também pode ser usado em qualquer instrumento financeiro. O indicador não é redesenhado ou atrasado. O timeframe recomendado é H1. Importante! Entre em contato comigo imediatamente após a compra para obter instruções e bônus!  Você pode obter uma cópia gratuita do nosso indicador Strong Support e Trend Scanner, envie uma mensagem privada. a mim! PARÂMETRO Draw Arrow-incl.desligado. desenhar setas no gráfico. A
Descubra os níveis de FX: O seu melhor indicador de suporte e resistência para o sucesso da negociação O FX Levels é mais do que apenas um indicador de suporte e resistência; é um divisor de águas para traders sérios que desejam precisão, confiabilidade e funcionalidade contínua em todos os símbolos de negociação - sejam pares de moedas, índices, ações ou commodities. Construído com base no comprovado método Lighthouse e aprimorado com adaptabilidade dinâmica e em tempo real, o FX Levels traz
Este painel mostra os últimos   padrões harmónicos   disponíveis para os símbolos seleccionados, pelo que poupará tempo e será mais eficiente /   versão MT4 . Indicador gratuito:   Basic Harmonic Pattern Colunas do indicador Symbol :   aparecem os símbolos seleccionados Trend :   de alta ou de baixa Pattern :   tipo de padrão (gartley, borboleta, morcego, caranguejo, tubarão, cifra ou ABCD) Entry :   preço de entrada SL:   preço de paragem de perda TP1:   preço do 1º take profit TP2:   preç
Quantum TrendPulse
Bogdan Ion Puscasu
5 (3)
Apresentando   Quantum TrendPulse   , a ferramenta de negociação definitiva que combina o poder do   SuperTrend   ,   RSI   e   Stochastic   em um indicador abrangente para maximizar seu potencial de negociação. Projetado para traders que buscam precisão e eficiência, este indicador ajuda você a identificar tendências de mercado, mudanças de momentum e pontos de entrada e saída ideais com confiança. Principais características: Integração SuperTrend:   siga facilmente a tendência predominante do
TrendMaestro5
Stefano Frisetti
note: this indicator is for METATRADER4, if you want the version for METATRADER5 this is the link:  https://www.mql5.com/it/market/product/108106 TRENDMAESTRO ver 2.4 TRENDMAESTRO recognizes a new TREND in the bud, he never makes mistakes. The certainty of identifying a new TREND is priceless. DESCRIPTION TRENDMAESTRO identifies a new TREND in the bud, this indicator examines the volatility, volumes and momentum to identify the moment in which there is an explosion of one or more of these data a
Este é um indicador para MT5 que fornece sinais precisos para entrar em uma negociação sem redesenhar. Ele pode ser aplicado a qualquer ativo financeiro: forex, criptomoedas, metais, ações, índices. Ele fornecerá estimativas bastante precisas e informará quando é melhor abrir e fechar um negócio. Assista o vídeo (6:22) com um exemplo de processamento de apenas um sinal que compensou o indicador! A maioria dos traders melhora seus resultados de negociação durante a primeira semana de negociação c
ATrend
Zaha Feiz
4.88 (8)
ATREND: Como Funciona e Como Usá-lo #### Como Funciona O indicador "ATREND" para a plataforma MT5 é projetado para fornecer aos traders sinais robustos de compra e venda, utilizando uma combinação de metodologias de análise técnica. Este indicador aproveita principalmente o Intervalo Verdadeiro Médio (ATR) para medir a volatilidade, juntamente com algoritmos de detecção de tendências para identificar possíveis movimentos de mercado. Deixe uma mensagem após a compra e receba um brinde especial.
Apresentando       Quantum Breakout PRO   , o inovador Indicador MQL5 que está transformando a maneira como você negocia Breakout Zones! Desenvolvido por uma equipe de traders experientes com experiência comercial de mais de 13 anos,       Quantum Breakout PRO       foi projetado para impulsionar sua jornada comercial a novos patamares com sua estratégia de zona de fuga inovadora e dinâmica. O Quantum Breakout Indicator lhe dará setas de sinal em zonas de breakout com 5 zonas-alvo de lucro e
O Support And Resistance Screener está em um indicador de nível para MetaTrader que fornece várias ferramentas dentro de um indicador. As ferramentas disponíveis são: 1. Screener de estrutura de mercado. 2. Zona de retração de alta. 3. Zona de retração de baixa. 4. Pontos de Pivô Diários 5. Pontos Pivot semanais 6. Pontos Pivot mensais 7. Forte suporte e resistência com base no padrão harmônico e volume. 8. Zonas de nível de banco. OFERTA POR TEMPO LIMITADO: O indicador de suporte e resistência
Matrix Arrow Indicator MT5
Juvenille Emperor Limited
5 (13)
O   Matrix Arrow Indicator MT5   é uma tendência única 10 em 1 seguindo um indicador multi-timeframe   100% sem repintura   que pode ser usado em todos os símbolos/instrumentos:   forex ,   commodities ,   criptomoedas ,   índices ,   ações .  O  Matrix Arrow Indicator MT5  determinará a tendência atual em seus estágios iniciais, reunindo informações e dados de até 10 indicadores padrão, que são: Índice de movimento direcional médio (ADX) Índice de canal de commodities (CCI) Velas clássicas de
AW Trend Predictor MT5
AW Trading Software Limited
4.75 (52)
A combinação de níveis de tendência e quebra em um sistema. Um algoritmo de indicador avançado filtra o ruído do mercado, determina a tendência, os pontos de entrada e os possíveis níveis de saída. Os sinais indicadores são registrados em um módulo estatístico, que permite selecionar as ferramentas mais adequadas, mostrando a eficácia do histórico do sinal. O indicador calcula as marcas Take Profit e Stop Loss. Manual e instruções ->   AQUI   / versão MT4 ->   AQUI Como negociar com o indicador
Antes de tudo, vale ressaltar que esta Ferramenta de Negociação é um Indicador Não Repintante, Não Redesenhante e Não Atrasado, o que a torna ideal para negociação profissional. Curso online, manual do utilizador e demonstração. O Indicador de Conceitos de Ação de Preço Inteligente é uma ferramenta muito poderosa tanto para traders novos quanto experientes. Ele combina mais de 20 indicadores úteis em um único, combinando ideias avançadas de negociação como Análise do Trader do Círculo Intern
Golden Trend Indicator MT5
Noha Mohamed Fathy Younes Badr
5 (2)
Golden Trend indicator  is The best indicator for predicting trend movement this indicator never lags and never repaints and never back paints    and give  arrow buy and sell    before the candle appear  and it will help you and  will make your trading decisions clearer its work on all currencies and  gold and crypto and all time frame This unique  indicator uses very secret algorithms to catch the  trends, so you can trade using this indicator and see the trend clear on charts  manual guide and
TPA True Price Action indicator reveals the true price action of the market makers through 100% non-repainting signals strictly at the close of a candle! TPA shows entries and re-entries, every time the bulls are definitely stronger than the bears and vice versa. Not to confuse with red/green candles. The shift of power gets confirmed at the earliest stage and is ONE exit strategy of several. There are available now two free parts of the TPA User Guide for our customers. The first "The Basics"
** All Symbols x All Timeframes scan just by pressing scanner button ** *** Contact me  to send you instruction and add you in "123 scanner group" for sharing or seeing experiences with other users. After 17 years of experience in the markets and programming, Winner indicator is ready. I would like to share with you! Introduction The 123 Pattern Scanner indicator with a special enhanced algorithm is a very repetitive common pattern finder with a high success rate . Interestingly, this Winner in
Auto Order Block with break of structure based on ICT and Smart Money Concepts (SMC) Futures Break of Structure ( BoS )             Order block ( OB )            Higher time frame Order block / Point of Interest ( POI )    shown on current chart           Fair value Gap ( FVG ) / Imbalance   -  MTF      ( Multi Time Frame )    HH/LL/HL/LH  -  MTF      ( Multi Time Frame )  Choch  MTF      ( Multi Time Frame )  Volume Imbalance     ,  MTF          vIMB Gap’s Power of 3 Equal High
Quantum Trend Sniper
Bogdan Ion Puscasu
4.71 (49)
Apresentando       Quantum Trend Sniper Indicator   , o inovador Indicador MQL5 que está transformando a maneira como você identifica e negocia as reversões de tendência! Desenvolvido por uma equipe de traders experientes com experiência comercial de mais de 13 anos,       Indicador de Atirador de Tendência Quântica       foi projetado para impulsionar sua jornada de negociação a novos patamares com sua forma inovadora de identificar reversões de tendência com precisão extremamente alta. ***C
AT Forex Indicator MT5
Marzena Maria Szmit
5 (5)
The AT Forex Indicator MT5 is a sophisticated trading tool designed to provide traders with a comprehensive analysis of multiple currency pairs. This powerful indicator simplifies the complex nature of the forex market, making it accessible for both novice and experienced traders. AT Forex Indicator uses advanced algorithms to detect trends, patterns and is an essential tool for traders aiming to enhance their forex trading performance. With its robust features, ease of use, and reliable signal
Easy Buy Sell is a market indicator for opening and closing positions. It becomes easy to track market entries with alerts. It indicates trend reversal points when a price reaches extreme values ​​and the most favorable time to enter the market. it is as effective as a Fibonacci to find a level but it uses different tools such as an algorithm based on ATR indicators and Stochastic Oscillator. You can modify these two parameters as you wish to adapt the settings to the desired period. It canno
ICT, SMC, SMART MONEY CONCEPTS, SMART MONEY, Smart Money Concept, Support and Resistance, Trend Analysis, Price Action, Market Structure, Order Blocks, BOS/CHoCH,   Breaker Blocks ,  Momentum Shift,   Supply&Demand Zone/Order Blocks , Strong Imbalance,   HH/LL/HL/LH,    Fair Value Gap, FVG,  Premium  &   Discount   Zones, Fibonacci Retracement, OTE, Buy Side Liquidity, Sell Side Liquidity, BSL/SSL Taken, Equal Highs & Lows, MTF Dashboard, Multiple Time Frame, BigBar, HTF OB, HTF Market Structure
Bill Williams Advanced
Siarhei Vashchylka
5 (8)
Bill Williams Advanced is designed for automatic chart analysis using Bill Williams' "Profitunity" system. The indicator analyzes four timeframes at once. Manual (Be sure to read before purchasing) Advantages 1. Automatically analyzes the chart using the "Profitunity" system of Bill Williams. The found signals are placed in a table in the corner of the screen. 2. Equipped with a trend filter based on the Alligator indicator. Most of the system signals are recommended to be used only accordi
IX Power MT5
Daniel Stein
4.17 (6)
O   IX Power   traz finalmente a precisão imbatível do FX Power para símbolos não-Forex. Determina com exatidão a intensidade das tendências a curto, médio e longo prazo nos seus índices, acções, mercadorias, ETFs e até criptomoedas favoritos. Pode   analisar tudo o que   o seu terminal tem para oferecer. Experimente e veja como   o seu timing melhora significativamente   quando negoceia. Características principais do IX Power Resultados de cálculo 100% precisos e sem repintura - para tod
Mais do autor
Symbol Manager for MT5
Taras Slobodyanik
5 (1)
Symbol Manager or Grid Manager, designed to group orders into one position (by symbol and by direction). This utility will be useful to multi-currency traders, who can have multiple orders on several pairs. You will be able to see the total number of lots, the total profit, and set virtual stop loss and virtual take profit. To set a real TP (or SL), you must first set the virtual value, and then enter the command in this cell: "set". If you want to set real TP/SL for all orders at once, then en
Time Scale for MT5
Taras Slobodyanik
4.64 (22)
The indicator draws the time scale on the chart. You can specify the time offset, adjust the size and font to display on the chart ( it is displaying your local time on your chart instead of MT time ). You can also select the desired format for displaying the date and time. You may be interested in my other product , which contains a more advanced version of the Time Scale . Parameters Hours (time shift) — time shift (hours); Minutes (time shift) — time shift (minutes); Show time on mouse — sh
FREE
ZigZag Lines MTF for MT5
Taras Slobodyanik
5 (10)
Indicador ZigZag de vários períodos de tempo. Ele exibe as linhas horizontais de suporte/resistência e seus rompimentos, bem como desenha as metas atuais do mercado. Também pode exibir linhas do indicador Fractais e velas de outros períodos (até Trimestral). O indicador redesenha o último ponto (atual) e, em alguns casos, pode alterar os últimos 2-3 pontos. Todas as linhas são desenhadas como objetos (não buffers de indicadores, mas existe a possibilidade de receber os dados para o EA). Qua
ADX Dashboard MT5
Taras Slobodyanik
5 (4)
O indicador ADX é usado para determinar a tendência e sua força. A direção do preço é mostrada pelos valores +DI e -DI, e o valor ADX mostra a força da tendência. Se +DI estiver acima de -DI, então o mercado está em tendência de alta, se ao contrário, está em tendência de baixa. Se o ADX estiver abaixo de 20, não há uma direção definida. Assim que o indicador ultrapassa este nível, começa uma tendência de força média. Valores acima de 40 indicam uma tendência forte (tendência de baixa ou tendên
ZigZag Dashboard for MT4
Taras Slobodyanik
4.75 (4)
Modificação multimoeda e multitimeframe do indicador ZigZag. Exibe a direção atual do mercado, a altura do último movimento, o número de barras neste movimento e a quebra do ponto anterior do ZigZag (linha horizontal). Este é o scanner MTF. Você pode especificar quaisquer moedas e prazos desejados nos parâmetros. Além disso, o painel pode enviar notificações quando o ZigZag mudar de direção ou quando houver um rompimento do ponto anterior. Ao clicar em uma célula com ponto final, este símbolo
Modificação multimoeda e multitimeframe do Oscilador Estocástico. Você pode especificar quaisquer moedas e prazos desejados nos parâmetros. O painel exibe os valores atuais e as interseções das linhas — Sinal e Principal (cruzamento estocástico). Além disso, o indicador pode enviar notificações ao cruzar os níveis de sobrecompra e sobrevenda. Ao clicar em uma célula com ponto final, este símbolo e ponto final serão abertos. Este é o scanner MTF. Semelhante ao Medidor de Força da Moeda, o Painel
O indicador desenha automaticamente os níveis de Fibonacci com base no indicador ZigZag, sessões de negociação, fractais ou velas (incluindo períodos de tempo não padrão: ano, 6 meses, 4 meses, 3 meses, 2 meses) (Retração Fibo Automática). Você pode escolher qualquer período de tempo superior para o cálculo de Fibonachi. Os níveis são redesenhados sempre que a barra atual fecha. É possível ativar alertas ao cruzar os níveis especificados. Você também pode analisar níveis no histórico. Para fa
Indicador de múltiplas moedas e multiprazos Inside Bar (IB). Nos parâmetros, você pode especificar quaisquer moedas e prazos desejados. O painel exibe o último padrão da barra interna (e da barra mãe) encontrado, a posição atual do preço e o rompimento dos níveis das barras mãe e interna. Você pode definir o tamanho e a cor das barras e do texto nas células. O indicador também pode enviar notificações quando os níveis são quebrados. Ao clicar em uma célula com ponto final, o símbolo e ponto fin
Modificação multimoeda e multitimeframe do Oscilador Estocástico. Você pode especificar quaisquer moedas e prazos desejados nos parâmetros. O painel exibe os valores atuais e as interseções das linhas — Sinal e Principal (cruzamento estocástico). Além disso, o indicador pode enviar notificações ao cruzar os níveis de sobrecompra e sobrevenda. Ao clicar em uma célula com ponto final, este símbolo e ponto final serão abertos. Este é o scanner MTF. Semelhante ao Medidor de Força da Moeda, o Painel
Indicador Heikin Ashi multimoeda e multitimeframe. Mostra o estado atual do mercado. No painel do scanner você pode ver a direção, força e número de barras da tendência atual. As velas de Consolidação/Reversão também são mostradas em cores. Você pode especificar quaisquer moedas e períodos desejados nos parâmetros. Além disso, o indicador pode enviar notificações quando a tendência muda ou quando velas de reversão e consolidação (dojis) aparecem. Ao clicar em uma célula, este símbolo e ponto fi
O indicador mostra os níveis máximo/baixo/aberto/fechado de outros períodos de tempo (e não padrão) - Ano, 6 meses, 4 meses, 3 meses, 2 meses, mês, semana, dia, H3-H6-H8-H12 horas . Você também pode definir o turno de abertura das velas e construir velas virtuais. Os "separadores de período" para um desses intervalos de tempo estão disponíveis na forma de linhas verticais. Os alertas podem ser configurados para quebras dos níveis atuais ou anteriores (quebra da linha alta/baixa de ontem/semana
MACD Dashboard
Taras Slobodyanik
Indicador MACD de múltiplas moedas e vários prazos. O painel pode exibir o MACD tradicional (verdadeiro) e o MACD integrado ao MetaTrader. No painel você pode ver o estado atual do indicador — a direção do movimento das linhas MACD, sua interseção e uma janela pop-up com o gráfico do indicador. Nos parâmetros você pode especificar quaisquer pares de símbolos e prazos desejados. O scanner também pode enviar notificações sobre linhas que se cruzam e sobre linhas que cruzam o nível Zero. Ao clic
Modificação multimoeda e multitimeframe do indicador Bollinger Bands. No painel você pode ver os rompimentos e toques das Bandas de Bollinger. Nos parâmetros você pode especificar quaisquer moedas e prazos desejados. O indicador também pode enviar notificações quando o preço toca as Bandas de Bollinger, quando a volatilidade atual muda (expande ou cai) e quando o preço toca todas as bandas. Ao clicar em uma célula com ponto final, este símbolo e ponto final serão abertos. Este é o scanner MTF.
CCI Dashboard for MT5
Taras Slobodyanik
5 (1)
Modificação multimoeda e multitimeframe do indicador Commodity Channel Index (CCI). Você pode especificar quaisquer moedas e prazos desejados nos parâmetros. Além disso, o painel pode enviar notificações ao cruzar níveis de sobrecompra e sobrevenda. Ao clicar em uma célula com ponto final, este símbolo e ponto final serão abertos. Este é o scanner MTF. A chave para ocultar o painel do gráfico é “D” por padrão. Parâmetros CCI Period — período médio. CCI Applied price — tipo de preço. Cle
MA Dashboard MT5
Taras Slobodyanik
5 (4)
Modificação multimoeda e multitimeframe do indicador Moving Average (MA). No painel você pode ver o estado atual do indicador - rompimentos e toques (por preço) do MA Rápido e MA Lento, bem como a intersecção das linhas MA entre si (cruzamento da média móvel). Nos parâmetros você pode especificar quaisquer moedas e prazos desejados. Além disso, o indicador pode enviar notificações sobre o preço tocando as linhas e sobre o seu cruzamento. Ao clicar em uma célula com ponto final, este símbolo e p
Lines Profit Loss MT5
Taras Slobodyanik
4.58 (12)
O indicador exibe lucro (perda) no símbolo atual. Você pode arrastar e soltar livremente a linha para exibir o lucro ou perda atual. Parâmetros Calculation in money or in points — calcule o lucro/perda em pontos ou dinheiro. Add pending orders to calculate — leve em consideração os pedidos pendentes nos cálculos. Magic Number (0 - all orders on symbol) — número mágico, caso seja necessário avaliar pedidos específicos. Offset for first drawing (points from the average price) — deslocamento
FREE
ADX Dashboard
Taras Slobodyanik
5 (4)
O indicador ADX é usado para determinar a tendência e sua força. A direção do preço é mostrada pelos valores +DI e -DI, e o valor ADX mostra a força da tendência. Se +DI estiver acima de -DI, então o mercado está em tendência de alta, se ao contrário, está em tendência de baixa. Se o ADX estiver abaixo de 20, não há uma direção definida. Assim que o indicador ultrapassa este nível, começa uma tendência de força média. Valores acima de 40 indicam uma tendência forte (tendência de baixa ou tendên
Heikin Ashi Dashboard
Taras Slobodyanik
5 (4)
Indicador Heikin Ashi multimoeda e multitimeframe. Mostra o estado atual do mercado. No painel do scanner você pode ver a direção, força e número de barras da tendência atual. As velas de Consolidação/Reversão também são mostradas em cores. Você pode especificar quaisquer moedas e períodos desejados nos parâmetros. Além disso, o indicador pode enviar notificações quando a tendência muda ou quando velas de reversão e consolidação (dojis) aparecem. Ao clicar em uma célula, este símbolo e ponto fi
Modificação multimoeda e multitimeframe do indicador Índice de Força Relativa (RSI). Você pode especificar quaisquer moedas e prazos desejados nos parâmetros. Além disso, o painel pode enviar notificações ao cruzar níveis de sobrecompra e sobrevenda. Ao clicar em uma célula com ponto final, este símbolo e ponto final serão abertos. Este é o scanner MTF. A chave para ocultar o painel do gráfico é “D” por padrão. Semelhante ao Medidor de Força da Moeda, o Painel pode selecionar automaticament
Indicador multimoeda e multitimeframe do Canal de Desvio Padrão. Exibe a direção atual do mercado. No painel você pode ver rompimentos e toques (por preço) dos níveis do canal de regressão linear. Nos parâmetros, você pode especificar quaisquer moedas e prazos desejados. Além disso, o indicador pode enviar notificações quando os níveis são atingidos. Ao clicar em uma célula, este símbolo e ponto final serão abertos. Este é o scanner MTF. A chave para ocultar o painel do gráfico é “D” por padr
O indicador possui três ferramentas principais: Lupa (gráfico de zoom), Régua (escalas de tempo e preço) e Mira. Você pode mover tudo com o mouse e personalizar diferentes formatos de exibição, personalizar o tamanho e a cor de cada elemento. A Lupa   (gráfico de zoom) permite exibir velas de qualquer período de tempo e em diferentes escalas. Teclas de atalho padrão: 'Q' - período de tempo mais alto, 'A' - período de tempo mais baixo, 'W' - diminui o tamanho da vela, 'S' - aumenta o tamanho d
Inside Bar Dashboard
Taras Slobodyanik
5 (2)
Indicador de múltiplas moedas e multiprazos Inside Bar (IB). Nos parâmetros, você pode especificar quaisquer moedas e prazos desejados. O painel exibe o último padrão da barra interna (e da barra mãe) encontrado, a posição atual do preço e o rompimento dos níveis das barras mãe e interna. Você pode definir o tamanho e a cor das barras e do texto nas células. O indicador também pode enviar notificações quando os níveis são quebrados. Ao clicar em uma célula com ponto final, o símbolo e ponto fin
Gann Square of 144
Taras Slobodyanik
5 (5)
A Gann Box (ou Gann Square) é um método de análise de mercado baseado no artigo "Fórmula matemática para previsões de mercado" de WD Gann. Este indicador pode representar três modelos de Quadrados: 90, 52(104), 144. Existem seis variantes de grades e duas variantes de arcos. Você pode plotar vários quadrados em um gráfico simultaneamente. Parâmetros Square — seleção de um modelo quadrado: 90 — quadrado de 90 (ou quadrado de nove); 52 (104) — quadrado de 52 (ou 104); 144 — quadrado universal
Lines Profit Loss
Taras Slobodyanik
4.93 (14)
O indicador exibe lucro (perda) no símbolo atual. Você pode arrastar e soltar livremente a linha para exibir o lucro ou perda atual. Parâmetros Calculation in money or in points — calcule o lucro/perda em pontos ou dinheiro. Add pending orders to calculate — leve em consideração os pedidos pendentes nos cálculos. Magic Number (0 - all orders on symbol) — número mágico, caso seja necessário avaliar pedidos específicos. Offset for first drawing (points from the average price) — deslocamento
FREE
Angle Dashboard
Taras Slobodyanik
5 (1)
This is a multicurrency and multitimeframe indicator that calculates the angle between two points. Points for measuring the angle can be taken from the ZigZag (the last two points), or from the Moving Average (between two given bars), or it can be the closing prices of bars. Angle measurement is possible in degrees or in radians. You can select the scale for the calculation. For a better understanding of the indicator, you can study the free Angle High Low indicator. In the parameters you can
Inside Bar MT5
Taras Slobodyanik
The indicator determines the inside bar and marks its High/Low. It is plotted based on the closed candles (does not redraw). The identified inside bar can be displayed on the smaller periods. You may set a higher period (to search for the inside bar) and analyze on a smaller one. Also you can see the levels for Mother bar. Indicator Parameters Period to find Inside Bar — the period to search for the inside bar. If a specific period is set, the search will be performed in that period. Type of i
ZigZag Lines MTF
Taras Slobodyanik
4.38 (13)
Indicador ZigZag de vários períodos de tempo. Ele exibe as linhas horizontais de suporte/resistência e seus rompimentos, bem como desenha as metas atuais do mercado. Também pode exibir linhas do indicador Fractais e velas de outros períodos (até Trimestral). O indicador redesenha o último ponto (atual) e, em alguns casos, pode alterar os últimos 2-3 pontos. Todas as linhas são desenhadas como objetos (não buffers de indicadores, mas existe a possibilidade de receber os dados para o EA). Qua
Pro Sessions MT4
Taras Slobodyanik
4.67 (3)
Este é um indicador de pregões que pode exibir todos os níveis (Aberto-Alto-Baixo-Fechar) durante quatro sessões. O indicador também pode prever os níveis da sessão. As sessões podem ser desenhadas com linhas ou retângulos (vazios ou preenchidos), as linhas podem ser estendidas para a próxima sessão. Você pode facilmente ocultar/mostrar cada sessão pressionando teclas de atalho (por padrão '1', '2', '3', '4'). Você pode ver linhas ASR (intervalo médio de sessão) (tecla de atalho padrão 'A').
Time Scale
Taras Slobodyanik
4.82 (11)
The indicator draws the time scale on the chart. You can specify the time offset, adjust the size and font to display on the chart (it is displaying your local time on your chart instead of MT time). You can also select the desired format for displaying the date and time. While holding down the middle mouse button, and moving the cursor, a slider will appear on the scale. You may be interested in my other product , which contains a more advanced version of the Time Scale. Parameters Hours (tim
FREE
News Dashboard MT4
Taras Slobodyanik
4.43 (7)
Este painel exibe notícias atuais de três fontes: do site ForexFactory.com (calendário FFC), do site Investing.com e do Calendário Econômico de mql5.com. Você pode classificar as notícias por impacto e por país e exibi-las no gráfico com um clique. Ao manter pressionada a tecla 'Ctrl', você pode selecionar várias 'moedas' ou 'impactos' diferentes para classificar. Além disso, este utilitário mostra não apenas a previsão, mas também os valores reais após aparecerem no site. Você pode definir uma
Filtro:
Adz trading
139
Adz trading 2024.02.16 12:08 
 

Ajout des alertes du changement de direction du Rsi c est le top en plus du monitoring, multi symbol, multi times frime ❤️

ZERO9898
1924
ZERO9898 2024.01.08 16:09 
 

O usuário não deixou nenhum comentário para sua avaliação

Kurren James Kidd
470
Kurren James Kidd 2023.11.09 18:25 
 

O usuário não deixou nenhum comentário para sua avaliação

Mike Louw
294
Mike Louw 2022.10.12 15:54 
 

Multi currency RSI dash is a great indicator to find extended market conditions, all in one place. I also use it as a mini operating system which is compact and can be nestled into a corner of a chart. Instead of having to drag symbols manually from the Market Watch window or switch between profiles, just click on any pair in the dash and the symbol changes instantly. With multiple timeframe windows, add a free ChartSync indicator and all change simultaneously. Parameter settings are extensive and the author is very accommodating. With version 3.2, I can highlight the name of a pair/s and make my own watch list. No more fumbling around...Thank you!

toastatacke
159
toastatacke 2022.09.05 16:58 
 

First look is great and it works well. In further updates would be very nice if the Text color is changeable so it is usable with dark background in MT and a button for fast hiding and showing the indicator

Multi Disipliner
352
Multi Disipliner 2022.02.21 21:26 
 

very nice. thanks

Roberto Alencar
1205
Roberto Alencar 2020.05.04 15:12 
 

The best

lilychu1911
49
lilychu1911 2019.09.02 05:27 
 

Great indicator to monitor RSI for all timeframes in one place. Thank you.

Responder ao comentário
Versão 5.50 2024.10.28
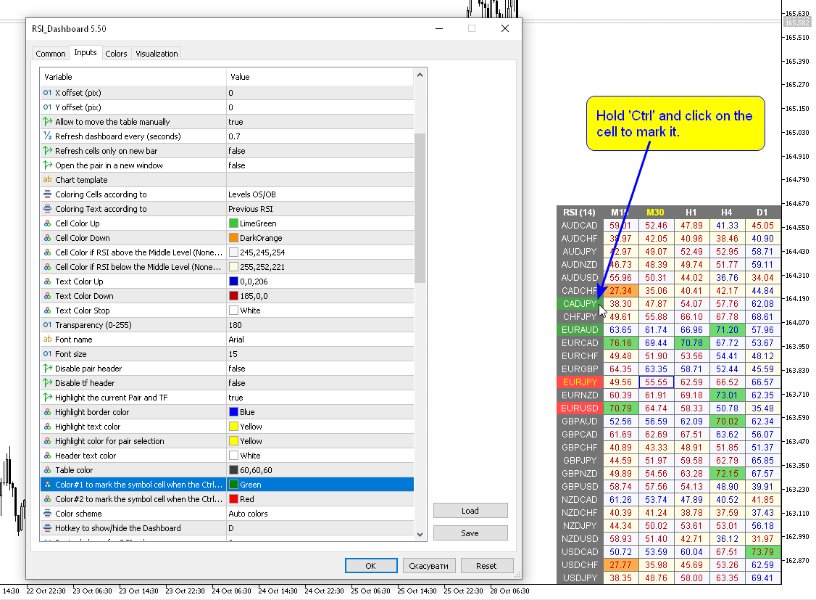
1) Added the ability to manually mark a cell with a symbol. While holding down the Ctrl key, you need to click on the cell with the symbol. To reset of all Marks and Alerts in the Symbols column, click on the cell with the indicator name.

Versão 5.40 2024.09.27
1) Added alert "All TFs in same direction (rising or falling)".
Versão 5.30 2024.09.12
1) Added parameter: Higher TF filter for 'Entry into the OB/OS zones'. If upon entering the zone the next (higher) TF matches the specified condition, an alert will be sent, otherwise the alert will be skipped.
Versão 5.20 2024.03.14
1) Changed the behavior of setting the timer at startup. Now the indicator tries to start the timer again when a new tick arrives. If there is no tick for a long time (or it’s a weekend), you can click on the button on the chart and restart the timer yourself.
Versão 5.10 2024.02.16
1) Now the "Alert when RSI direction changes" parameter can send alerts from the current bar.
Versão 5.0 2024.02.14
1) Added a new alert: "Alert when RSI direction changes (by closed bars)".
Versão 4.90 2023.11.12
1) Fixed calculation of cell width when "Decimal places" is equal to zero.
Versão 4.80 2023.11.11
1) Added automatic shifting of the dashboard to the foreground.
Versão 4.70 2023.09.26
1) The "Cell Color Stop" parameter is divided into the "Cell Color if RSI above the Middle Level" and "Cell Color if RSI below the Middle Level" (None-off) parameters.
2) The "Y-offset (pix, +/-)" parameter can now be negative.
Versão 4.60 2023.09.03
1) Added "Hotkey to enable/disable the Popup chart" parameter for "Popup chart".
2) Added "Y-offset (pix)" parameter for "Popup chart".
Versão 4.50 2023.08.28
1) Added a Dashboard recovery check when running multiple copies on the same chart.
Versão 4.40 2023.08.25
1) Returned the deletion of the dashboard from the chart at startup.
Versão 4.30 2023.08.18
1) Optimization of pop-up windows for MT5.
Versão 4.20 2023.07.29
1) Added a hotkey to hide the dashboard, by default "D".
2) The condition of the list of pairs for the second parameter has been changed. Pairs in the second parameter must be typed only with a semicolon and must be in exact case. "Pairs (separated ONLY by a semicolon and have exact letter case)"
Versão 4.10 2023.07.19
1) Added parameter "Enable text tooltip in the table".
Versão 4.0 2023.07.19
1) Added "Popup chart" parameters. Now, when you hover the mouse over the cells, you can see a pop-up chart from this timeframe.
2) Fixed some minor bugs.
Versão 3.90 2023.07.01
1) Fixed bug "RSI for One Currency" for different "Set of Pairs".
Versão 3.80 2023.06.21
1) Added alert: "All TFs exit OB/OS (previously all TFs were in this OB/OS)". For it to work, the RSI of all timeframes must first visit the Overbought or Oversold zone.
2) For "All timeframes" alerts, the "Check alerts only on bar closing" parameter now works. Values are checked only for closed candles of each timeframe.
Versão 3.70 2023.06.13
1) Added parameters "RSI for One Currency" and "Reverse RSI value". The dashboard will automatically select pairs containing the specified Currency or those pairs that have this Currency as the base. The indicator will also calculate the RSI for this Currency on a separate line.
Versão 3.60 2023.06.01
1) Fixed text color when clicking on the pair name - "Alerts On".
Versão 3.50 2023.05.31
1) Added "Coloring Text according to" parameter.
2) Added tooltips.
3) Changed the color scheme.
4) Added "Color scheme" parameter.
Versão 3.40 2023.05.19
1) Added parameter "Decimal places for RSI values".
Versão 3.30 2022.11.29
1) Fixed bug with "Alert mode combined in a row".
Versão 3.20 2022.10.11
1) Added parameter: "Highlight color for pair selection".
Versão 3.10 2022.10.11
1) Added the ability to enable/disable alerts for each Symbol when clicking on the name of the Pair. If no Pair is selected then alerts are enabled for all Symbols.
Versão 3.0 2022.09.20
1) Disabled stopping the indicator in case of an error starting the RSI. Now there will be a repeated attempt to launch the RSI.
Versão 2.90 2022.09.09
1) Separate parameters for alerts for each zone (separately for entering the zone and exiting the zone).
2) Added parameters and alerts for the Middle level.
Versão 2.80 2022.09.08
1) Added parameters to change table colors.
Versão 2.70 2022.04.18
1) Added a parameter to highlight the current Pair and TF.
Versão 2.60 2021.08.24
1) Fixed a bug when launching many indicators with the "Current pair" parameter.
Versão 2.50 2021.04.16
1) Added parameter "Allow to move the table manually". Now, after double-clicking on the table headers, you can move it with the mouse. The binding to the corner of the chart remained unchanged.
Versão 2.40 2021.03.19
1) Added options to disable the table headers.
Versão 2.30 2021.02.17
1) Added the "Refresh cells only on new bar" parameter.
Versão 2.20 2020.06.08
1) Recompilation for the new MT5 build.
Versão 2.10 2020.03.19
1) Separate settings for alerts so that you can disable each separately.
Versão 2.0 2019.11.22
1) Added parameters for changing the text of alerts.
Versão 1.90 2019.11.06
1) Changed the alert algorithm when the indicator starts.
Versão 1.80 2019.10.26
1) Added periods for alerts - "Timeframes for alerts".
2) Added parameter for clearing the chart at startup - "Clear the chart at startup".
3) Added center alignment of the panel - "Centered".
4) Added offsets for the panel - "X offset (pix)" and "Y offset (pix)".
5) Reverse the order of pairs of "Market Watch" without sorting.
Versão 1.70 2019.02.21
1) Added an alert to exit the overbought / oversold zone.
2) Added parameter: "Check alerts only on bar closing".
Versão 1.60 2018.11.06
1) Added an alert when all timeframes are oversold or overbought.
Versão 1.50 2018.10.15
The color scheme has been fixed, now a white scheme is used for background colors other than black.
Versão 1.40 2018.07.09
1) Added the "Set of Pairs" parameter to select the symbols of the Market Watch.
2) Added parameter "Chart template". The specified template will be applied when opening a chart.
3) Code optimization.
Versão 1.30 2018.03.23
1) Added one more option for the list of pairs - "Pairs". One line can contain up to 256 characters.
2) Now the names of pairs can be set in both upper and lower case. If the name contains both cases, then the exact name should be specified.
3) Code optimization.
Versão 1.20 2018.02.19
1) Added parameter: Coloring the cells according to the Levels or to the Previous candle.
2) Added the ability to run several indicators on one chart.
Versão 1.10 2018.02.05
1) Removed automatic change of the letter case. Now the currency names should be written exactly like the broker's, keeping the case and prefix/suffix.
2) Added a tooltip for each cell.