Master Figures
- Indicadores
- Andrey Kozak
- Versão: 1.0
- Ativações: 5
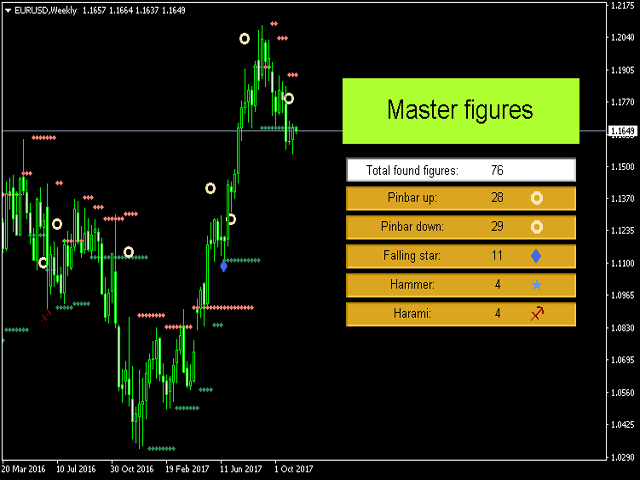
The Master Figures indicator analyzed the market for the most common chart patterns.
The first pattern is called Pin bar. This pattern can rightly be considered one of the most widespread. This pattern looks like a candle with a small body and large tail (wick). Once you see it on the chart, open a position against the wick. It is better to use the resistance lines for closing. Master Figures shows this pattern in the form of circles. A position should be opened when a new candle appears after the Pin bar.
The next pattern is Shooting Star. Master Figures displays it in the form of stars on the chart. This pattern is very similar to Pin bar, but it has its own peculiarities. In particular, the candle wick may be 2 or more times longer than the body, but the previous candle must be bullish relative to the signal candle, while the next one should be bearish. More accurate signals for this pattern are generated on the higher timeframes, H4 and higher.
A pattern inverse to Shooting Star is Hammer. The principle is the same, but the wick of the signal candle is downwards, the previous candle is bearish and the next one is bullish. Enter the market when the last candle closes in the ascending position.
The next pattern displayed by the Master Figures indicator on the chart is Harami. It is a model of two candlesticks. First a large candle appears, followed by a small candle. In this case, the small candle is fully engulfed by the large one. The first candle of the pattern has small wicks, ideally - none at all. The second candle has small wicks, which can be no longer than twice the body. If they exceed that size, the entry is made against the trend as well, but the pattern is called "Harami Cross".
Working with the Master Figures indicator
- It is recommended to close open orders when the price reaches a resistance line. The Master Figures indicator displays these lines on the chart as well.
- The trades should be opened on the bar following the signal bar, where the pattern was formed. This is explained by the fact that as long as the bar is not closed, the patterns may change their shapes, and a Harami may turn into a Harami Cross. This is a normal situation on the market, which simply has to be taken into account when building trading systems.
Settings of the Master Figures indicator
- bars - the number of bars to display the indicator.
- inform - show/hide the information panel on the chart.
- pinbar - show/hide Pin bars on the chart.
- color_pinbar - color of the Pin bar pattern.
- size_pinbar - size of the Pin bar pattern.
- Falling_star - show/hide the Shooting Star pattern.
- color_Falling_star - color of the Shooting Star pattern.
- size_Falling_star - size of the Shooting Star pattern.
- Hammer - show/hide the Hammer pattern.
- color_Hammer - color of the Hammer pattern.
- size_Hammer - size of the Hammer pattern.
- Harami - show/hide the Harami pattern.
- color_Harami - color of the Harami pattern.
- size_Harami - size of the Harami pattern.
- information_panel_color, information_panel_color2, information_panel_color3 - color palette of the information panel.
- Resistance - show/hide the resistance lines.
- Step - resistance change step.
- Sensitivity - resistance sensitivity.
- Indenting - indent on bars.
- Resistance_color1, Resistance_color2 - color of the resistance lines.


















O usuário não deixou nenhum comentário para sua avaliação